| Param | Original file | Final file |
|---|---|---|
| Filename | modeM0/AS1G08_078T01_9000002110_14339cztM0_level2.evt | modeM0/AS1G08_078T01_9000002110_14339cztM0_level2_quad_clean.evt |
| Size (bytes) | 609,442,560 | 99,328,320 |
| Size | 581.2 MB | 94.7 MB |
| Events in quadrant A | 3,950,521 | 632,569 |
| Events in quadrant B | 4,049,946 | 639,344 |
| Events in quadrant C | 3,744,149 | 635,976 |
| Events in quadrant D | 6,222,287 | 596,081 |
| Mode SS | |||
|---|---|---|---|
| Quadrant | BADHDUFLAG | Total packets | Discarded packets |
| A | 0 | 148 | 0 |
| B | 0 | 148 | 0 |
| C | 0 | 148 | 0 |
| D | 0 | 148 | 0 |
| Mode M0 | |||
|---|---|---|---|
| Quadrant | BADHDUFLAG | Total packets | Discarded packets |
| A | 0 | 16285 | 3 |
| B | 0 | 16812 | 2 |
| C | 0 | 15464 | 2 |
| D | 0 | 23554 | 2 |
| Mode M9 | |||
|---|---|---|---|
| Quadrant | BADHDUFLAG | Total packets | Discarded packets |
| A | 0 | 20 | 0 |
| B | 0 | 20 | 0 |
| C | 0 | 20 | 0 |
| D | 0 | 20 | 0 |
| Quadrant | Total seconds | Saturated seconds | Saturation percentage |
|---|---|---|---|
| A | 7242 | 118 | 1.629384% |
| B | 7242 | 185 | 2.554543% |
| C | 7242 | 52 | 0.718034% |
| D | 7242 | 308 | 4.252969% |
Noise dominated data is calculated using 1-second bins in cleaned event files. If a bin has >2000 counts, and if more than 50% of those come from <1% of pixels, then it is considered to be noise-dominated and hence unusable.
| Quadrant | # 1 sec bins | Bins with >0 counts | Bins with >2000 counts | High rate bins dominated by noise | Noise dominated (total time) | Noise dominated (detector-on time) | Marked lightcurve |
|---|---|---|---|---|---|---|---|
| A | 9178 | 7244 | 70 | 70 | 0.76% | 0.97% | 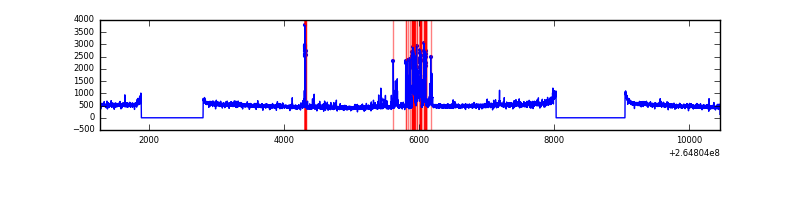 |
| B | 9178 | 7243 | 74 | 74 | 0.81% | 1.02% | 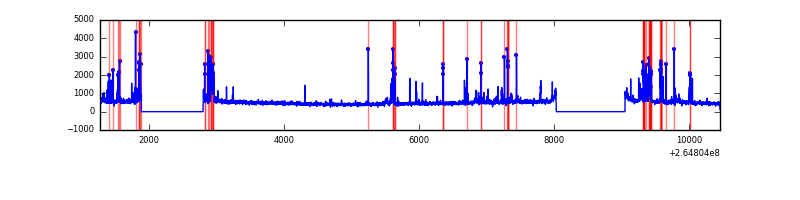 |
| C | 9178 | 7244 | 1 | 1 | 0.01% | 0.01% | 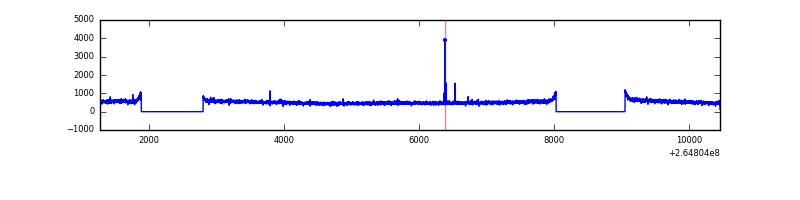 |
| D | 9178 | 7245 | 202 | 202 | 2.20% | 2.79% | 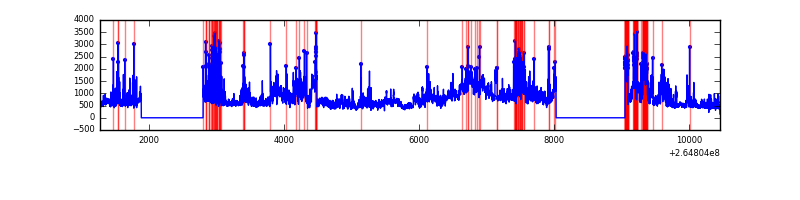 |
Top three noisy pixels from each quadrant. If the there are fewer than three noisy pixels in the level2.evt file, extra rows are filled as -1
| Pixel properties | Quadrant properties | ||||||
|---|---|---|---|---|---|---|---|
| Quadrant | DetID | PixID | Counts | Sigma | Mean | Median | Sigma |
| A | 12 | 189 | 369610 | 2072.74 | 884 | 865 | 177.9 |
| A | 8 | 15 | 132530 | 740.1 | 884 | 865 | 177.9 |
| A | 4 | 2 | 42670 | 234.99 | 884 | 865 | 177.9 |
| B | 0 | 229 | 301949 | 1770.5 | 883 | 860 | 170.1 |
| B | 10 | 16 | 218280 | 1278.5 | 883 | 860 | 170.1 |
| B | 0 | 189 | 28128 | 160.34 | 883 | 860 | 170.1 |
| C | 3 | 233 | 355456 | 1761.29 | 867 | 872 | 201.3 |
| C | 14 | 234 | 10851 | 49.57 | 867 | 872 | 201.3 |
| C | 13 | 61 | 6134 | 26.14 | 867 | 872 | 201.3 |
| D | 1 | 52 | 2076800 | 10317.5 | 845 | 824 | 201.2 |
| D | 5 | 222 | 350789 | 1739.31 | 845 | 824 | 201.2 |
| D | 12 | 110 | 192378 | 952.01 | 845 | 824 | 201.2 |
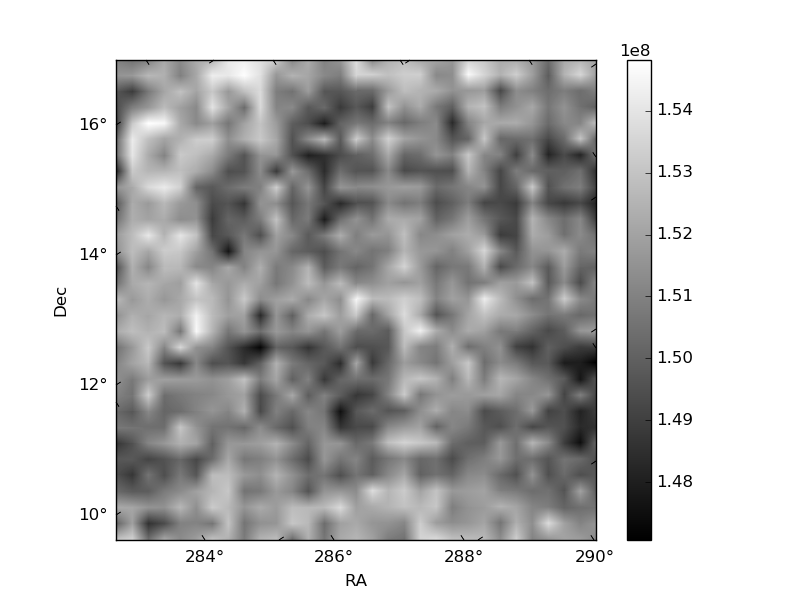
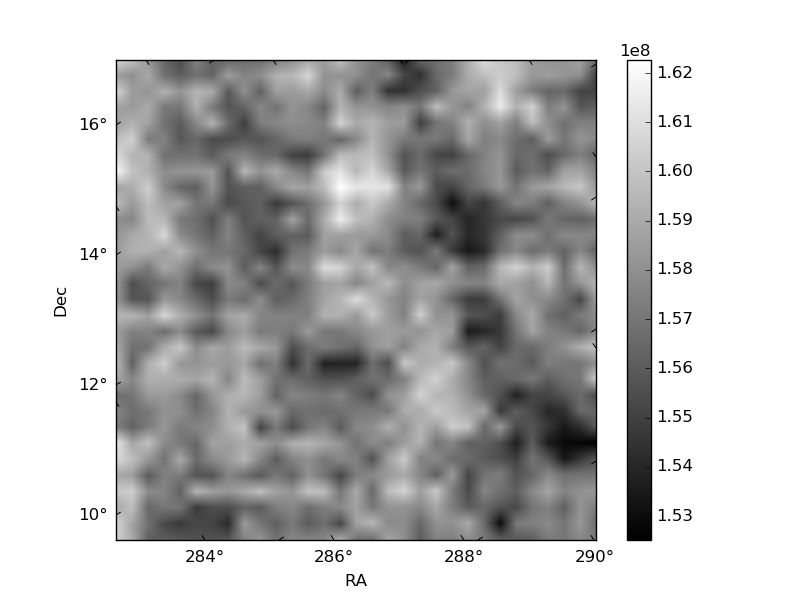
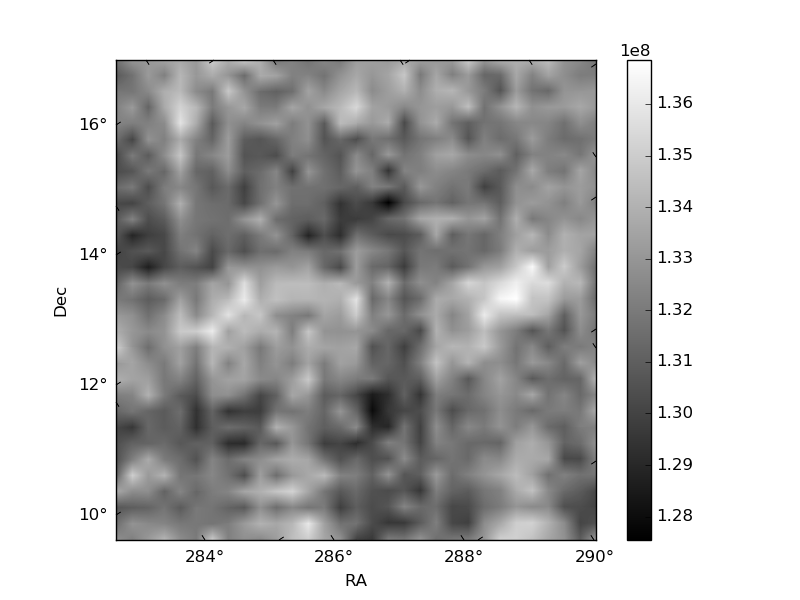
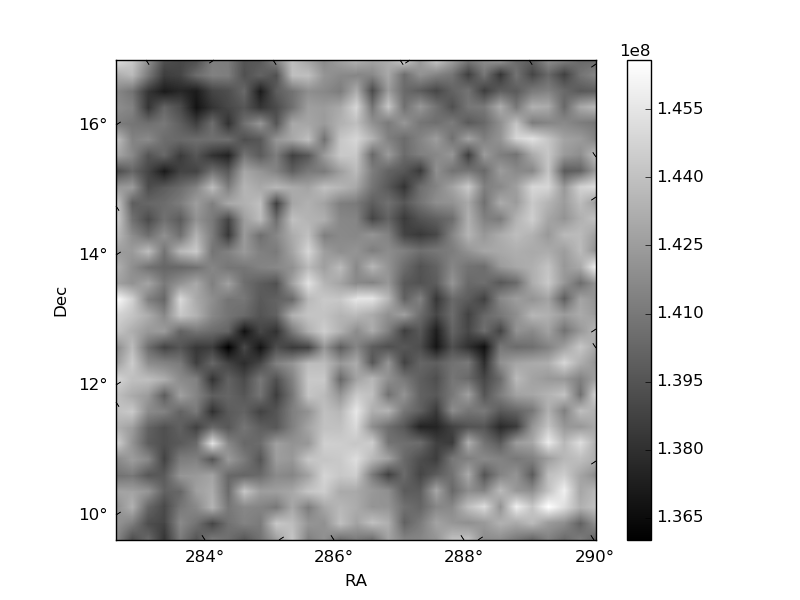
Histogram calculated using DETX and DETY for each event in the final _common_clean file
| Quadrant A | 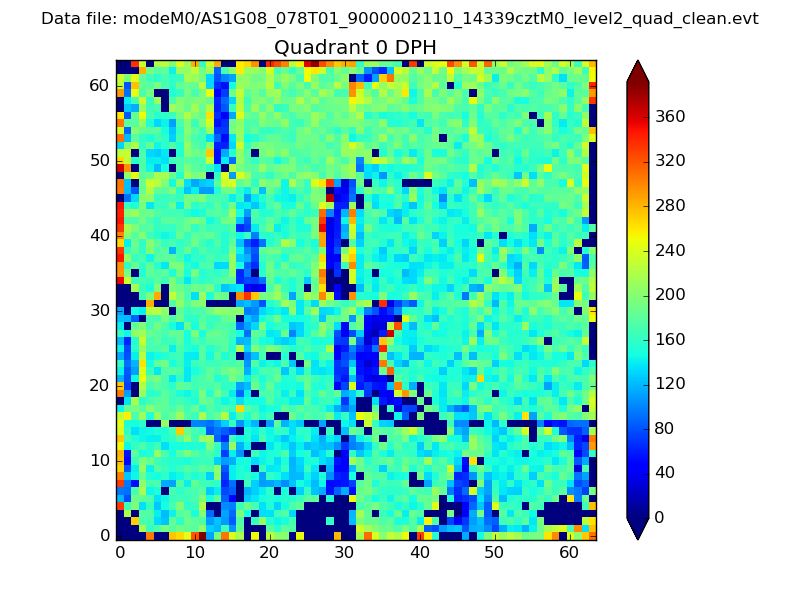 |
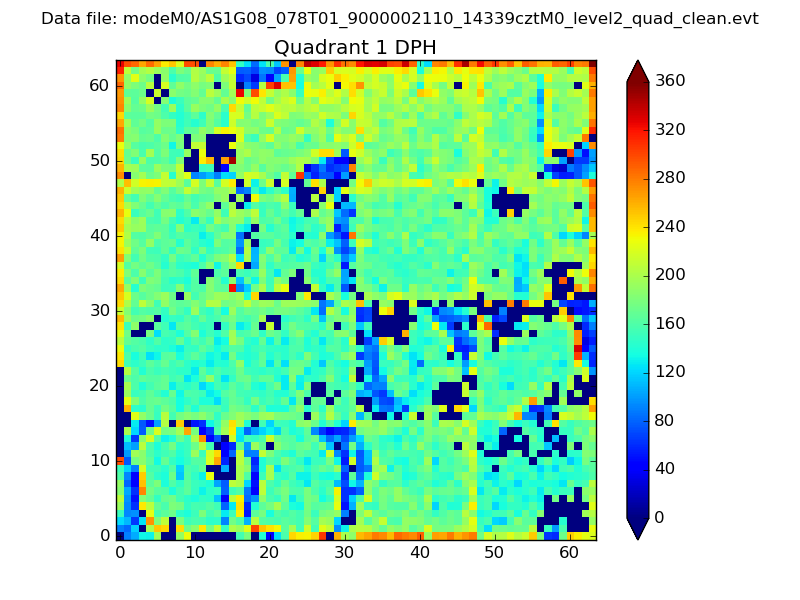 |
Quadrant B |
|---|---|---|---|
| Quadrant D |  |
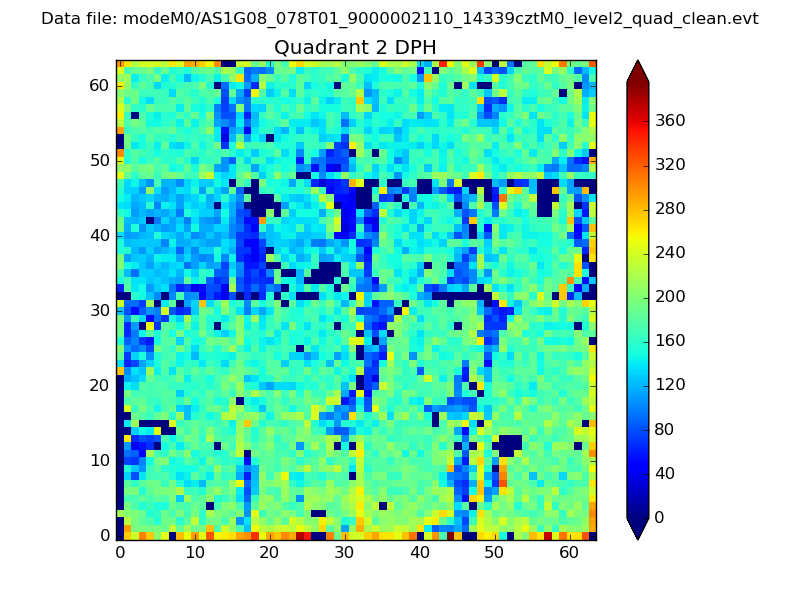 |
Quadrant C |
| Plot type | Count rate plots | Images |
|---|---|---|
| Comparison with Poisson distribution Blue bars denote a histogram of data divided into 1 sec bins. Red curve is a Poisson curve with rate = median count rate of data. |
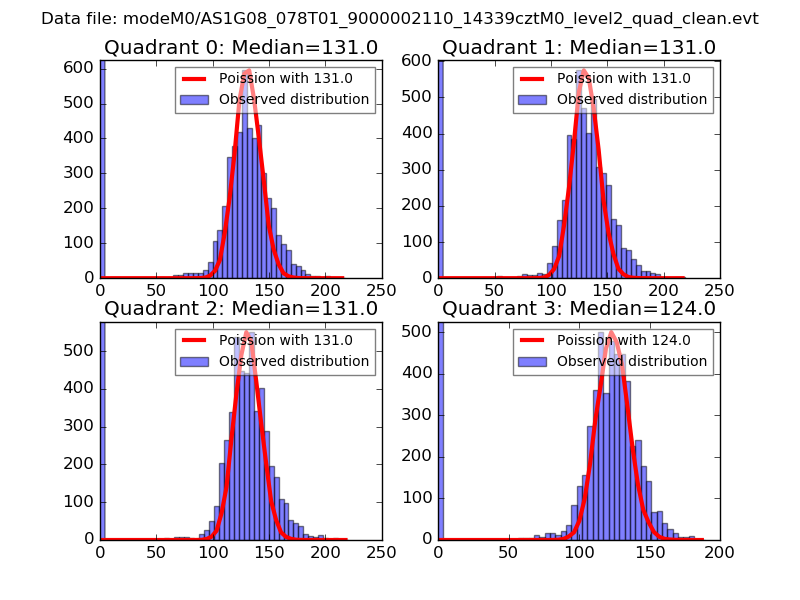 |
 |
| Quadrant-wise count rates Data is divided into 100 sec bins |
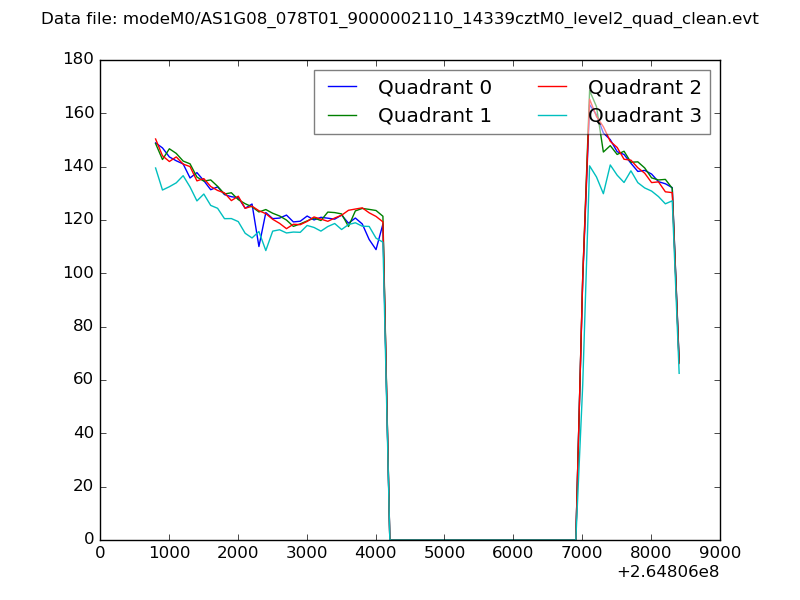 |
|
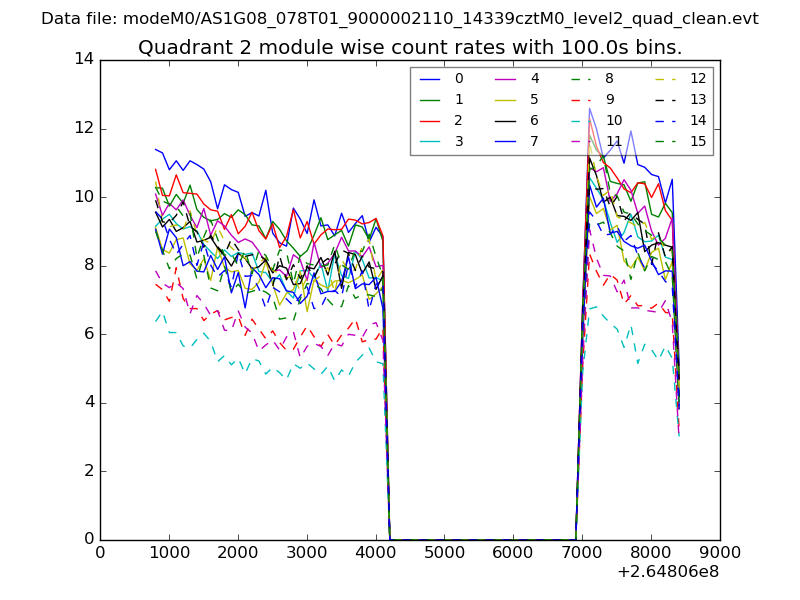
| Module-wise count rates for Quadrant A Data is divided into 100 sec bins |
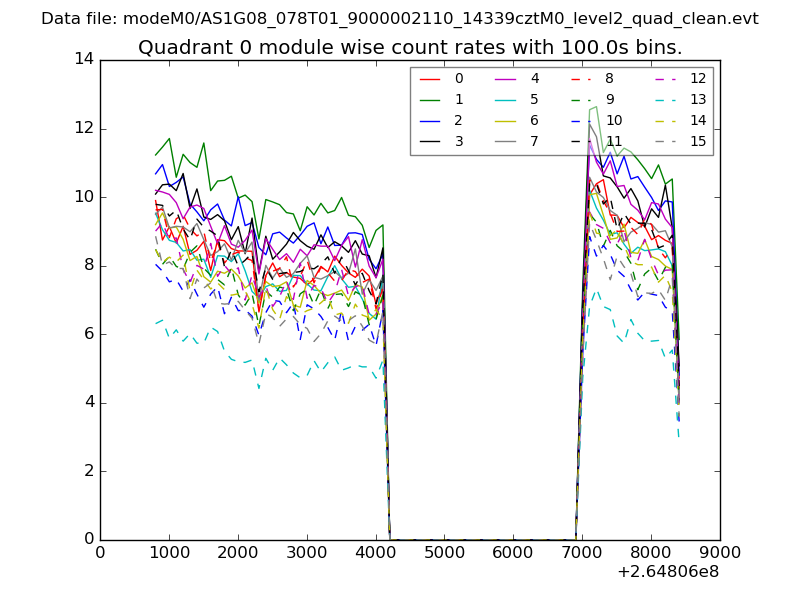 |
 |
| Module-wise count rates for Quadrant B Data is divided into 100 sec bins |
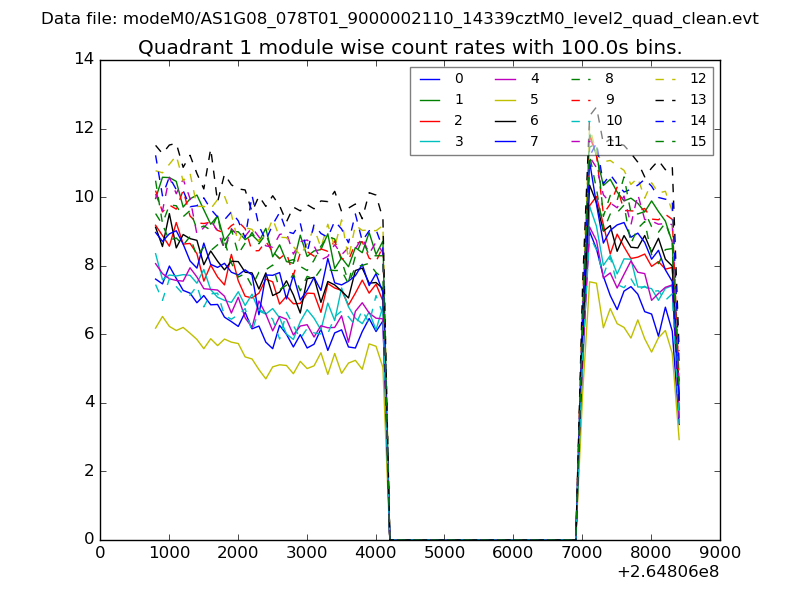 |
 |
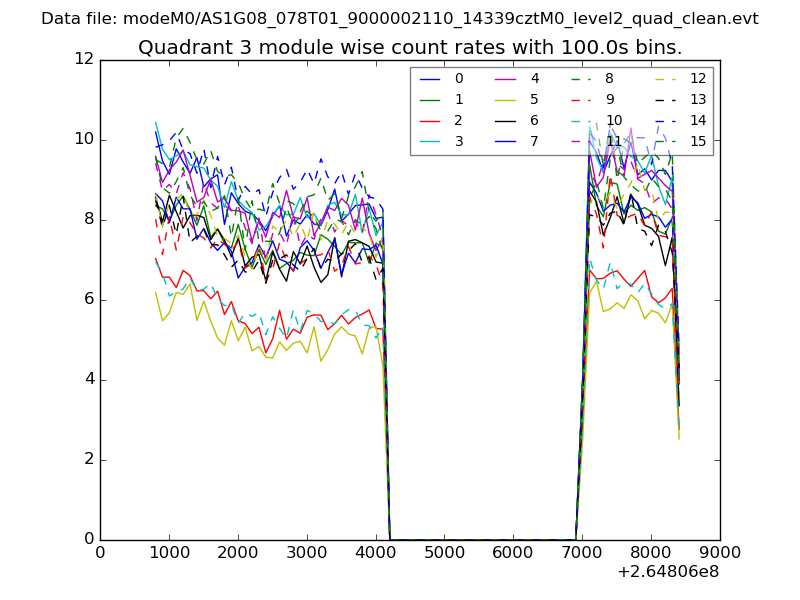
| Module-wise count rates for Quadrant C Data is divided into 100 sec bins |
 |
 |
| Module-wise count rates for Quadrant D Data is divided into 100 sec bins |
 |
 |
| Parameter | Plot |
|---|---|
| CZT HV Monitor | 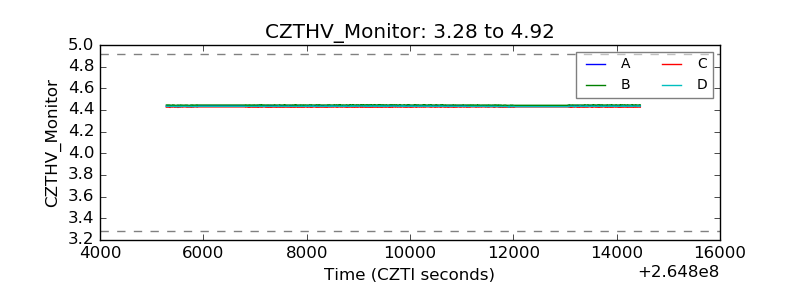 |
| D_VDD | 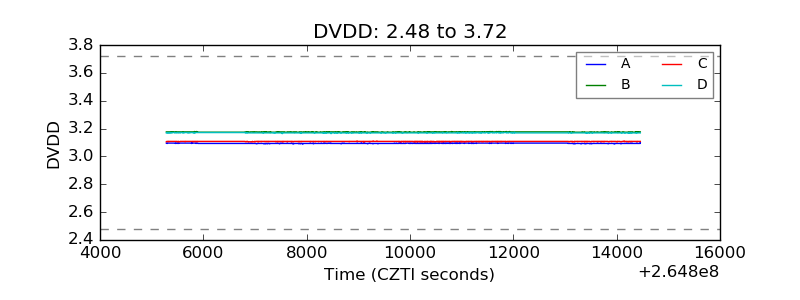 |
| Temperature 1 | 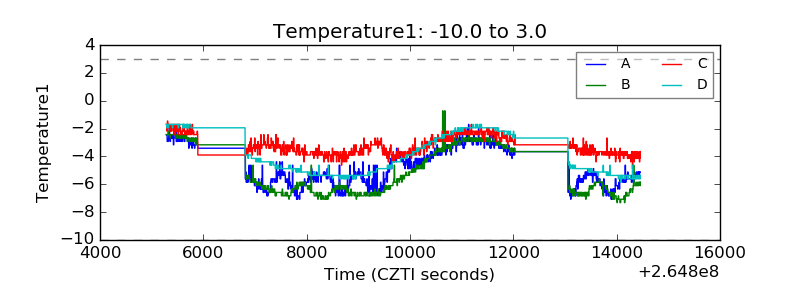 |
| Veto HV Monitor | 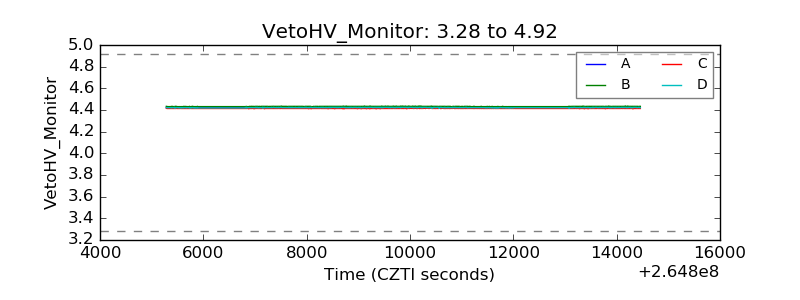 |
| Veto LLD | 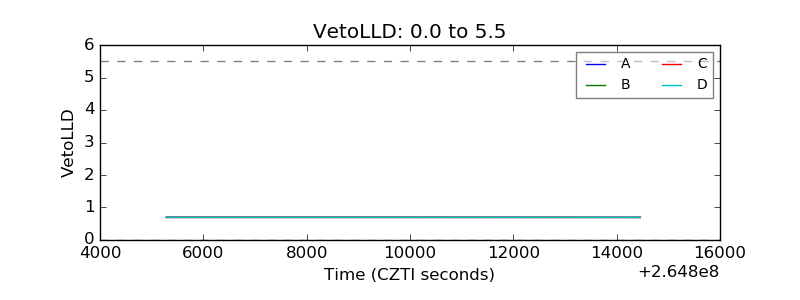 |
| Alpha Counter | 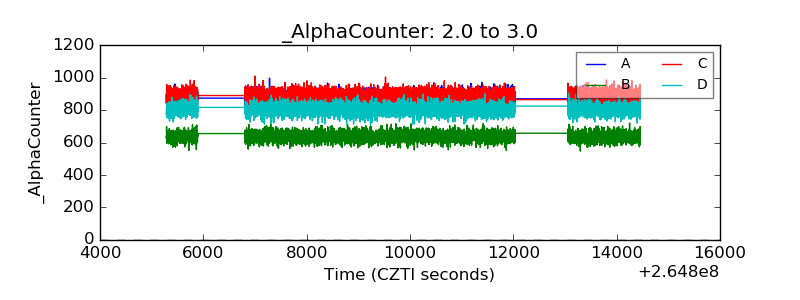 |
| _CPM_Rate | 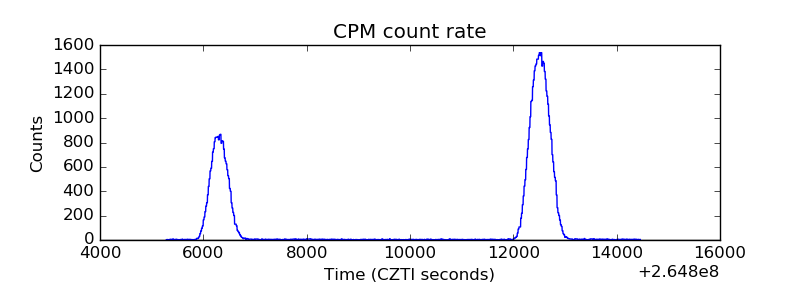 |
| CZT Counter | 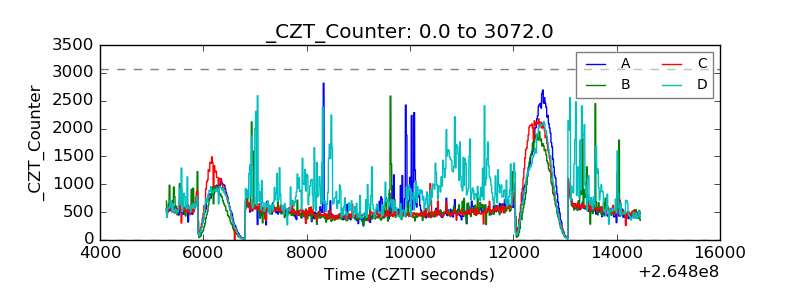 |
| +2.5 Volts monitor |  |
| +5 Volts monitor | 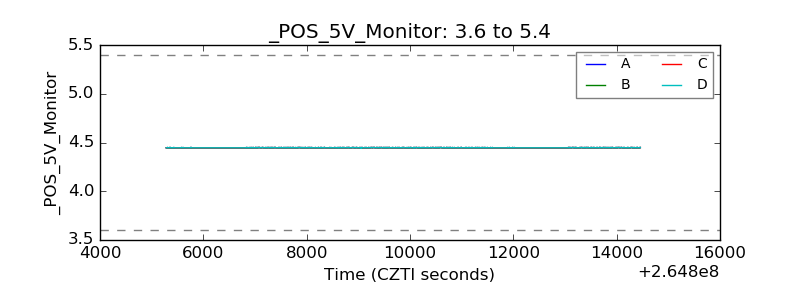 |
| _ROLL_ROT | 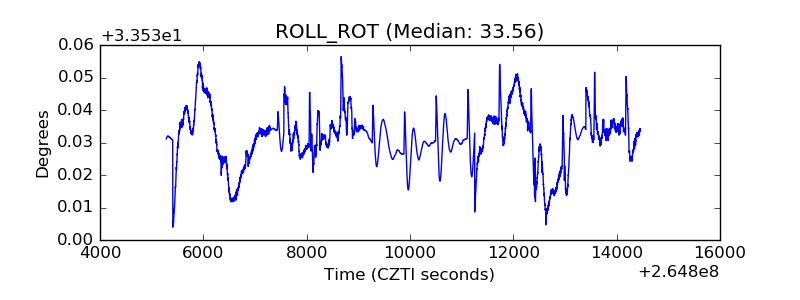 |
| _Roll_DEC | 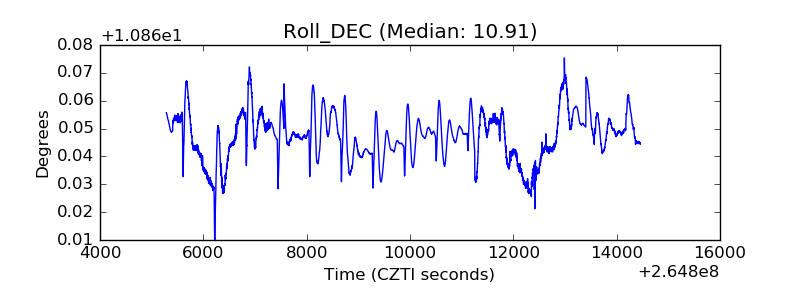 |
| _Roll_RA | 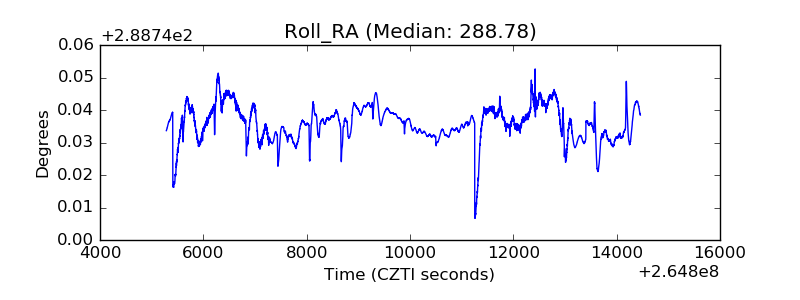 |
| Veto Counter | 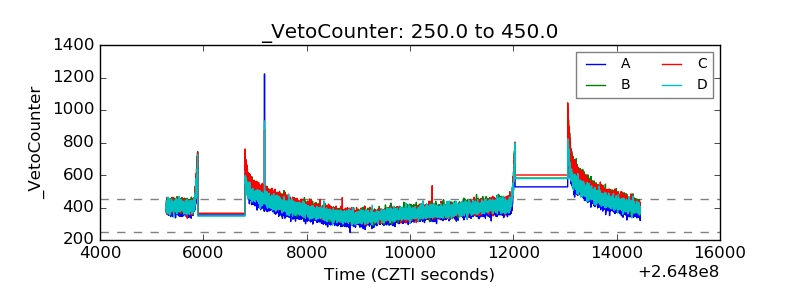 |