| Param | Original file | Final file |
|---|---|---|
| Filename | modeM0/AS1G08_078T01_9000002110_14340cztM0_level2.evt | modeM0/AS1G08_078T01_9000002110_14340cztM0_level2_quad_clean.evt |
| Size (bytes) | 512,314,560 | 91,759,680 |
| Size | 488.6 MB | 87.5 MB |
| Events in quadrant A | 3,317,787 | 594,058 |
| Events in quadrant B | 3,869,148 | 591,366 |
| Events in quadrant C | 3,300,111 | 591,511 |
| Events in quadrant D | 4,597,491 | 558,317 |
| Mode SS | |||
|---|---|---|---|
| Quadrant | BADHDUFLAG | Total packets | Discarded packets |
| A | 0 | 128 | 0 |
| B | 0 | 128 | 0 |
| C | 0 | 128 | 0 |
| D | 0 | 128 | 0 |
| Mode M0 | |||
|---|---|---|---|
| Quadrant | BADHDUFLAG | Total packets | Discarded packets |
| A | 0 | 13813 | 3 |
| B | 0 | 15578 | 2 |
| C | 0 | 13582 | 2 |
| D | 0 | 18052 | 2 |
| Mode M9 | |||
|---|---|---|---|
| Quadrant | BADHDUFLAG | Total packets | Discarded packets |
| A | 0 | 14 | 0 |
| B | 0 | 14 | 0 |
| C | 0 | 14 | 0 |
| D | 0 | 15 | 0 |
| Quadrant | Total seconds | Saturated seconds | Saturation percentage |
|---|---|---|---|
| A | 6358 | 48 | 0.754954% |
| B | 6358 | 243 | 3.821957% |
| C | 6358 | 35 | 0.550488% |
| D | 6358 | 271 | 4.262347% |
Noise dominated data is calculated using 1-second bins in cleaned event files. If a bin has >2000 counts, and if more than 50% of those come from <1% of pixels, then it is considered to be noise-dominated and hence unusable.
| Quadrant | # 1 sec bins | Bins with >0 counts | Bins with >2000 counts | High rate bins dominated by noise | Noise dominated (total time) | Noise dominated (detector-on time) | Marked lightcurve |
|---|---|---|---|---|---|---|---|
| A | 7494 | 6360 | 0 | 0 | 0.00% | 0.00% |  |
| B | 7494 | 6359 | 129 | 129 | 1.72% | 2.03% | 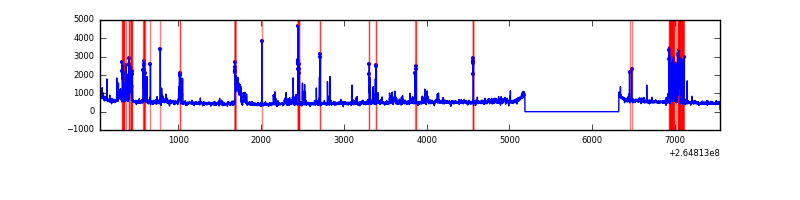 |
| C | 7494 | 6360 | 0 | 0 | 0.00% | 0.00% | 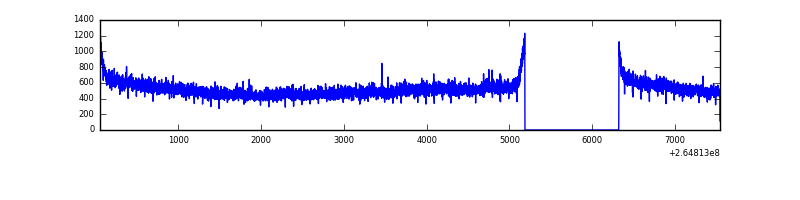 |
| D | 7494 | 6360 | 177 | 177 | 2.36% | 2.78% | 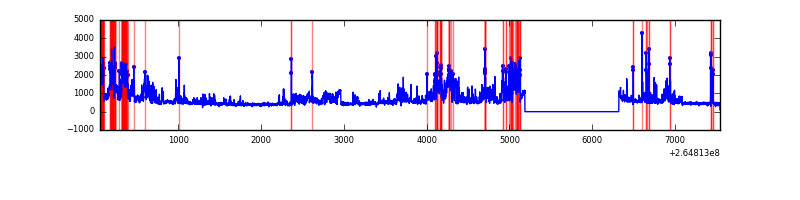 |
Top three noisy pixels from each quadrant. If the there are fewer than three noisy pixels in the level2.evt file, extra rows are filled as -1
| Pixel properties | Quadrant properties | ||||||
|---|---|---|---|---|---|---|---|
| Quadrant | DetID | PixID | Counts | Sigma | Mean | Median | Sigma |
| A | 12 | 189 | 225986 | 1416.18 | 790 | 776 | 159.0 |
| A | 8 | 15 | 40854 | 252.02 | 790 | 776 | 159.0 |
| A | 11 | 29 | 7039 | 39.38 | 790 | 776 | 159.0 |
| B | 0 | 229 | 432129 | 2917.47 | 781 | 762 | 147.9 |
| B | 10 | 16 | 271224 | 1829.22 | 781 | 762 | 147.9 |
| B | 0 | 189 | 35960 | 238.05 | 781 | 762 | 147.9 |
| C | 3 | 233 | 298252 | 1664.81 | 770 | 775 | 178.7 |
| C | 13 | 61 | 5506 | 26.48 | 770 | 775 | 178.7 |
| C | 3 | 202 | 1809 | 5.79 | 770 | 775 | 178.7 |
| D | 1 | 52 | 551246 | 3073.34 | 754 | 737 | 179.1 |
| D | 5 | 222 | 411409 | 2292.67 | 754 | 737 | 179.1 |
| D | 12 | 110 | 390797 | 2177.6 | 754 | 737 | 179.1 |
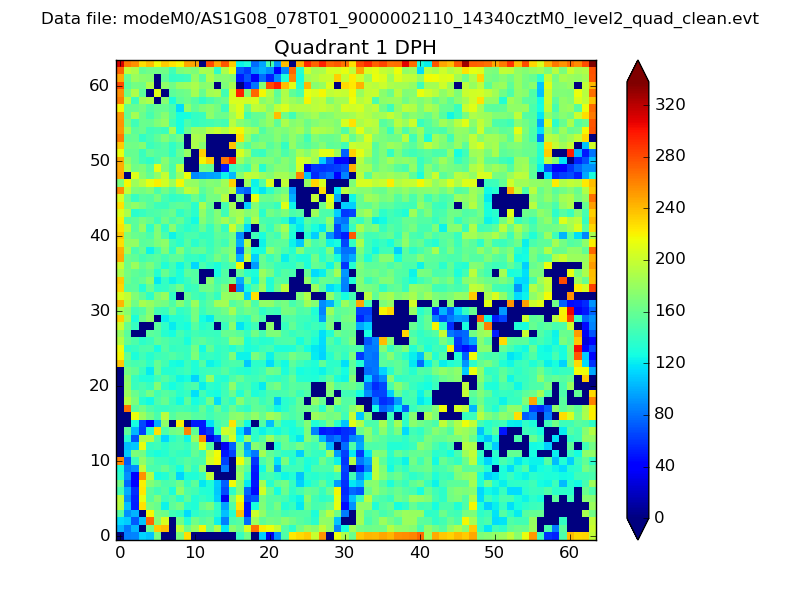
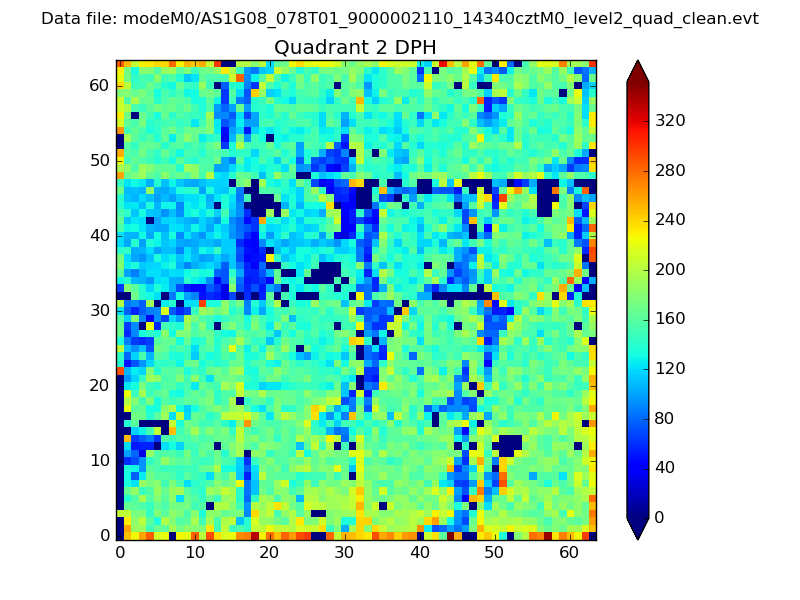
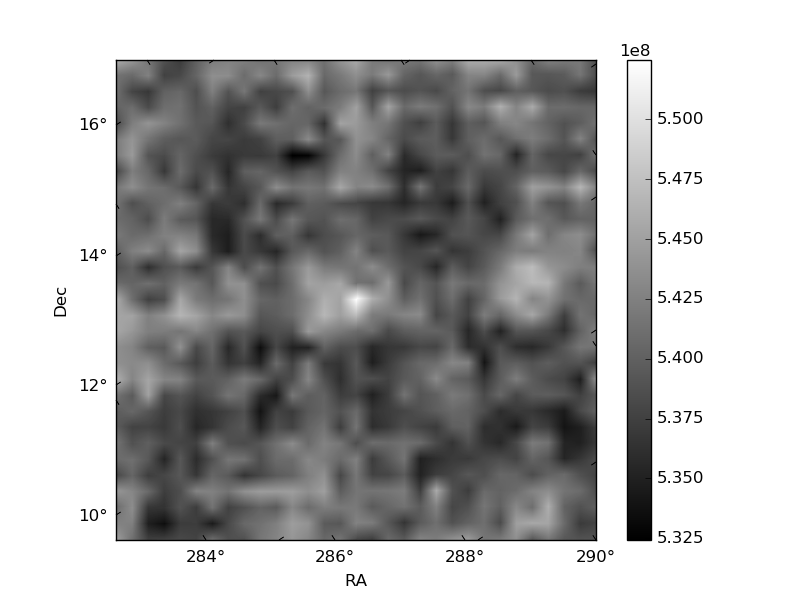
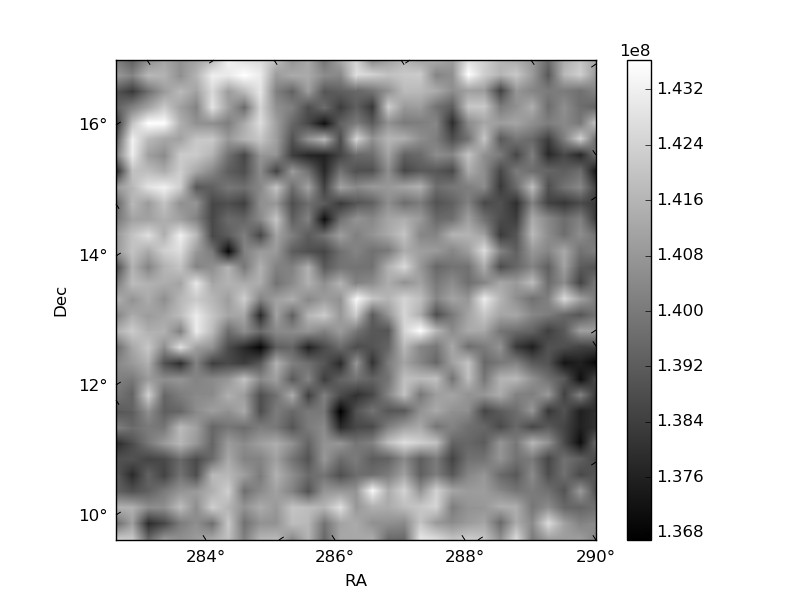
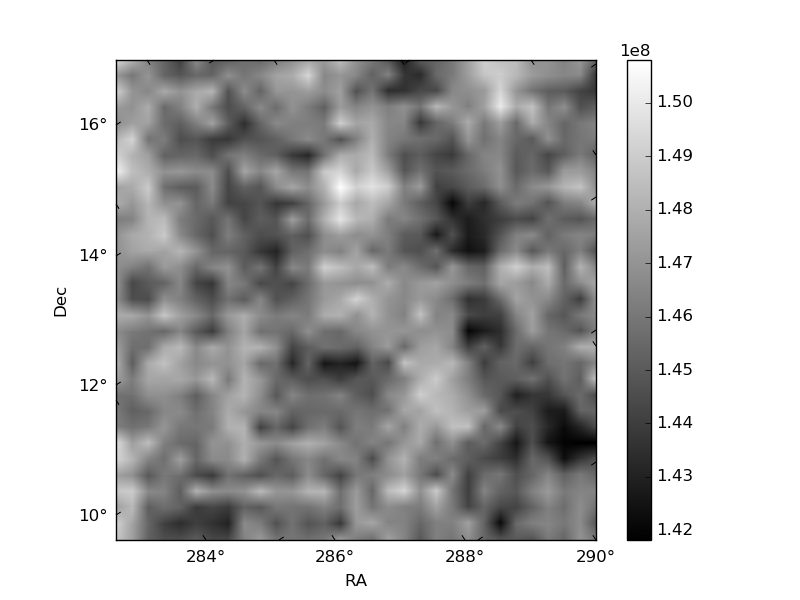
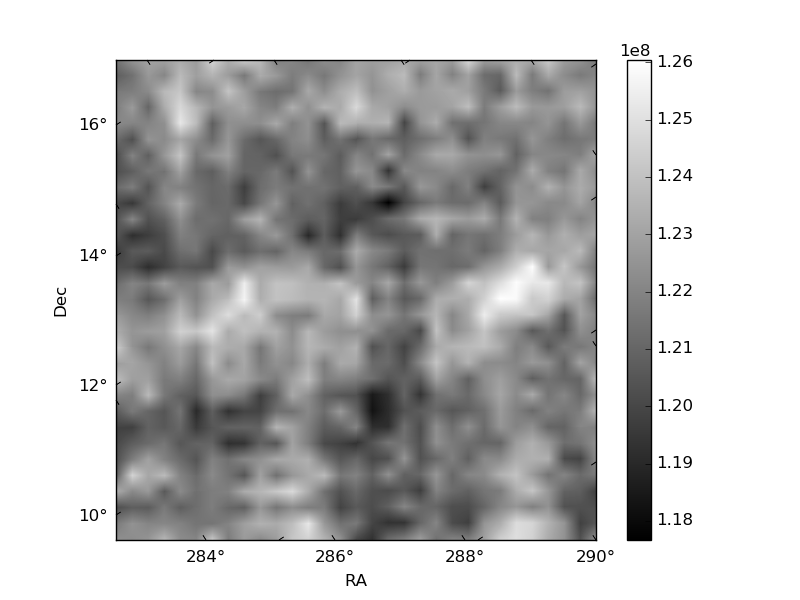
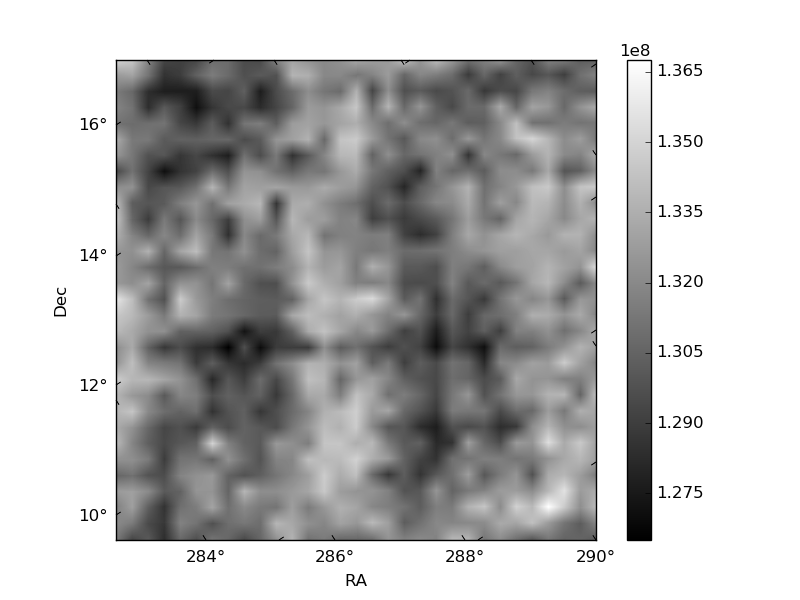
Histogram calculated using DETX and DETY for each event in the final _common_clean file
| Quadrant A | 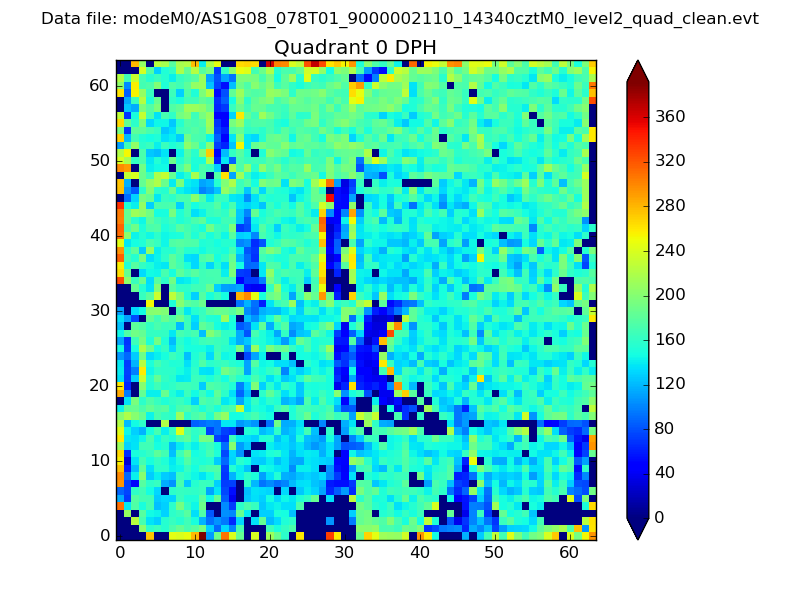 |
 |
Quadrant B |
|---|---|---|---|
| Quadrant D | 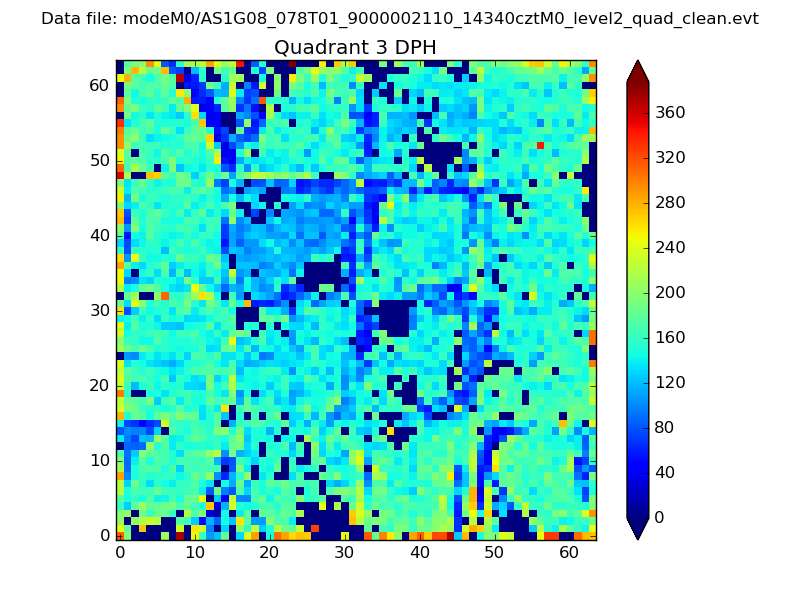 |
 |
Quadrant C |
| Plot type | Count rate plots | Images |
|---|---|---|
| Comparison with Poisson distribution Blue bars denote a histogram of data divided into 1 sec bins. Red curve is a Poisson curve with rate = median count rate of data. |
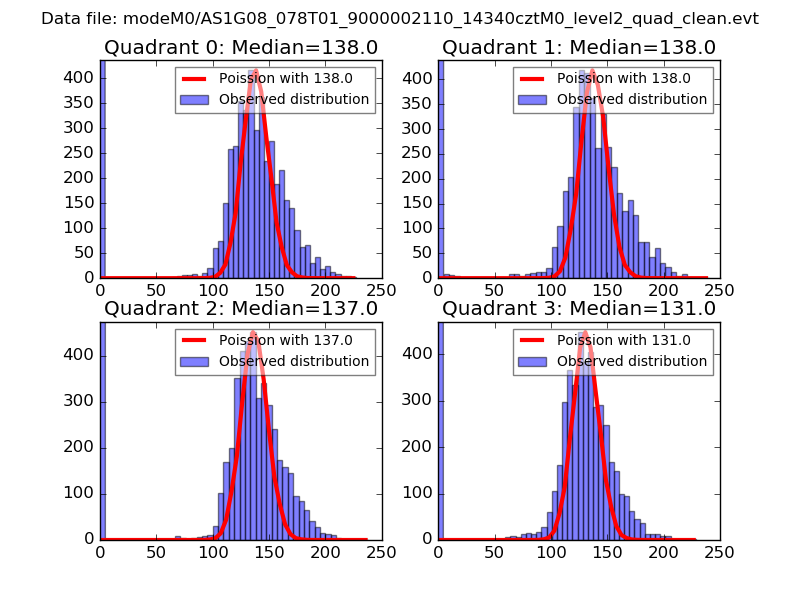 |
 |
| Quadrant-wise count rates Data is divided into 100 sec bins |
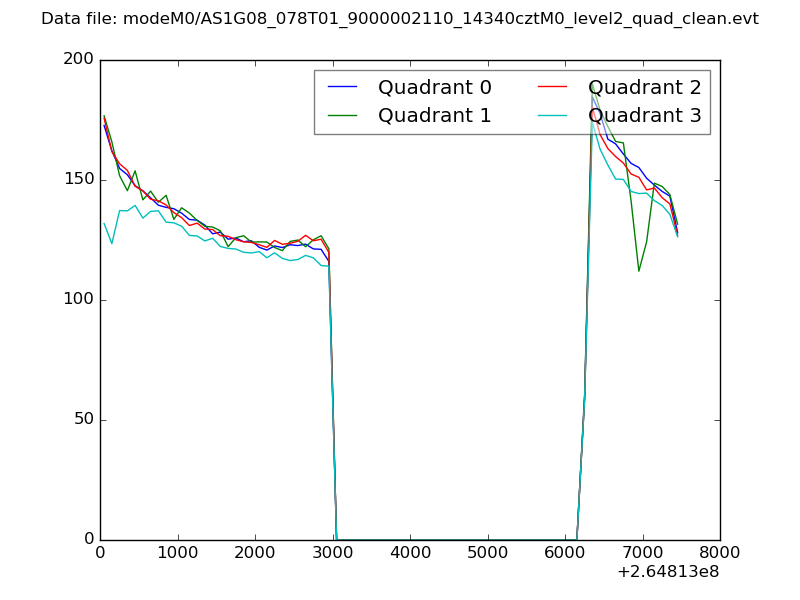 |
|
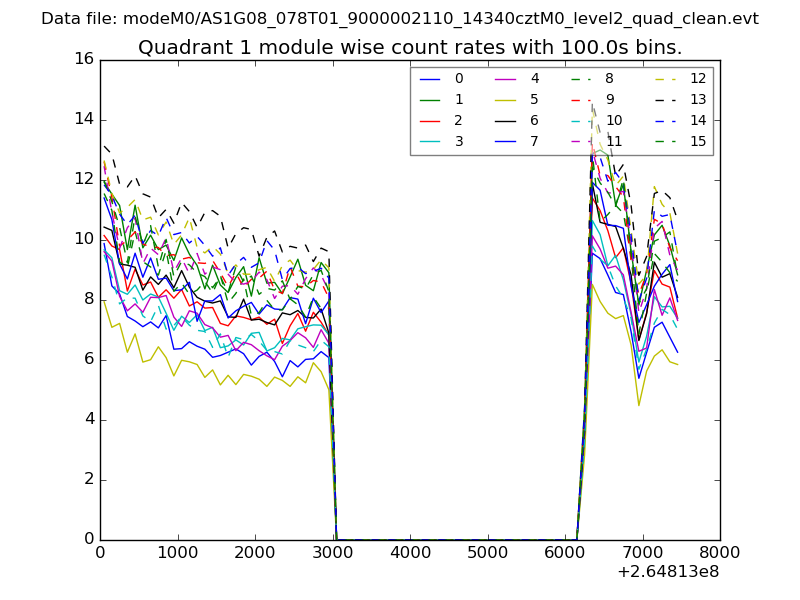
| Module-wise count rates for Quadrant A Data is divided into 100 sec bins |
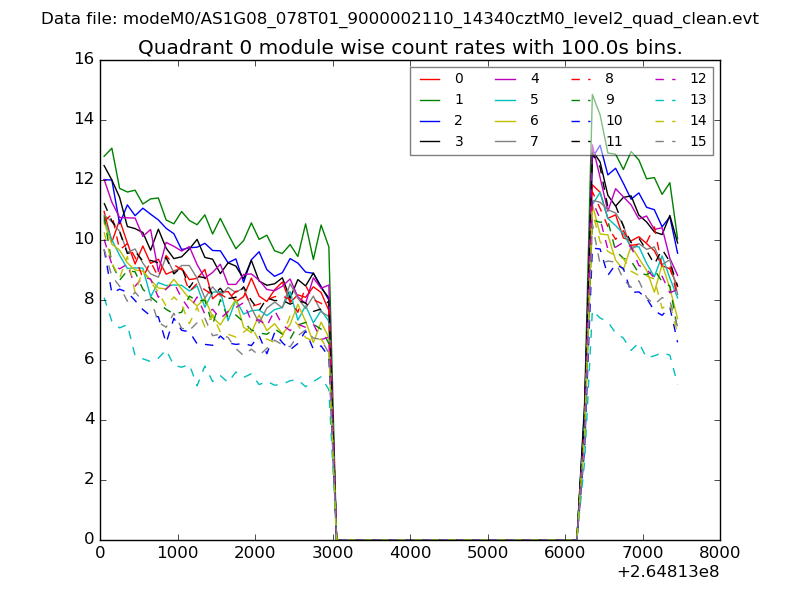 |
 |
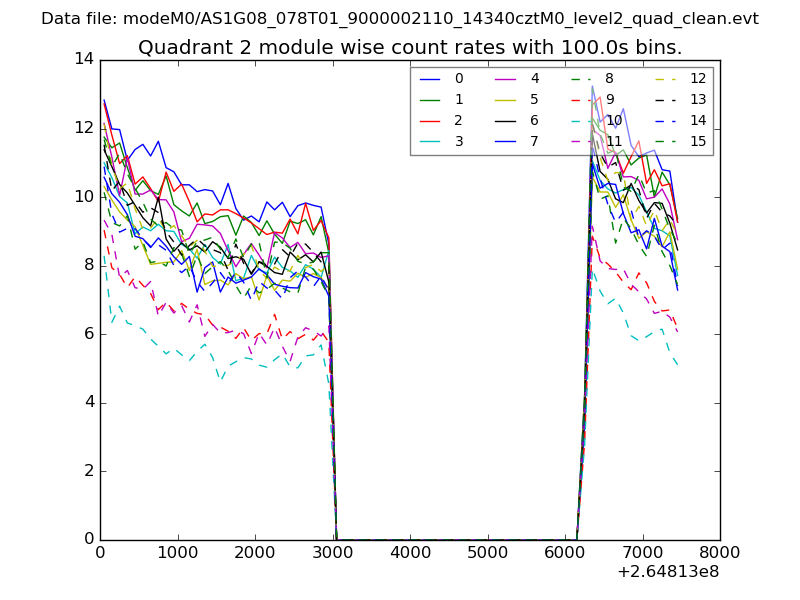
| Module-wise count rates for Quadrant B Data is divided into 100 sec bins |
 |
 |
| Module-wise count rates for Quadrant C Data is divided into 100 sec bins |
 |
 |
| Module-wise count rates for Quadrant D Data is divided into 100 sec bins |
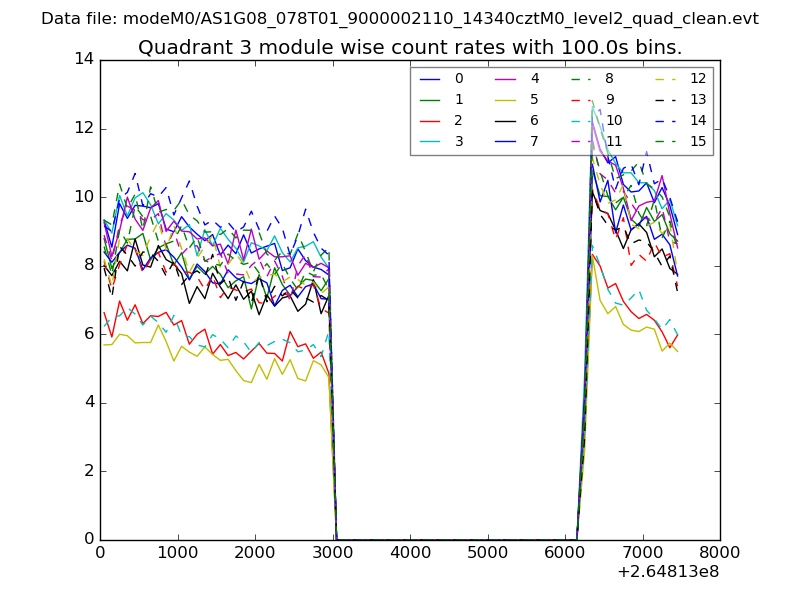 |
 |
| Parameter | Plot |
|---|---|
| CZT HV Monitor | 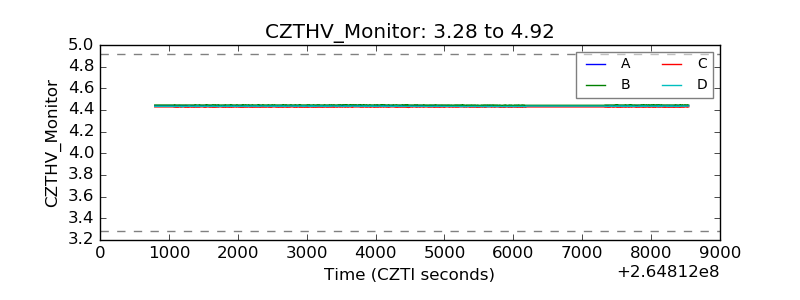 |
| D_VDD | 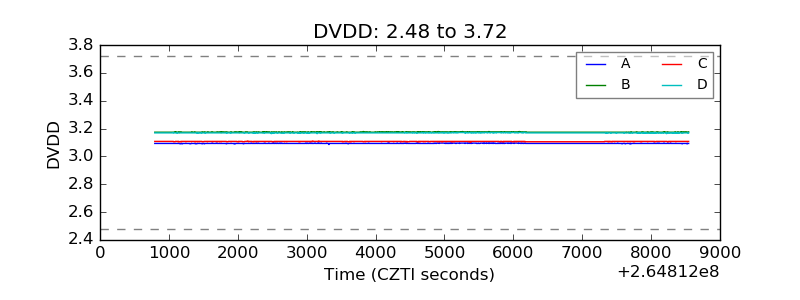 |
| Temperature 1 | 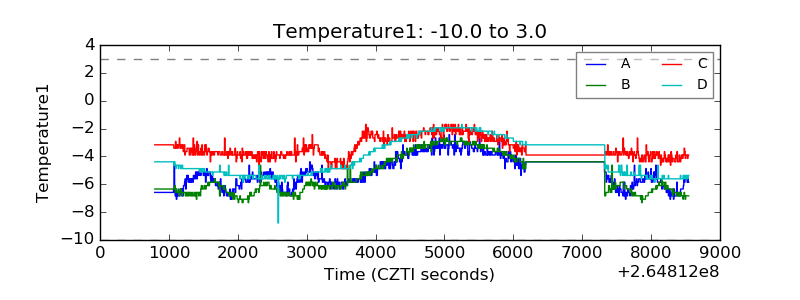 |
| Veto HV Monitor | 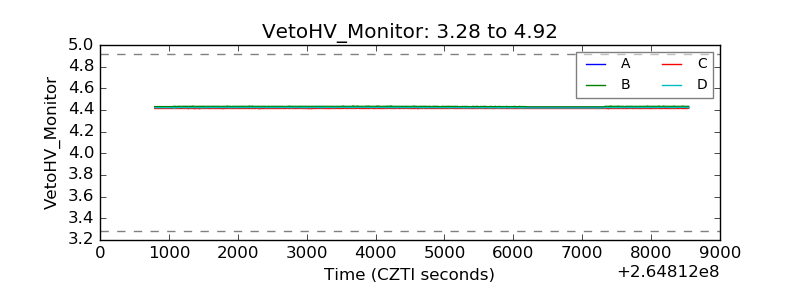 |
| Veto LLD | 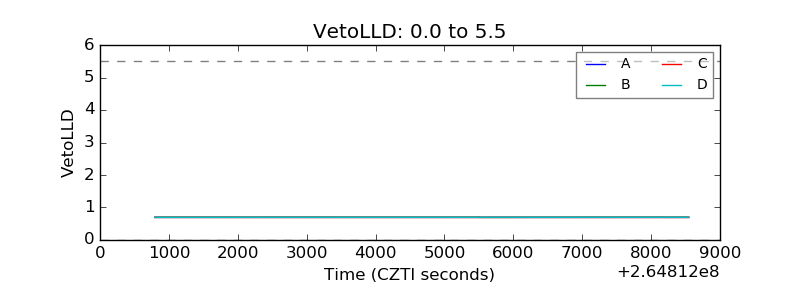 |
| Alpha Counter | 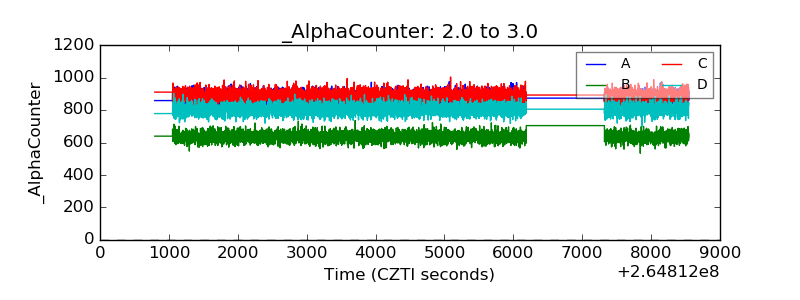 |
| _CPM_Rate | 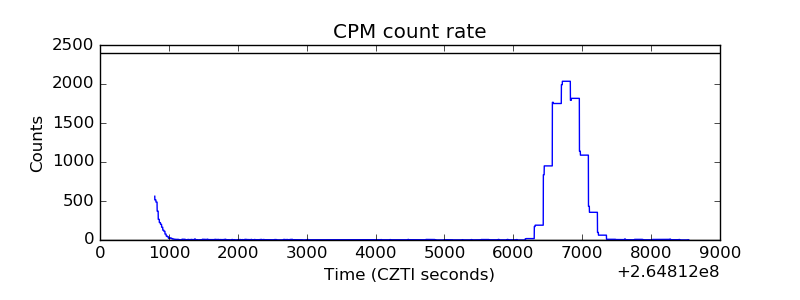 |
| CZT Counter | 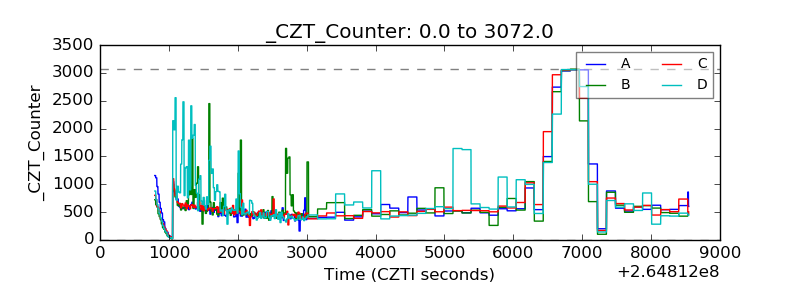 |
| +2.5 Volts monitor | 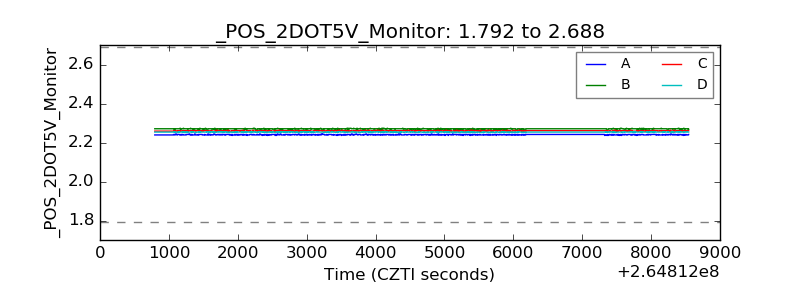 |
| +5 Volts monitor |  |
| _ROLL_ROT | 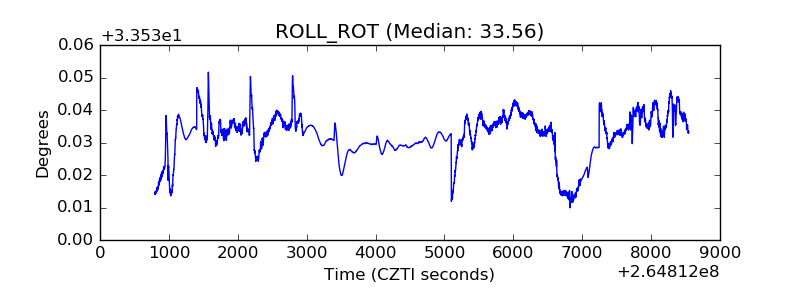 |
| _Roll_DEC |  |
| _Roll_RA | 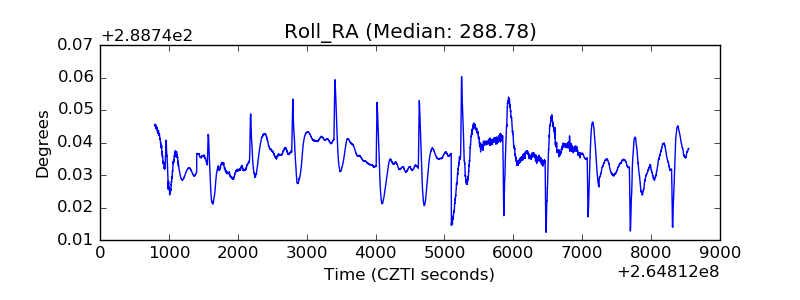 |
| Veto Counter | 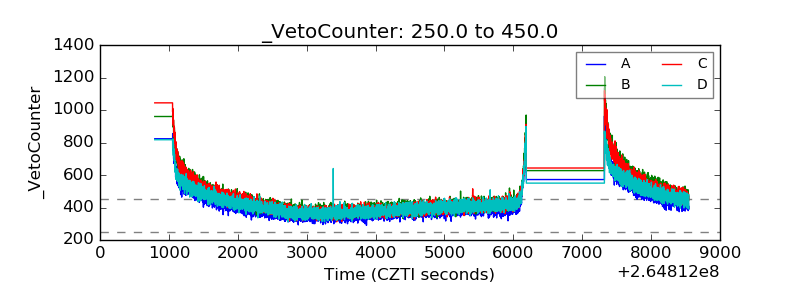 |