| Param | Original file | Final file |
|---|---|---|
| Filename | modeM0/AS1G08_078T01_9000002110_14342cztM0_level2.evt | modeM0/AS1G08_078T01_9000002110_14342cztM0_level2_quad_clean.evt |
| Size (bytes) | 180,264,960 | 54,633,600 |
| Size | 171.9 MB | 52.1 MB |
| Events in quadrant A | 1,292,326 | 384,857 |
| Events in quadrant B | 1,399,021 | 376,197 |
| Events in quadrant C | 1,295,951 | 369,943 |
| Events in quadrant D | 1,310,911 | 354,938 |
| Mode SS | |||
|---|---|---|---|
| Quadrant | BADHDUFLAG | Total packets | Discarded packets |
| A | 0 | 66 | 16 |
| B | 0 | 61 | 15 |
| C | 0 | 65 | 17 |
| D | 0 | 62 | 16 |
| Mode M0 | |||
|---|---|---|---|
| Quadrant | BADHDUFLAG | Total packets | Discarded packets |
| A | 0 | 6731 | 1521 |
| B | 0 | 7312 | 1744 |
| C | 0 | 6717 | 1456 |
| D | 0 | 7346 | 1924 |
| Mode M9 | |||
|---|---|---|---|
| Quadrant | BADHDUFLAG | Total packets | Discarded packets |
| A | 0 | 17 | 5 |
| B | 0 | 16 | 6 |
| C | 0 | 17 | 7 |
| D | 0 | 18 | 6 |
| Quadrant | Total seconds | Saturated seconds | Saturation percentage |
|---|---|---|---|
| A | 2355 | 6 | 0.254777% |
| B | 2313 | 73 | 3.156074% |
| C | 2349 | 5 | 0.212857% |
| D | 2326 | 20 | 0.859845% |
Noise dominated data is calculated using 1-second bins in cleaned event files. If a bin has >2000 counts, and if more than 50% of those come from <1% of pixels, then it is considered to be noise-dominated and hence unusable.
| Quadrant | # 1 sec bins | Bins with >0 counts | Bins with >2000 counts | High rate bins dominated by noise | Noise dominated (total time) | Noise dominated (detector-on time) | Marked lightcurve |
|---|---|---|---|---|---|---|---|
| A | 7803 | 2452 | 0 | 0 | 0.00% | 0.00% | 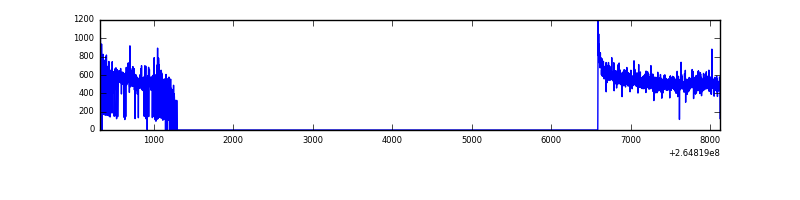 |
| B | 7803 | 2420 | 41 | 41 | 0.53% | 1.69% | 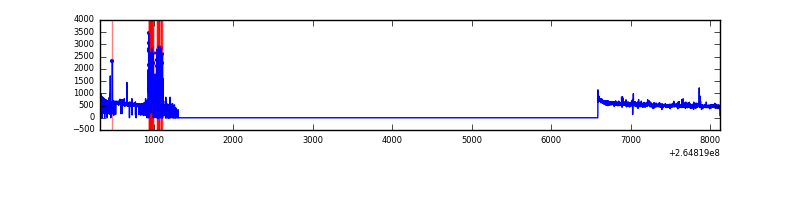 |
| C | 7803 | 2461 | 0 | 0 | 0.00% | 0.00% | 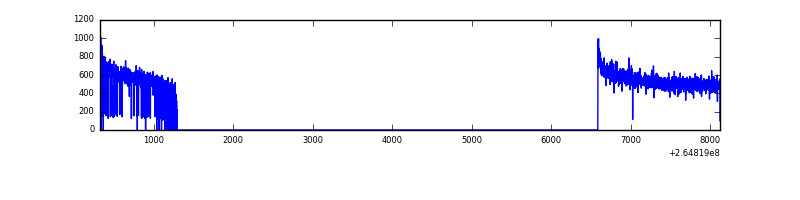 |
| D | 7803 | 2453 | 10 | 10 | 0.13% | 0.41% | 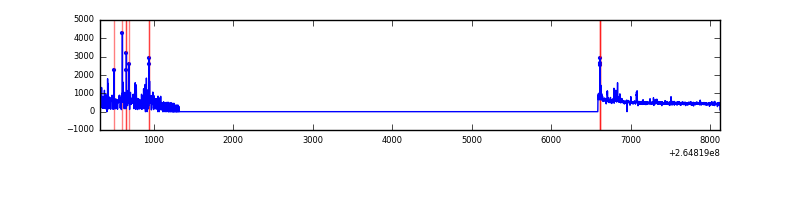 |
Top three noisy pixels from each quadrant. If the there are fewer than three noisy pixels in the level2.evt file, extra rows are filled as -1
| Pixel properties | Quadrant properties | ||||||
|---|---|---|---|---|---|---|---|
| Quadrant | DetID | PixID | Counts | Sigma | Mean | Median | Sigma |
| A | 12 | 189 | 53826 | 824.62 | 319 | 314 | 64.9 |
| A | 8 | 15 | 10210 | 152.5 | 319 | 314 | 64.9 |
| A | 0 | 226 | 2760 | 37.69 | 319 | 314 | 64.9 |
| B | 10 | 16 | 154891 | 2626.46 | 310 | 303 | 58.9 |
| B | 0 | 229 | 26370 | 442.88 | 310 | 303 | 58.9 |
| B | 12 | 111 | 6429 | 104.08 | 310 | 303 | 58.9 |
| C | 3 | 233 | 93223 | 1305.35 | 308 | 311 | 71.2 |
| C | 13 | 61 | 2255 | 27.31 | 308 | 311 | 71.2 |
| C | 7 | 159 | 725 | 5.82 | 308 | 311 | 71.2 |
| D | 5 | 222 | 49910 | 691.25 | 301 | 295 | 71.8 |
| D | 2 | 120 | 49876 | 690.78 | 301 | 295 | 71.8 |
| D | 12 | 110 | 23962 | 329.74 | 301 | 295 | 71.8 |
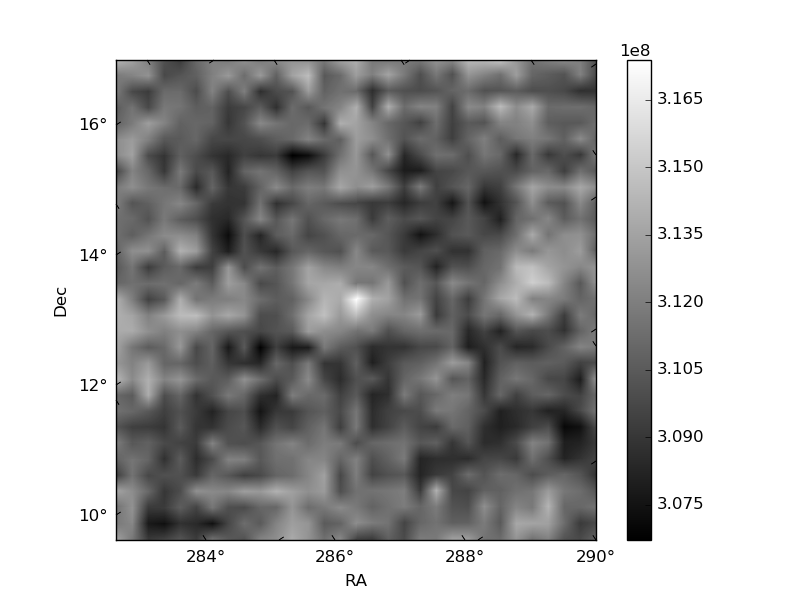
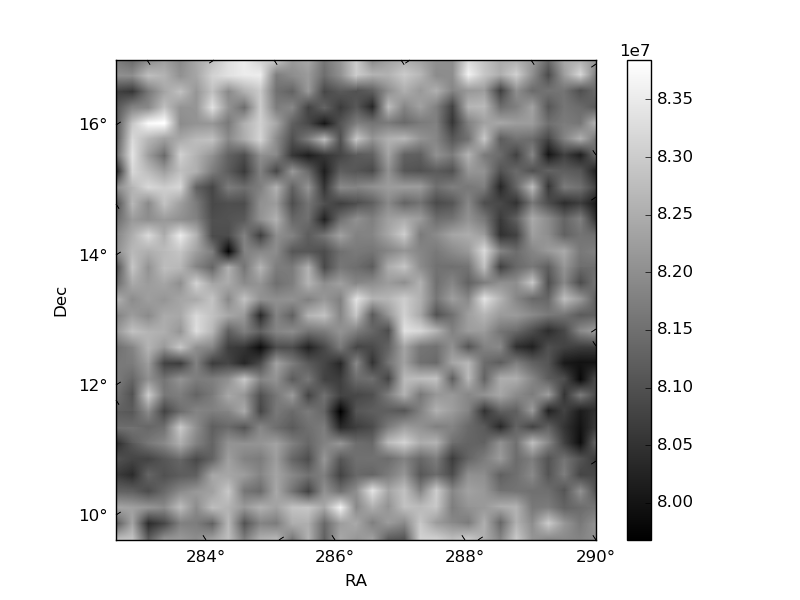
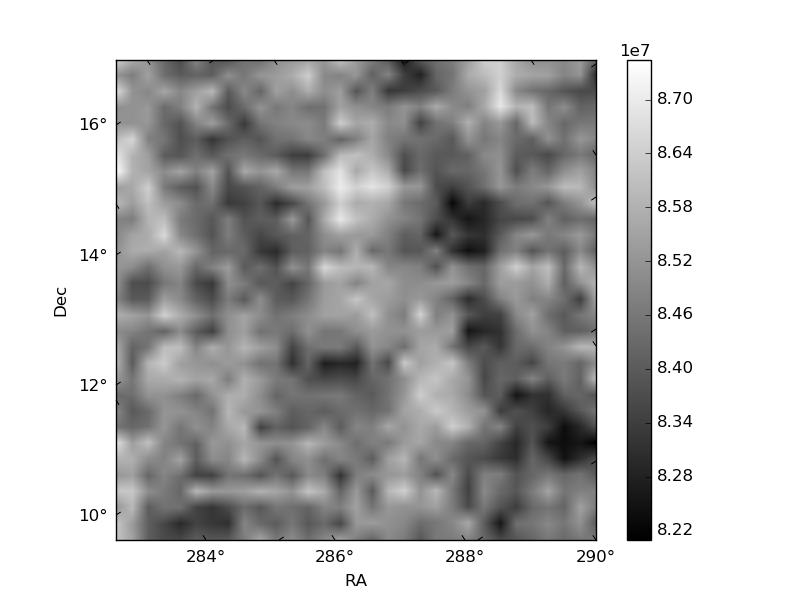
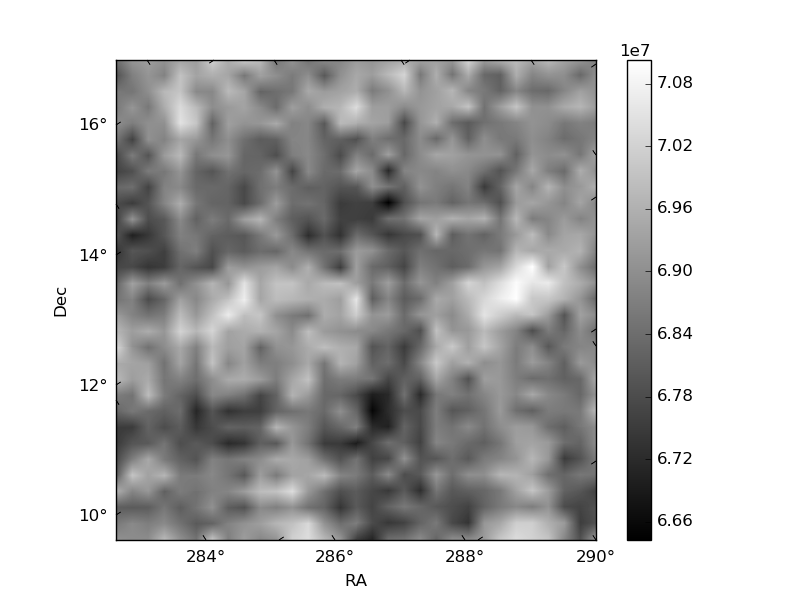
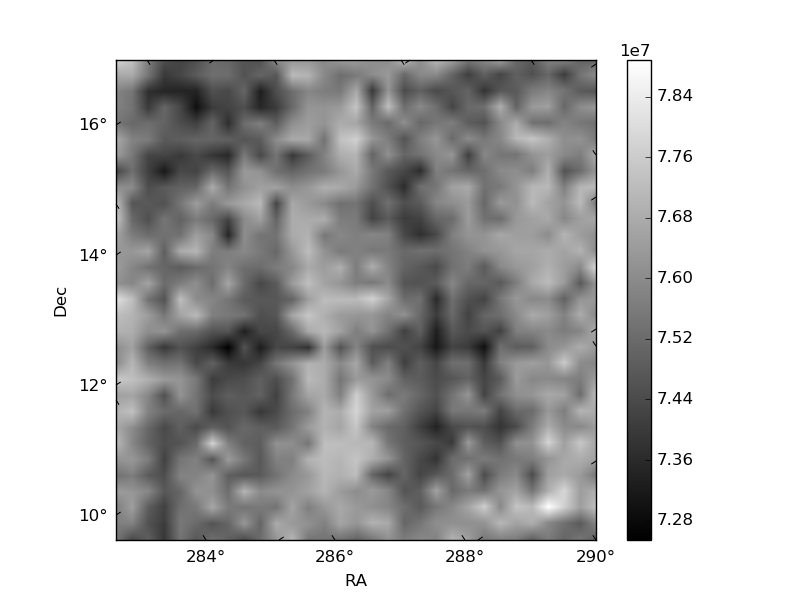
Histogram calculated using DETX and DETY for each event in the final _common_clean file
| Quadrant A | 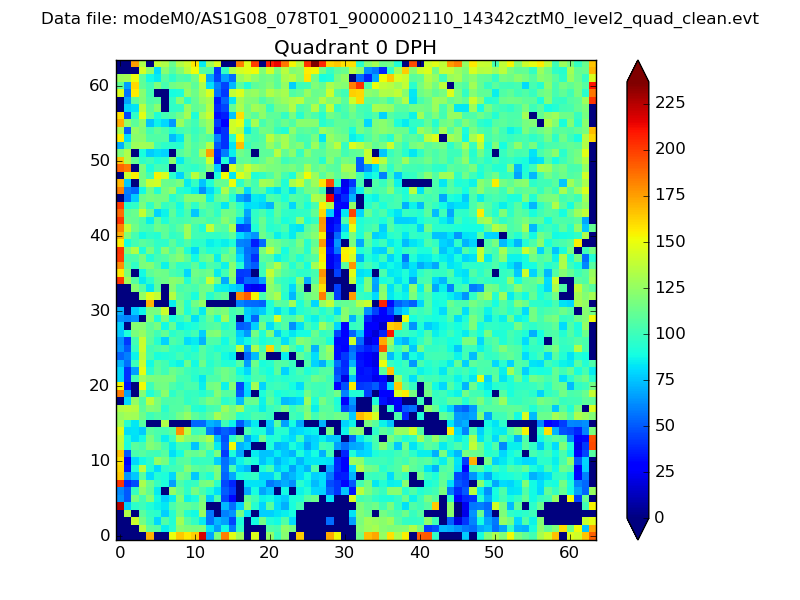 |
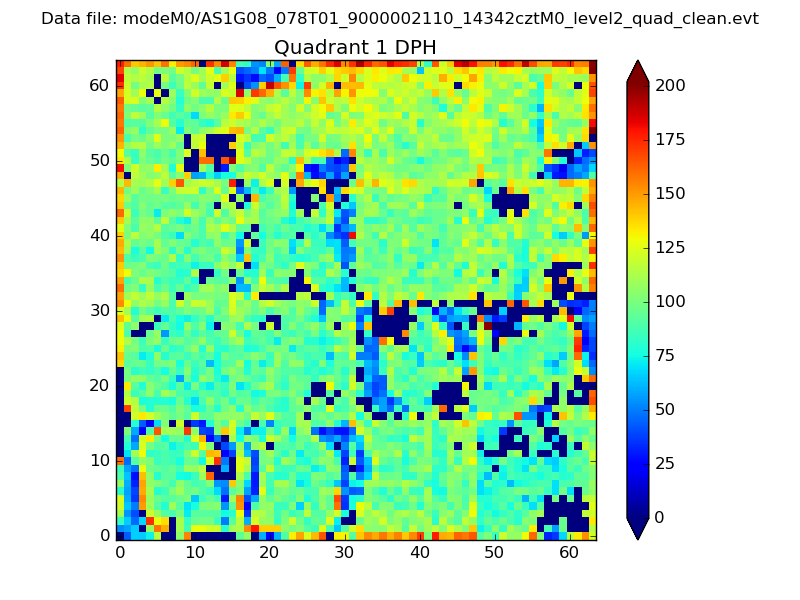 |
Quadrant B |
|---|---|---|---|
| Quadrant D | 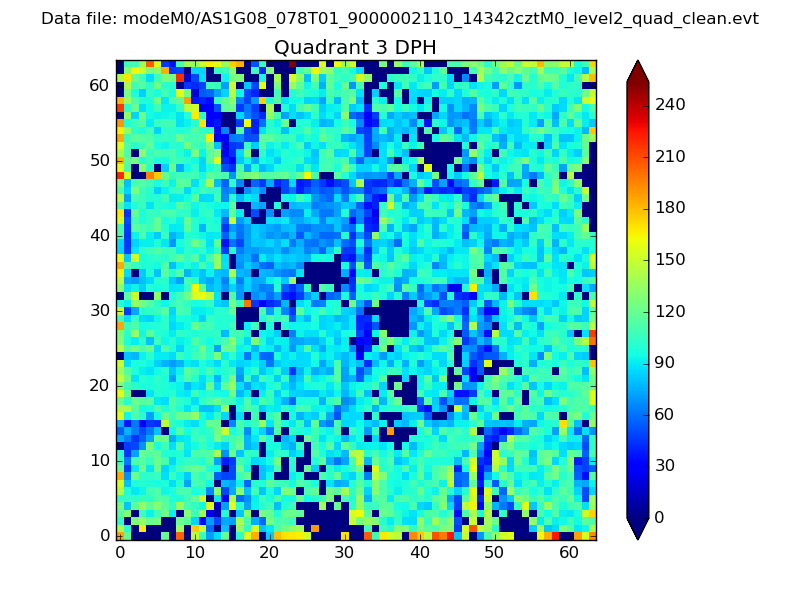 |
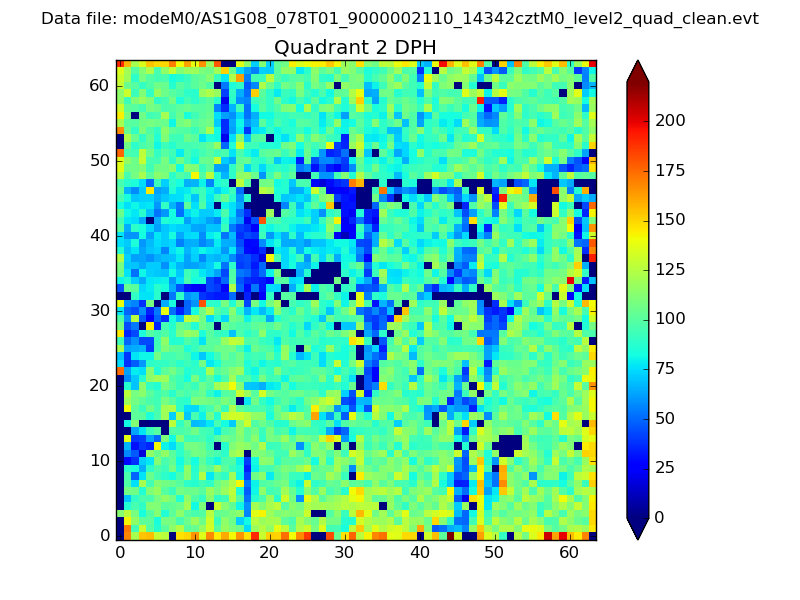 |
Quadrant C |
| Plot type | Count rate plots | Images |
|---|---|---|
| Comparison with Poisson distribution Blue bars denote a histogram of data divided into 1 sec bins. Red curve is a Poisson curve with rate = median count rate of data. |
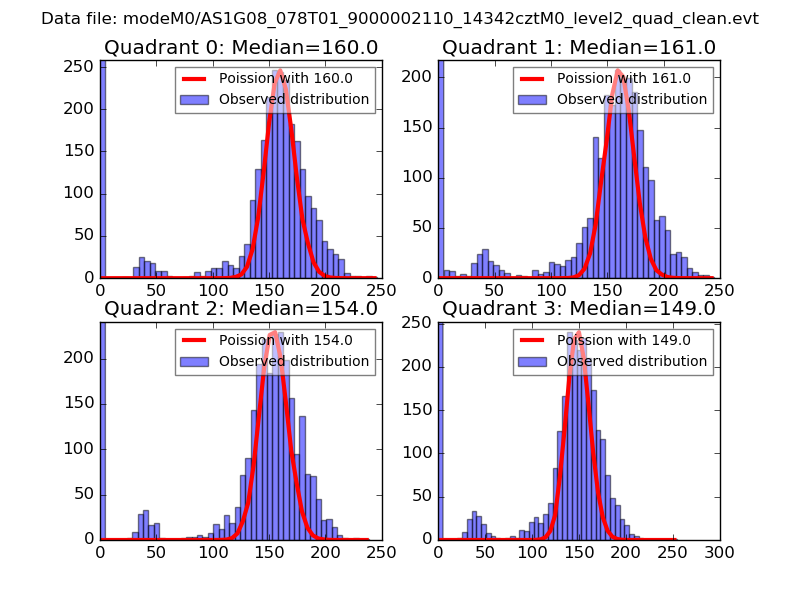 |
 |
| Quadrant-wise count rates Data is divided into 100 sec bins |
 |
|
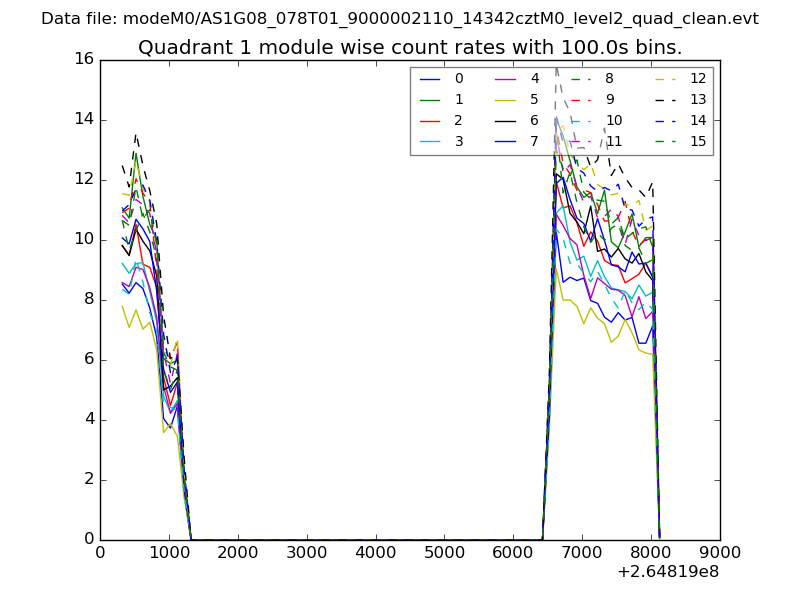
| Module-wise count rates for Quadrant A Data is divided into 100 sec bins |
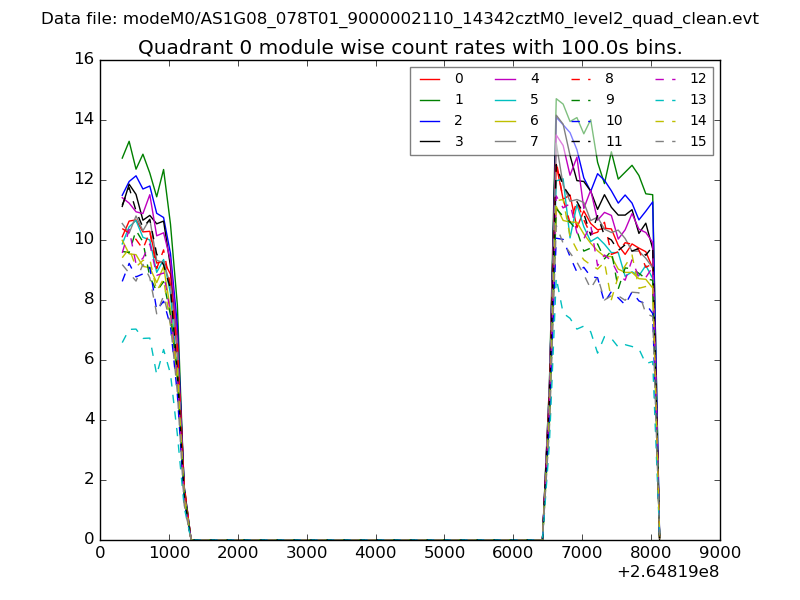 |
 |
| Module-wise count rates for Quadrant B Data is divided into 100 sec bins |
 |
 |
| Module-wise count rates for Quadrant C Data is divided into 100 sec bins |
 |
 |
| Module-wise count rates for Quadrant D Data is divided into 100 sec bins |
 |
 |
| Parameter | Plot |
|---|---|
| CZT HV Monitor | 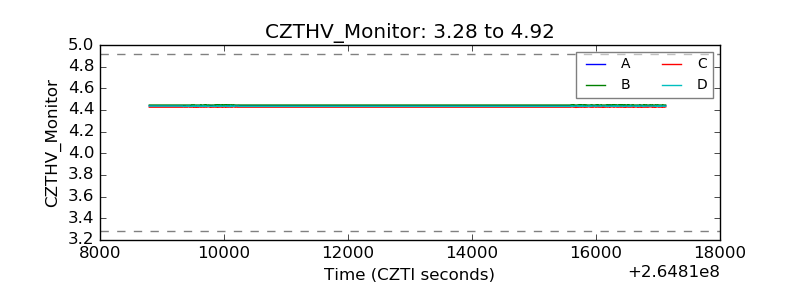 |
| D_VDD | 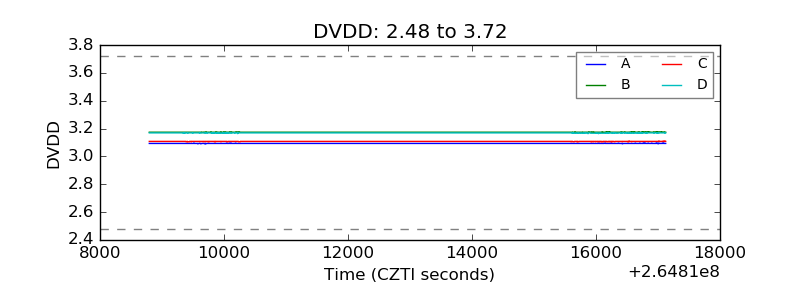 |
| Temperature 1 |  |
| Veto HV Monitor | 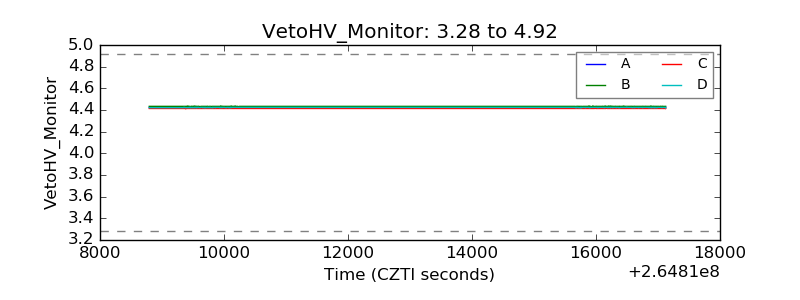 |
| Veto LLD |  |
| Alpha Counter | 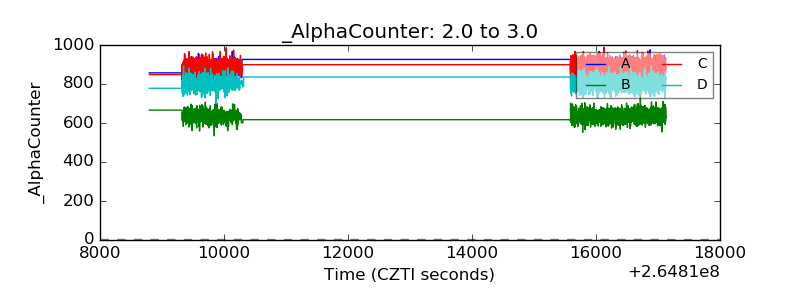 |
| _CPM_Rate | 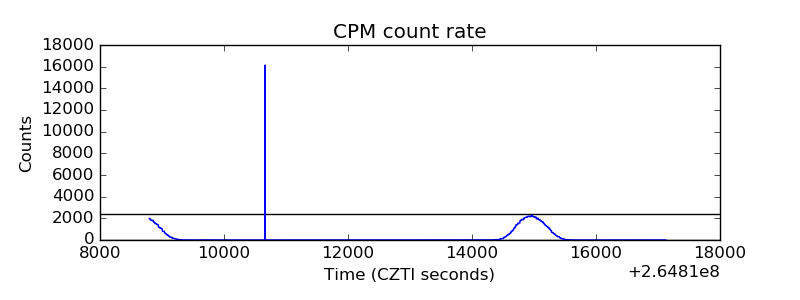 |
| CZT Counter | 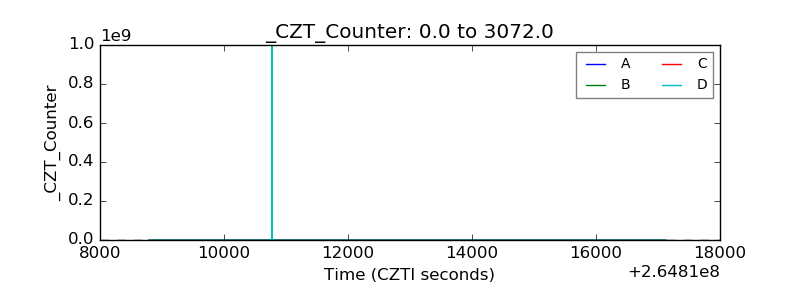 |
| +2.5 Volts monitor |  |
| +5 Volts monitor |  |
| _ROLL_ROT | 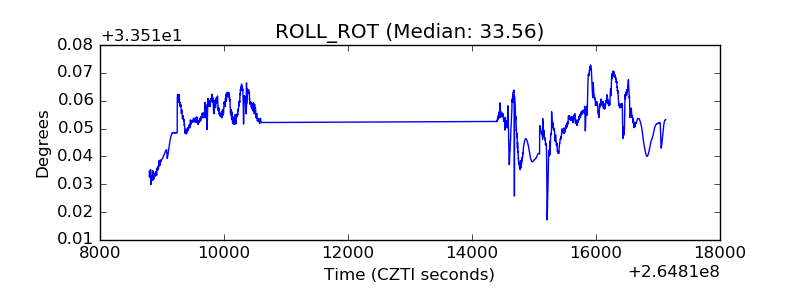 |
| _Roll_DEC | 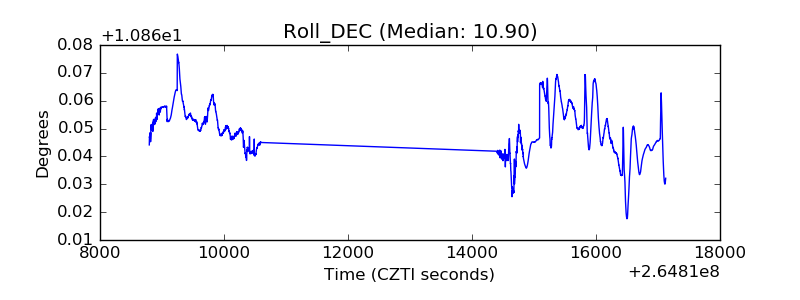 |
| _Roll_RA | 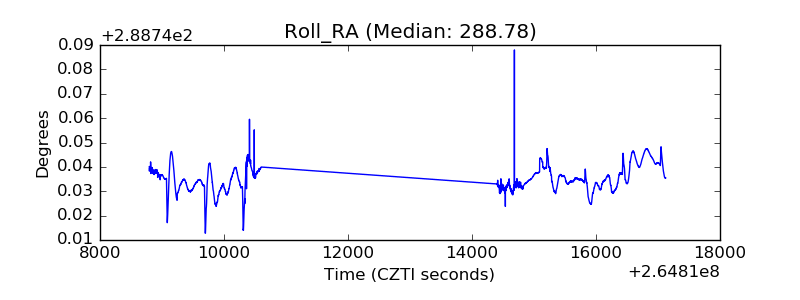 |
| Veto Counter | 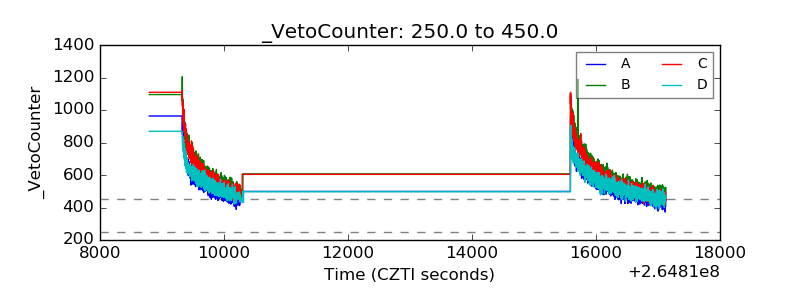 |