| Param | Original file | Final file |
|---|---|---|
| Filename | modeM0/AS1G08_078T01_9000002110_14343cztM0_level2.evt | modeM0/AS1G08_078T01_9000002110_14343cztM0_level2_quad_clean.evt |
| Size (bytes) | 367,957,440 | 87,243,840 |
| Size | 350.9 MB | 83.2 MB |
| Events in quadrant A | 2,695,921 | 583,851 |
| Events in quadrant B | 2,780,364 | 590,793 |
| Events in quadrant C | 2,618,327 | 562,601 |
| Events in quadrant D | 2,701,901 | 547,494 |
| Mode SS | |||
|---|---|---|---|
| Quadrant | BADHDUFLAG | Total packets | Discarded packets |
| A | 0 | 106 | 4 |
| B | 0 | 106 | 6 |
| C | 0 | 106 | 4 |
| D | 0 | 106 | 4 |
| Mode M0 | |||
|---|---|---|---|
| Quadrant | BADHDUFLAG | Total packets | Discarded packets |
| A | 0 | 11413 | 382 |
| B | 0 | 11719 | 359 |
| C | 0 | 11057 | 368 |
| D | 0 | 11792 | 428 |
| Mode M9 | |||
|---|---|---|---|
| Quadrant | BADHDUFLAG | Total packets | Discarded packets |
| A | 0 | 16 | 1 |
| B | 0 | 15 | 0 |
| C | 0 | 15 | 0 |
| D | 0 | 17 | 1 |
| Quadrant | Total seconds | Saturated seconds | Saturation percentage |
|---|---|---|---|
| A | 5098 | 8 | 0.156924% |
| B | 5107 | 42 | 0.822401% |
| C | 5104 | 6 | 0.117555% |
| D | 5101 | 65 | 1.274260% |
Noise dominated data is calculated using 1-second bins in cleaned event files. If a bin has >2000 counts, and if more than 50% of those come from <1% of pixels, then it is considered to be noise-dominated and hence unusable.
| Quadrant | # 1 sec bins | Bins with >0 counts | Bins with >2000 counts | High rate bins dominated by noise | Noise dominated (total time) | Noise dominated (detector-on time) | Marked lightcurve |
|---|---|---|---|---|---|---|---|
| A | 7794 | 5128 | 0 | 0 | 0.00% | 0.00% | 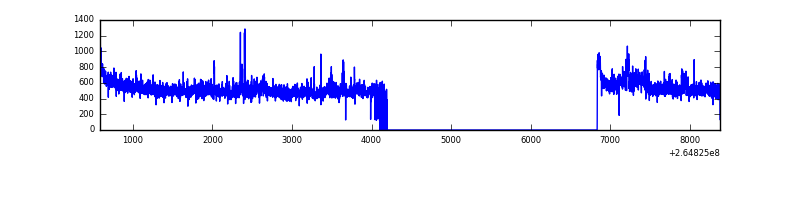 |
| B | 7794 | 5128 | 23 | 23 | 0.30% | 0.45% | 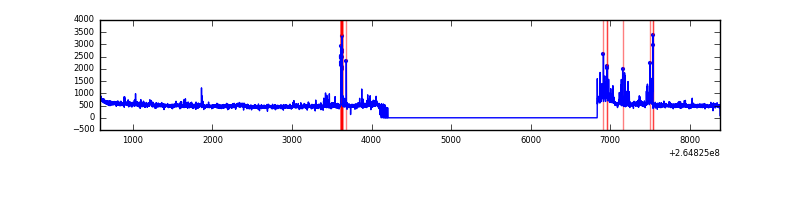 |
| C | 7794 | 5127 | 0 | 0 | 0.00% | 0.00% | 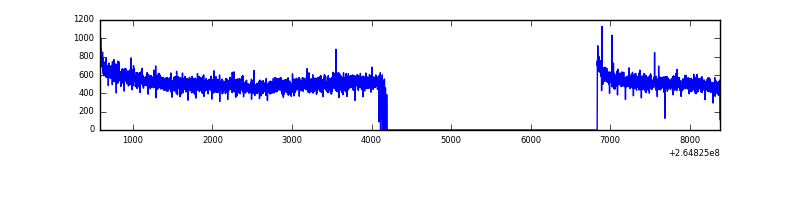 |
| D | 7794 | 5125 | 58 | 58 | 0.74% | 1.13% | 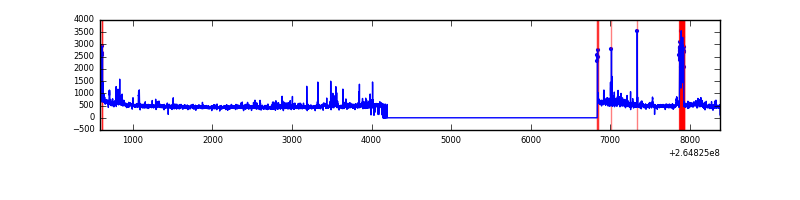 |
Top three noisy pixels from each quadrant. If the there are fewer than three noisy pixels in the level2.evt file, extra rows are filled as -1
| Pixel properties | Quadrant properties | ||||||
|---|---|---|---|---|---|---|---|
| Quadrant | DetID | PixID | Counts | Sigma | Mean | Median | Sigma |
| A | 12 | 189 | 161876 | 1243.86 | 652 | 643 | 129.6 |
| A | 8 | 15 | 19674 | 146.82 | 652 | 643 | 129.6 |
| A | 0 | 226 | 5915 | 40.67 | 652 | 643 | 129.6 |
| B | 0 | 229 | 179643 | 1485.39 | 646 | 634 | 120.5 |
| B | 4 | 48 | 43378 | 354.68 | 646 | 634 | 120.5 |
| B | 4 | 173 | 14342 | 113.75 | 646 | 634 | 120.5 |
| C | 3 | 233 | 207305 | 1453.29 | 618 | 624 | 142.2 |
| C | 13 | 61 | 4483 | 27.13 | 618 | 624 | 142.2 |
| C | 3 | 203 | 1463 | 5.9 | 618 | 624 | 142.2 |
| D | 12 | 233 | 140917 | 964.29 | 618 | 604 | 145.5 |
| D | 5 | 222 | 110780 | 757.18 | 618 | 604 | 145.5 |
| D | 2 | 120 | 47200 | 320.23 | 618 | 604 | 145.5 |
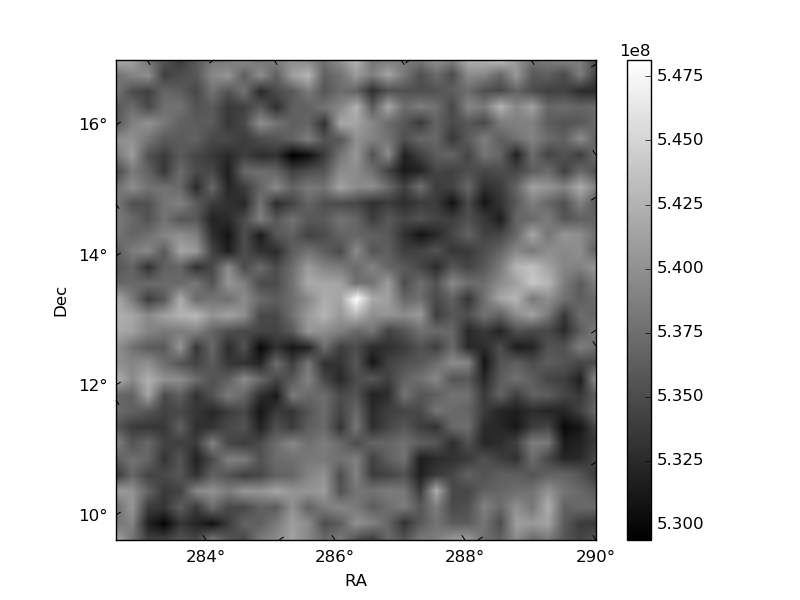
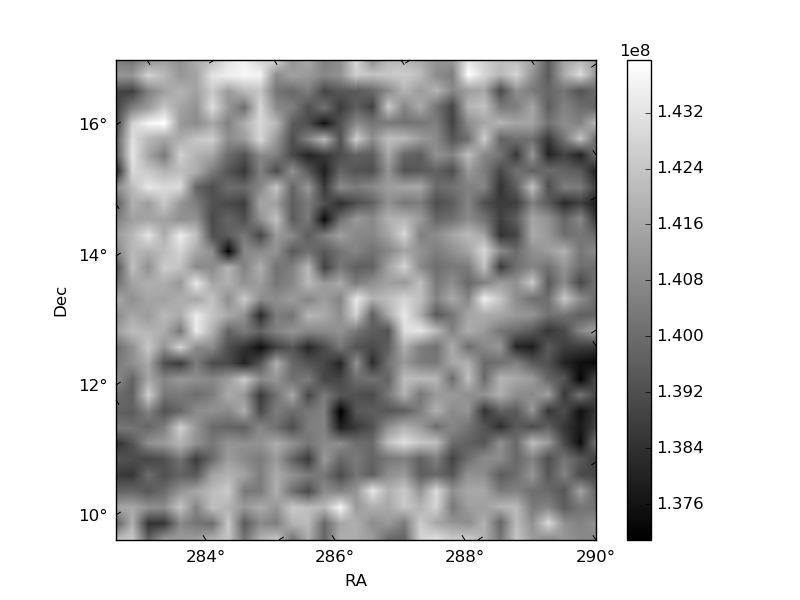
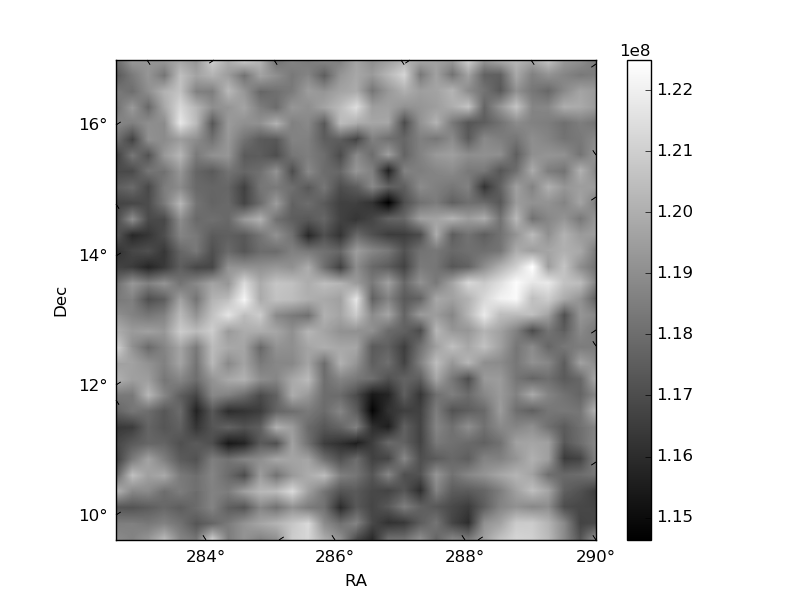
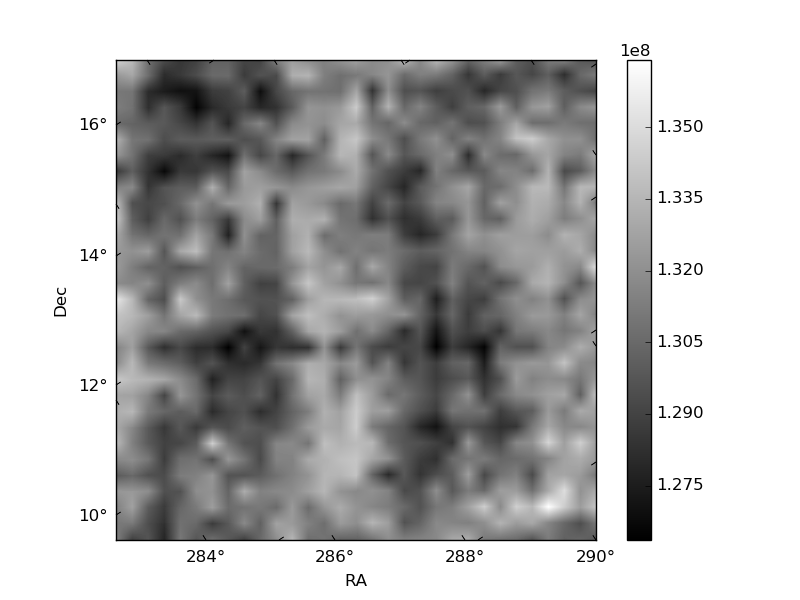
Histogram calculated using DETX and DETY for each event in the final _common_clean file
| Quadrant A | 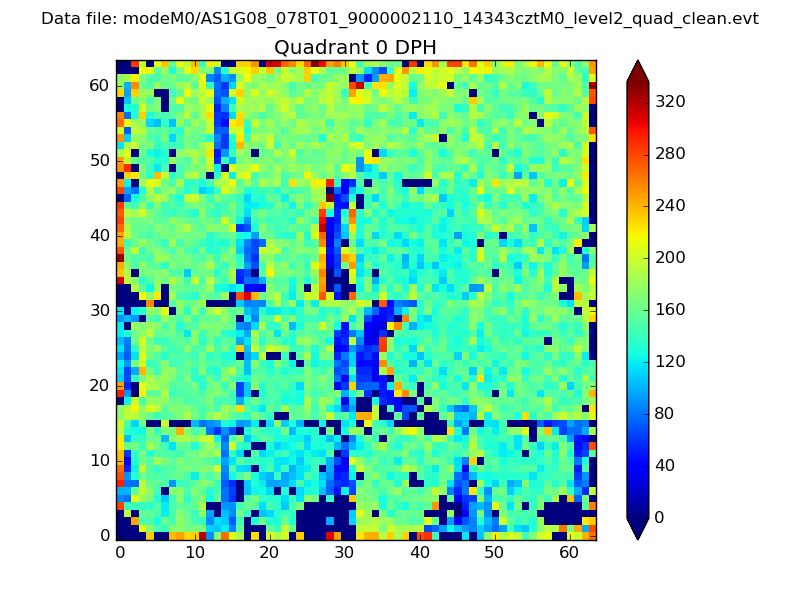 |
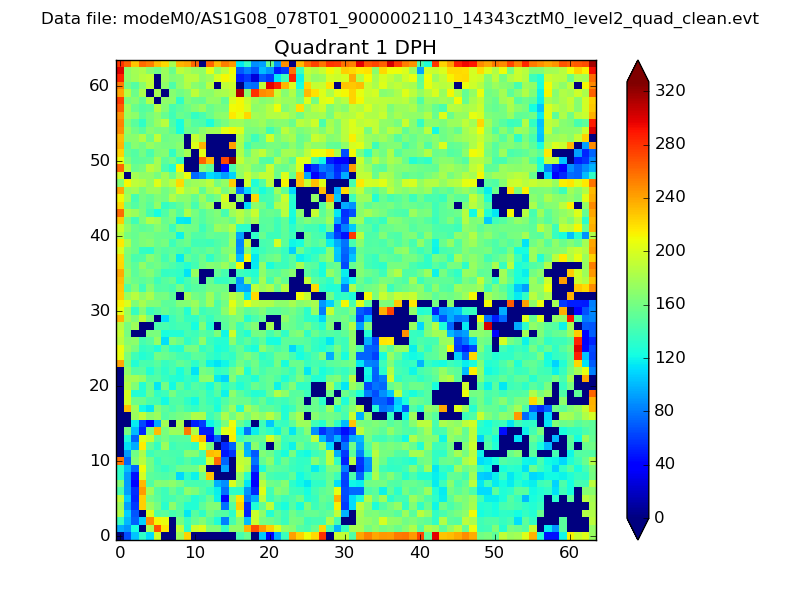 |
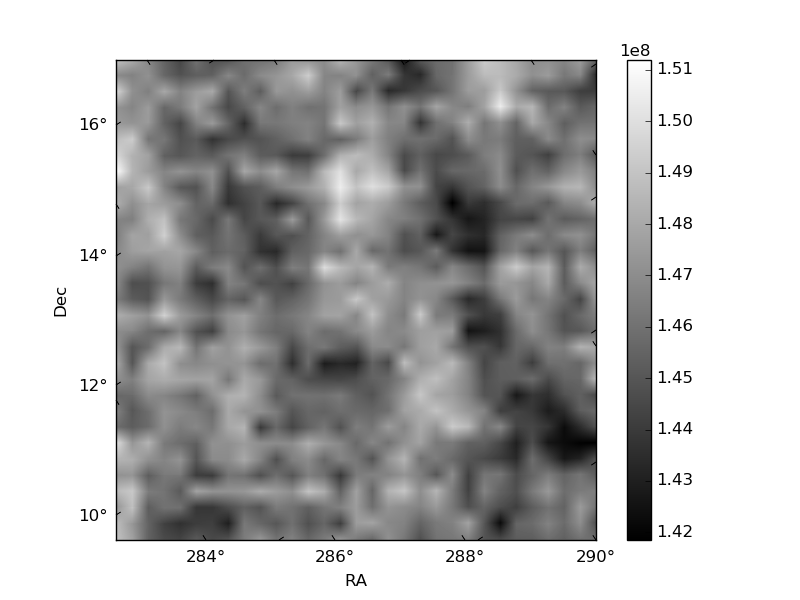
Quadrant B |
|---|---|---|---|
| Quadrant D | 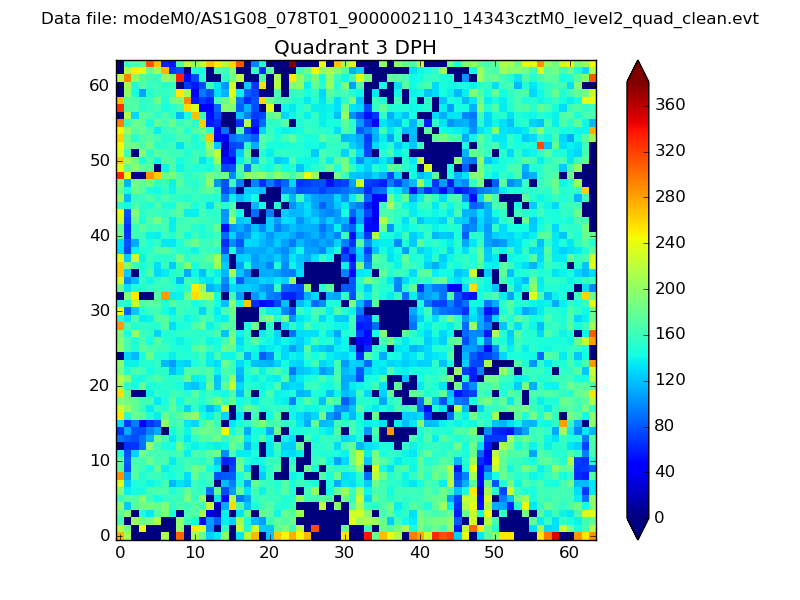 |
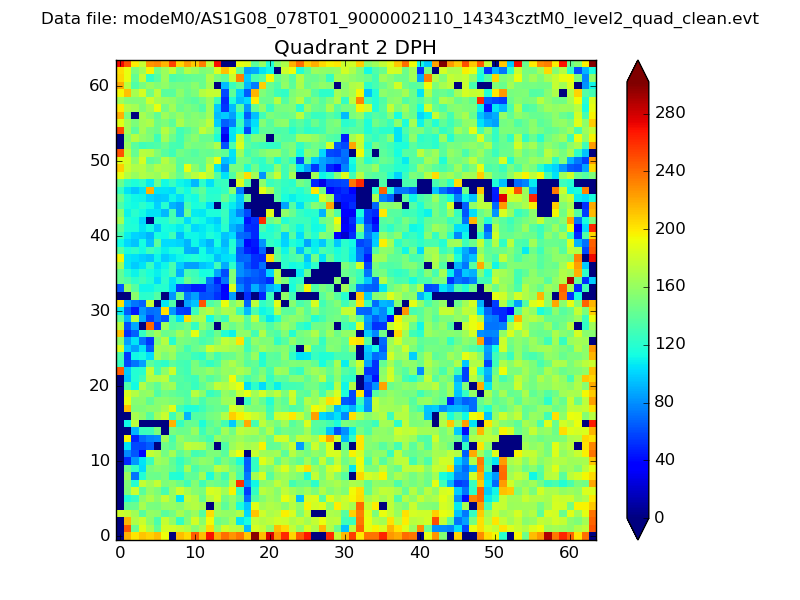 |
Quadrant C |
| Plot type | Count rate plots | Images |
|---|---|---|
| Comparison with Poisson distribution Blue bars denote a histogram of data divided into 1 sec bins. Red curve is a Poisson curve with rate = median count rate of data. |
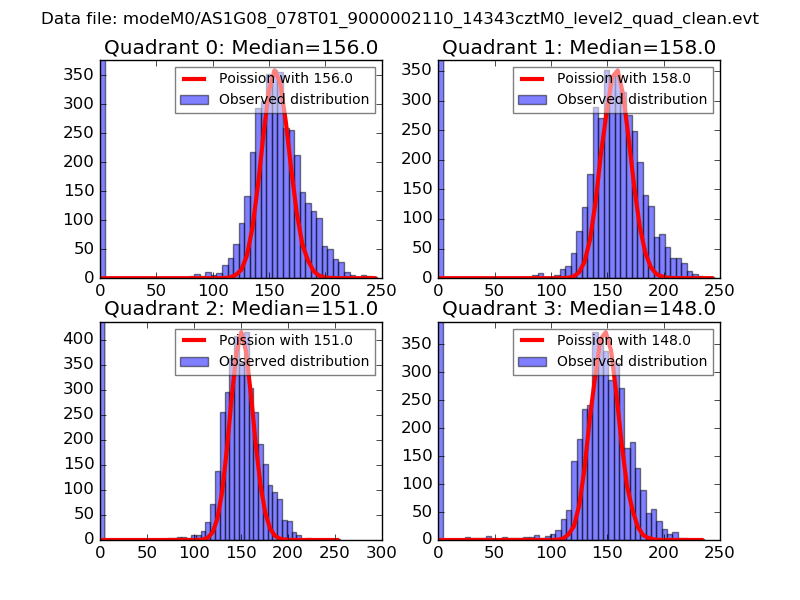 |
 |
| Quadrant-wise count rates Data is divided into 100 sec bins |
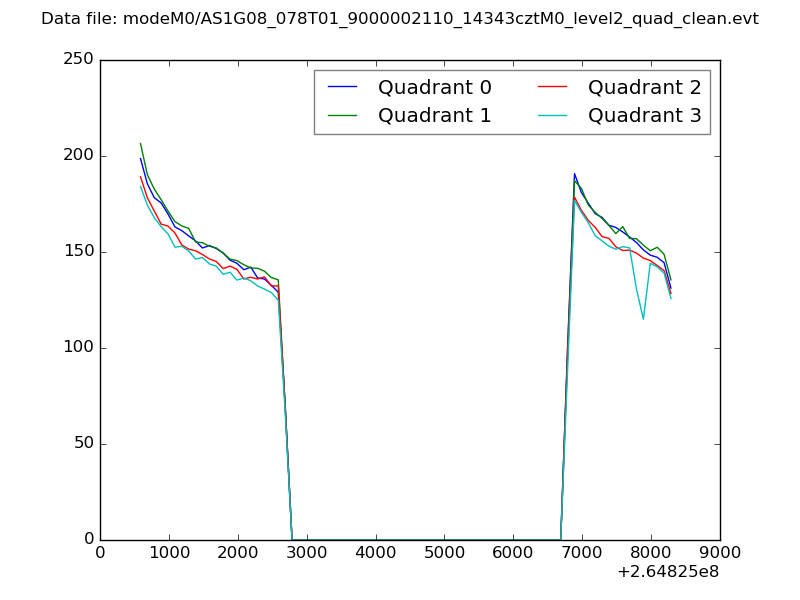 |
|
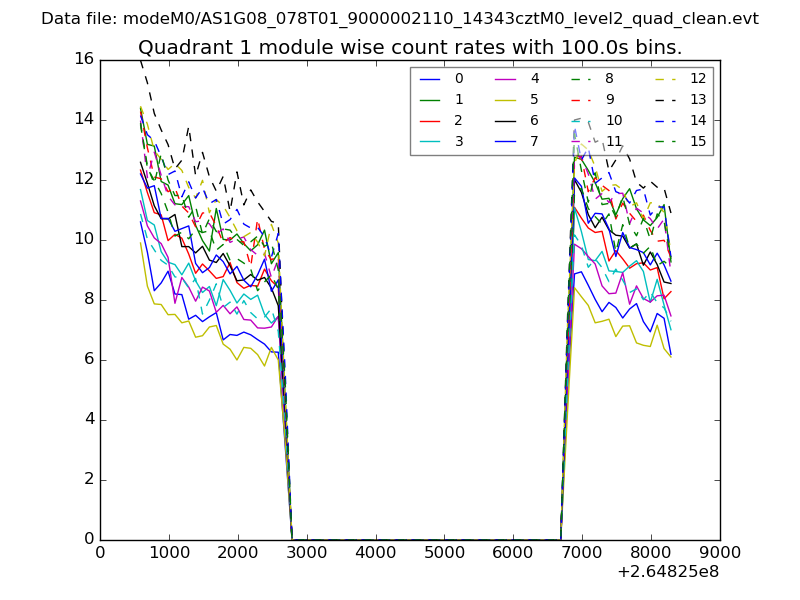
| Module-wise count rates for Quadrant A Data is divided into 100 sec bins |
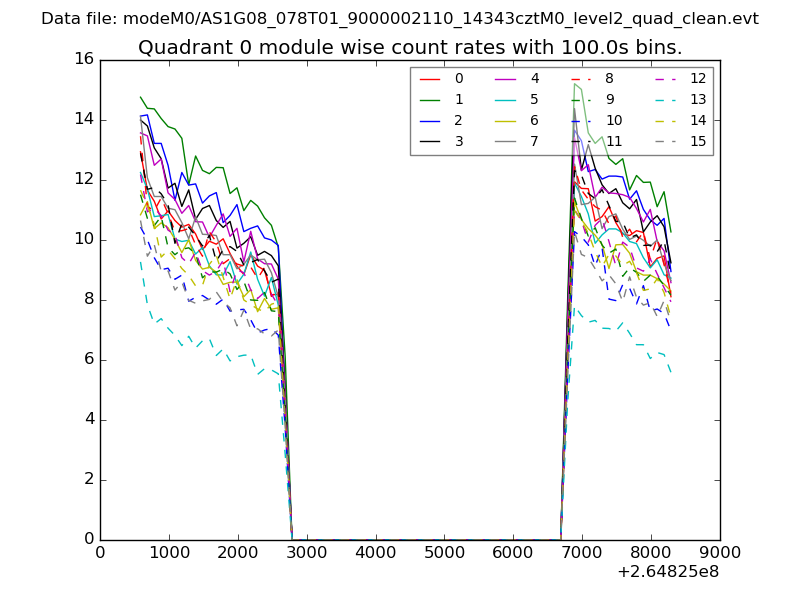 |
 |
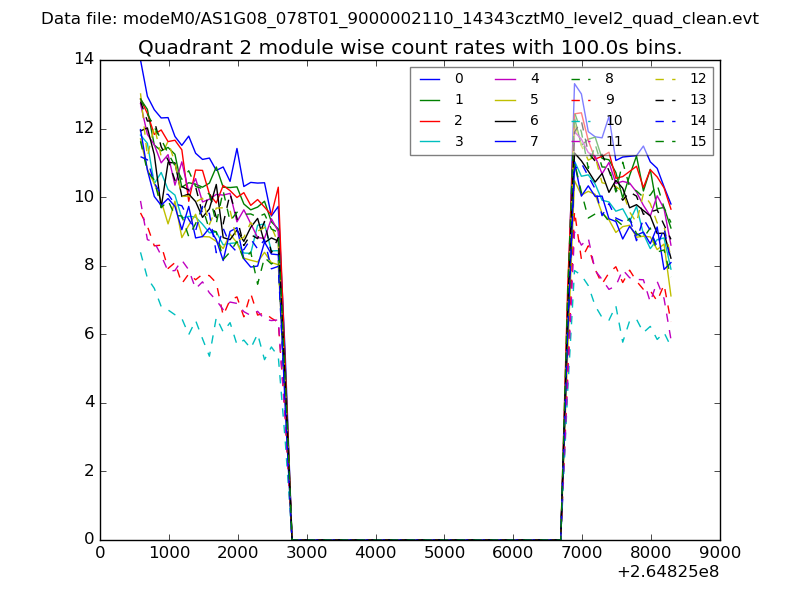
| Module-wise count rates for Quadrant B Data is divided into 100 sec bins |
 |
 |
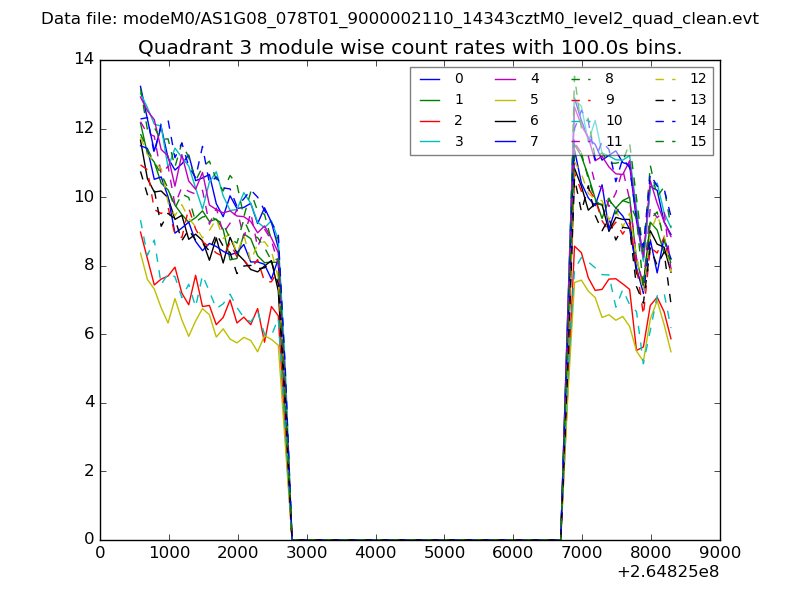
| Module-wise count rates for Quadrant C Data is divided into 100 sec bins |
 |
 |
| Module-wise count rates for Quadrant D Data is divided into 100 sec bins |
 |
 |
| Parameter | Plot |
|---|---|
| CZT HV Monitor | 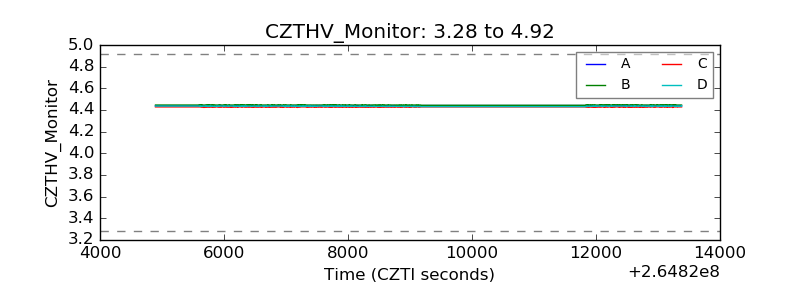 |
| D_VDD | 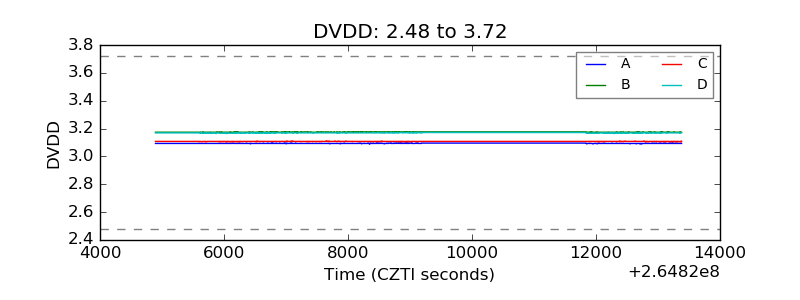 |
| Temperature 1 | 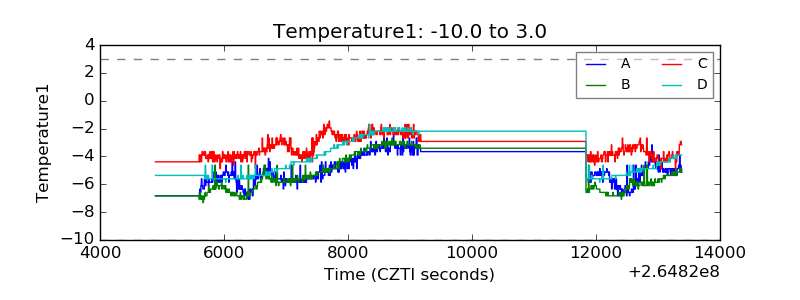 |
| Veto HV Monitor | 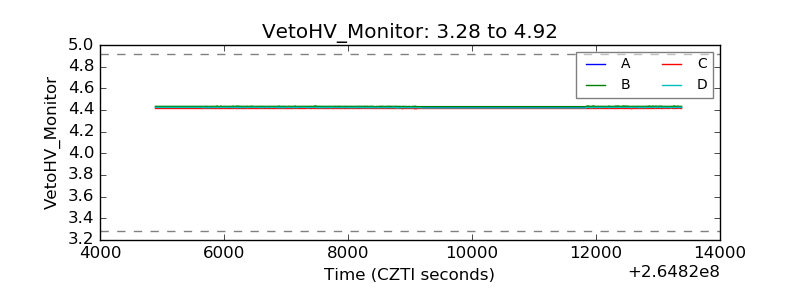 |
| Veto LLD | 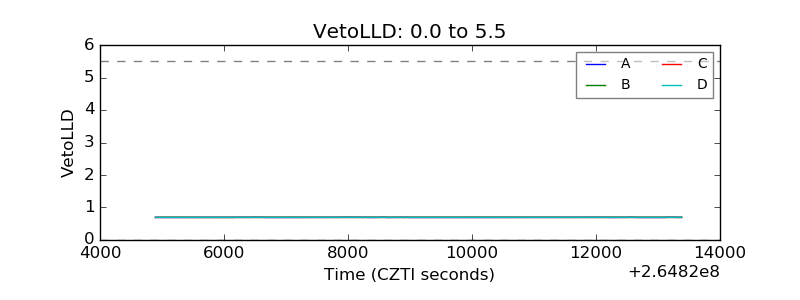 |
| Alpha Counter | 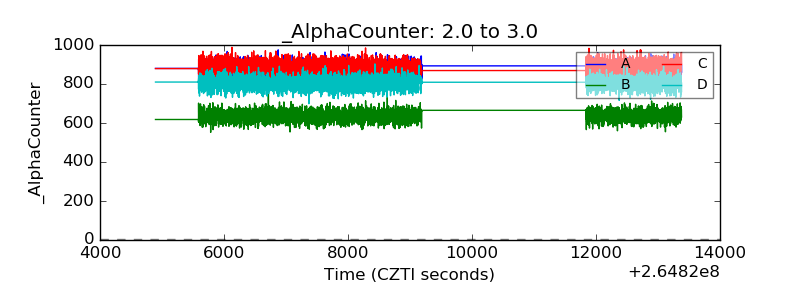 |
| _CPM_Rate | 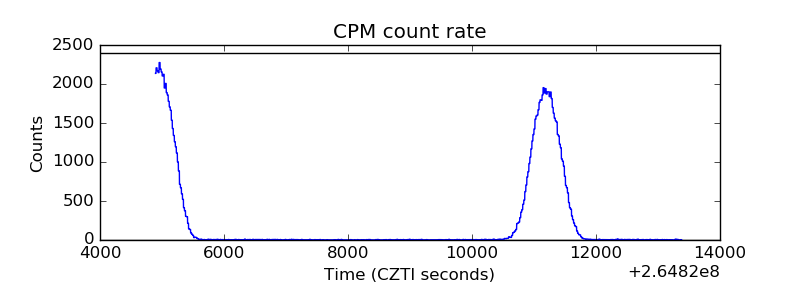 |
| CZT Counter | 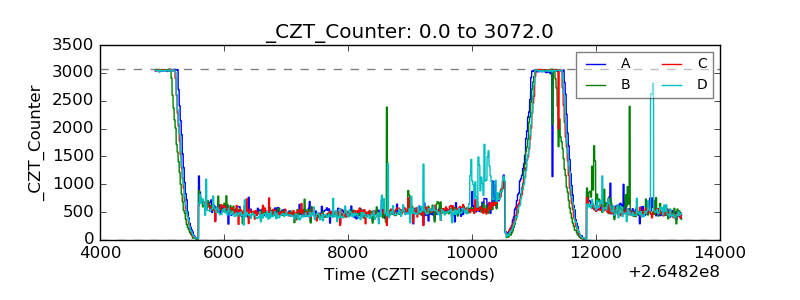 |
| +2.5 Volts monitor |  |
| +5 Volts monitor |  |
| _ROLL_ROT | 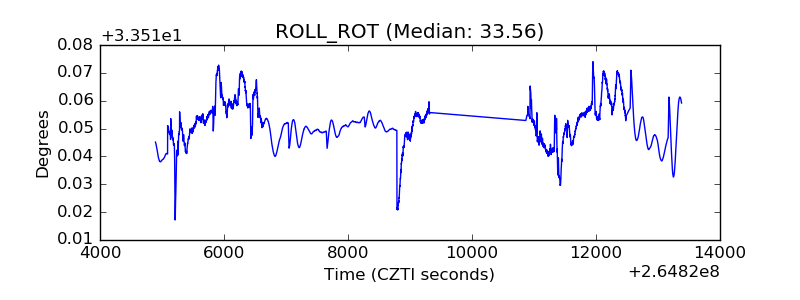 |
| _Roll_DEC | 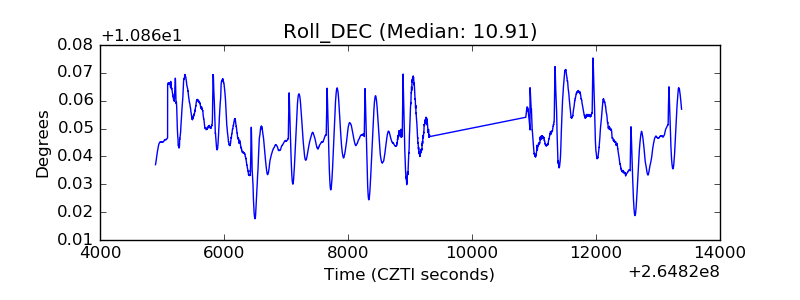 |
| _Roll_RA | 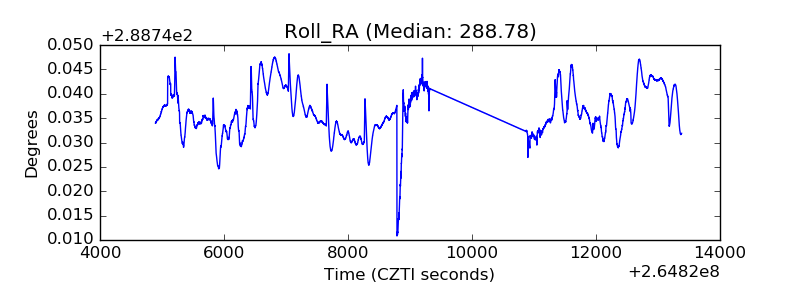 |
| Veto Counter | 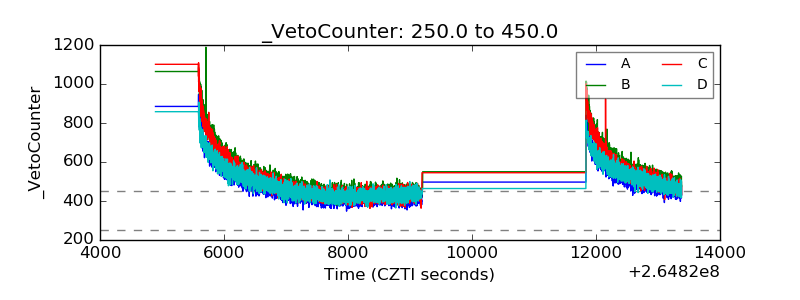 |