| Param | Original file | Final file |
|---|---|---|
| Filename | modeM0/AS1G08_078T01_9000002110_14344cztM0_level2.evt | modeM0/AS1G08_078T01_9000002110_14344cztM0_level2_quad_clean.evt |
| Size (bytes) | 1,181,410,560 | 203,788,800 |
| Size | 1.1 GB | 194.3 MB |
| Events in quadrant A | 8,412,942 | 1,298,800 |
| Events in quadrant B | 8,250,906 | 1,312,532 |
| Events in quadrant C | 8,164,207 | 1,264,891 |
| Events in quadrant D | 9,895,882 | 1,217,719 |
| Mode SS | |||
|---|---|---|---|
| Quadrant | BADHDUFLAG | Total packets | Discarded packets |
| A | 0 | 320 | 0 |
| B | 0 | 320 | 0 |
| C | 0 | 320 | 0 |
| D | 0 | 320 | 0 |
| Mode M0 | |||
|---|---|---|---|
| Quadrant | BADHDUFLAG | Total packets | Discarded packets |
| A | 0 | 34358 | 4 |
| B | 0 | 33828 | 3 |
| C | 0 | 33112 | 3 |
| D | 0 | 39739 | 3 |
| Mode M9 | |||
|---|---|---|---|
| Quadrant | BADHDUFLAG | Total packets | Discarded packets |
| A | 0 | 38 | 0 |
| B | 0 | 38 | 0 |
| C | 0 | 38 | 0 |
| D | 0 | 38 | 0 |
| Quadrant | Total seconds | Saturated seconds | Saturation percentage |
|---|---|---|---|
| A | 15622 | 117 | 0.748944% |
| B | 15622 | 187 | 1.197030% |
| C | 15622 | 70 | 0.448086% |
| D | 15622 | 376 | 2.406862% |
Noise dominated data is calculated using 1-second bins in cleaned event files. If a bin has >2000 counts, and if more than 50% of those come from <1% of pixels, then it is considered to be noise-dominated and hence unusable.
| Quadrant | # 1 sec bins | Bins with >0 counts | Bins with >2000 counts | High rate bins dominated by noise | Noise dominated (total time) | Noise dominated (detector-on time) | Marked lightcurve |
|---|---|---|---|---|---|---|---|
| A | 19509 | 15626 | 0 | 0 | 0.00% | 0.00% | 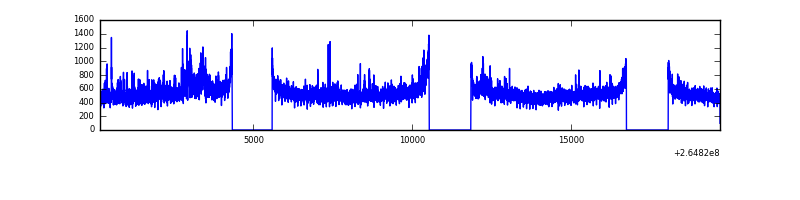 |
| B | 19509 | 15624 | 27 | 27 | 0.14% | 0.17% | 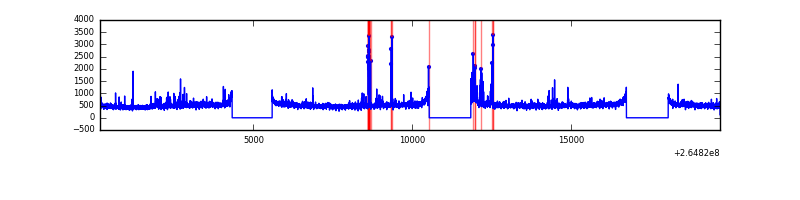 |
| C | 19509 | 15626 | 0 | 0 | 0.00% | 0.00% | 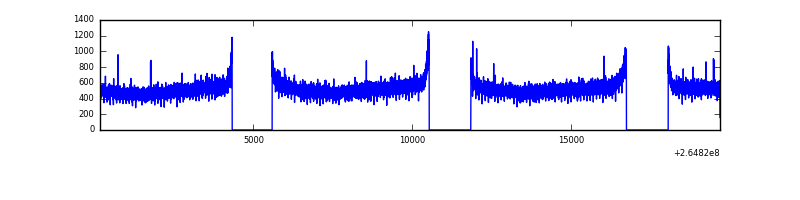 |
| D | 19509 | 15625 | 256 | 256 | 1.31% | 1.64% | 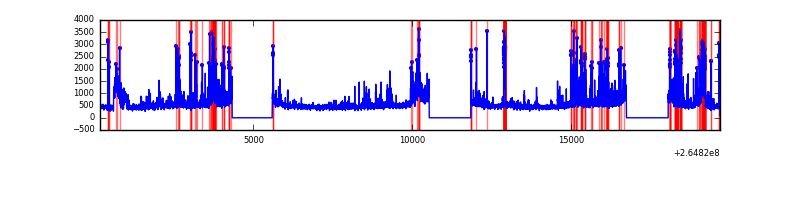 |
Top three noisy pixels from each quadrant. If the there are fewer than three noisy pixels in the level2.evt file, extra rows are filled as -1
| Pixel properties | Quadrant properties | ||||||
|---|---|---|---|---|---|---|---|
| Quadrant | DetID | PixID | Counts | Sigma | Mean | Median | Sigma |
| A | 12 | 189 | 478920 | 1191.19 | 2016 | 1976 | 400.4 |
| A | 8 | 15 | 153588 | 378.66 | 2016 | 1976 | 400.4 |
| A | 8 | 6 | 19788 | 44.49 | 2016 | 1976 | 400.4 |
| B | 0 | 229 | 265485 | 705.94 | 1993 | 1948 | 373.3 |
| B | 0 | 189 | 61078 | 158.39 | 1993 | 1948 | 373.3 |
| B | 4 | 48 | 49047 | 126.16 | 1993 | 1948 | 373.3 |
| C | 3 | 233 | 688722 | 1563.97 | 1917 | 1932 | 439.1 |
| C | 13 | 61 | 13943 | 27.35 | 1917 | 1932 | 439.1 |
| C | 10 | 22 | 4870 | 6.69 | 1917 | 1932 | 439.1 |
| D | 5 | 222 | 1015479 | 2243.65 | 1916 | 1872 | 451.8 |
| D | 12 | 110 | 471242 | 1038.97 | 1916 | 1872 | 451.8 |
| D | 2 | 120 | 453045 | 998.69 | 1916 | 1872 | 451.8 |
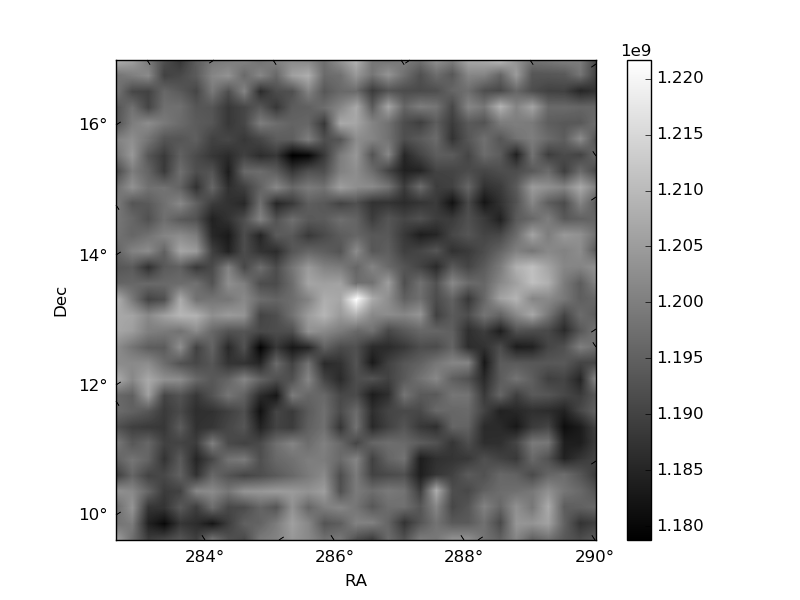
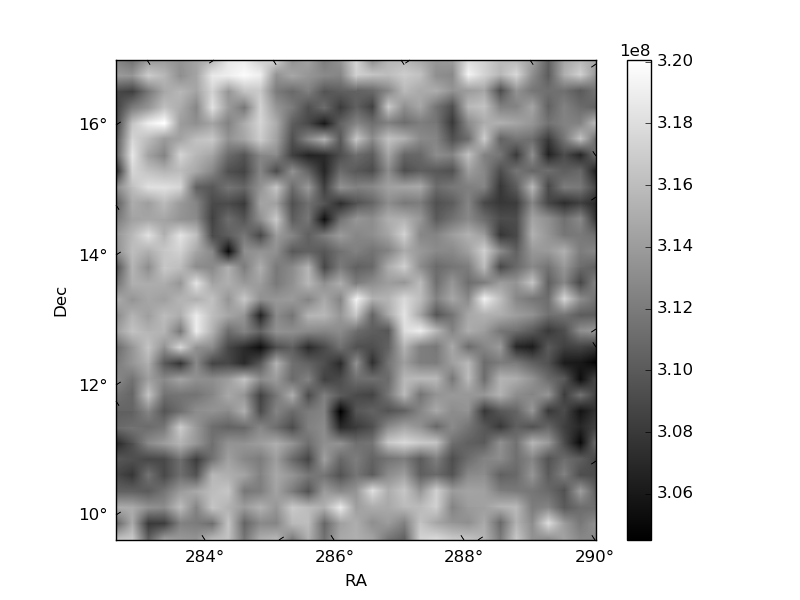
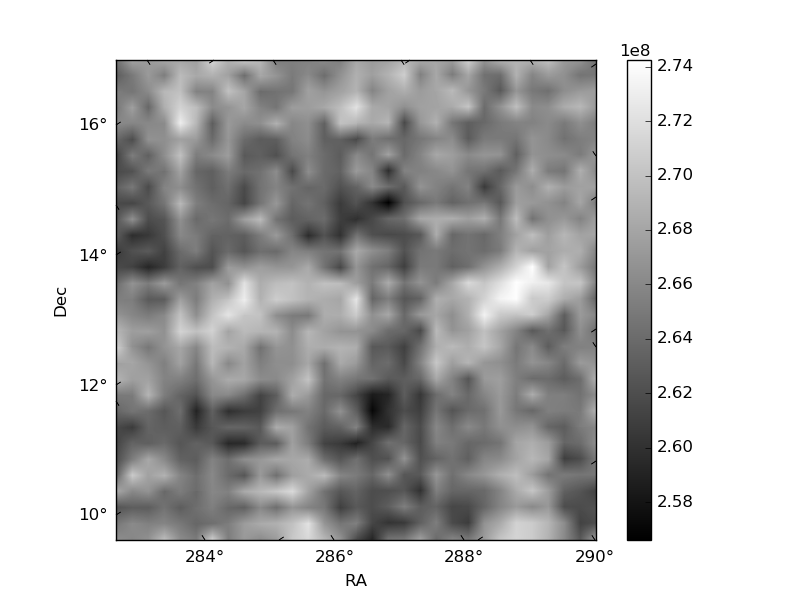
Histogram calculated using DETX and DETY for each event in the final _common_clean file
| Quadrant A | 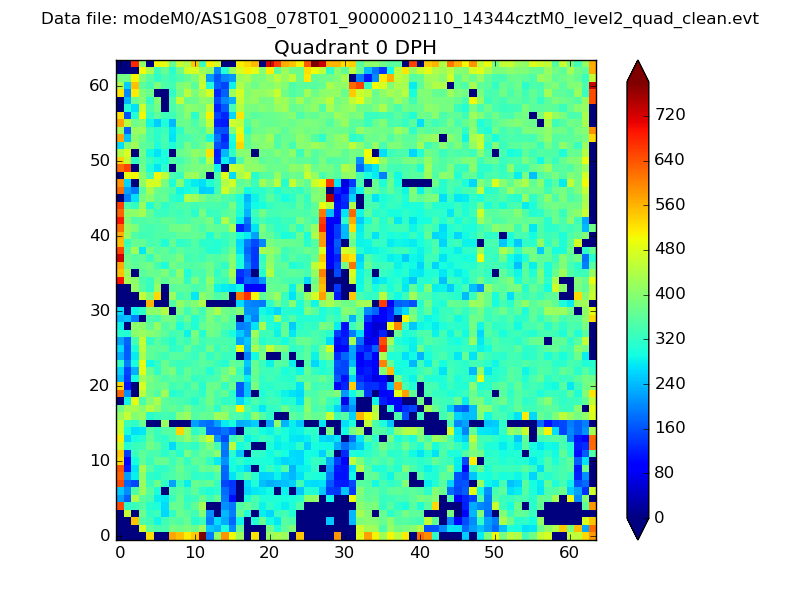 |
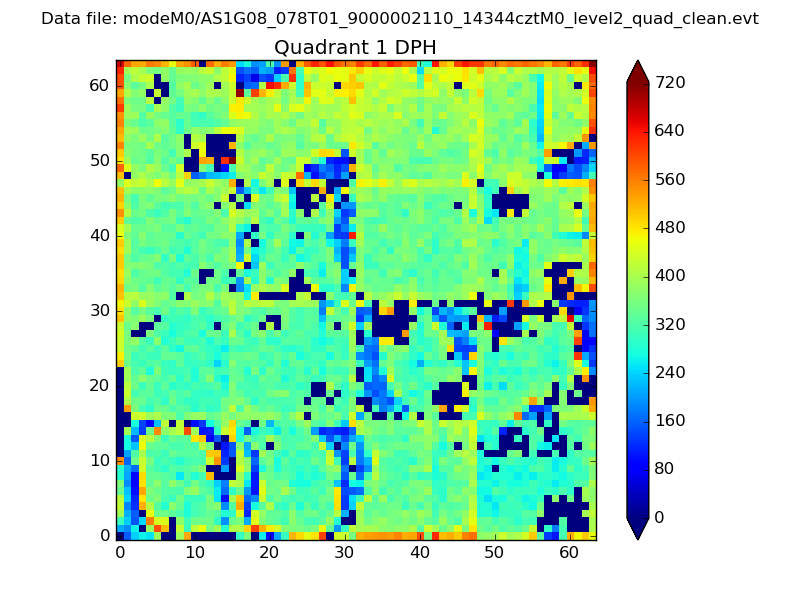 |
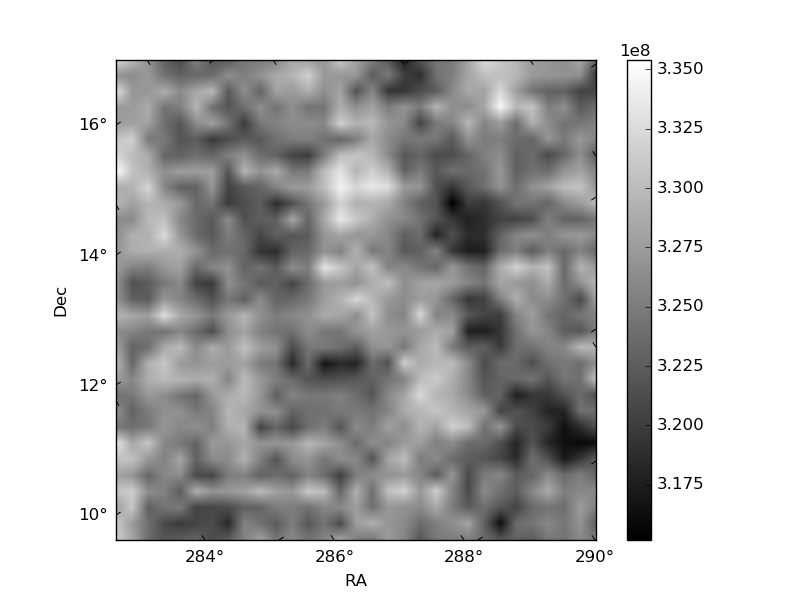
Quadrant B |
|---|---|---|---|
| Quadrant D | 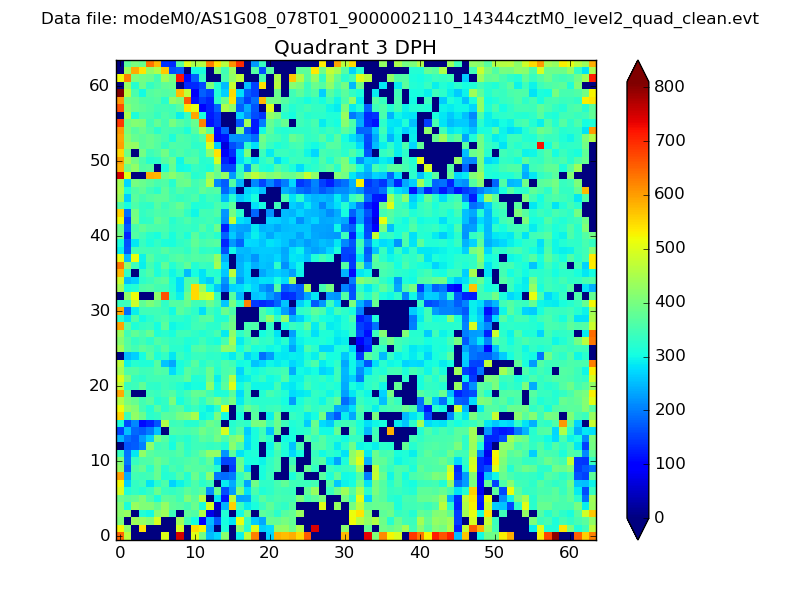 |
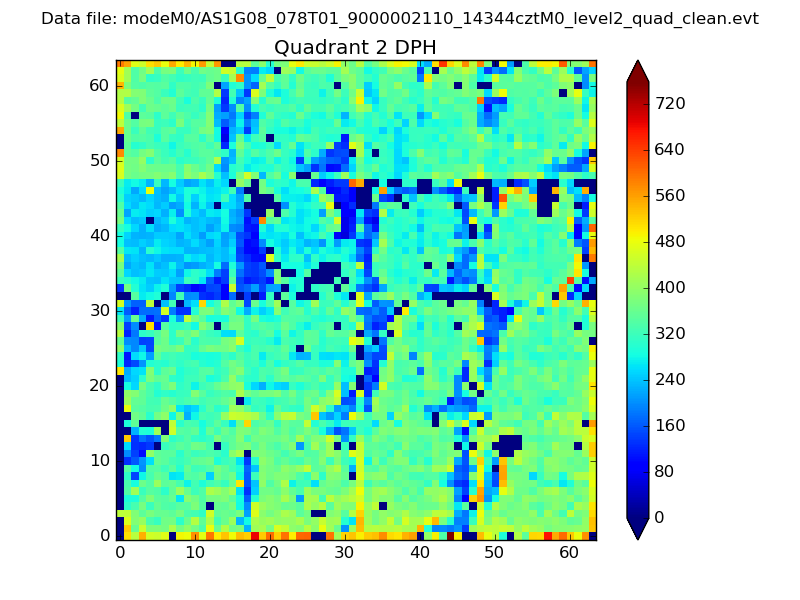 |
Quadrant C |
| Plot type | Count rate plots | Images |
|---|---|---|
| Comparison with Poisson distribution Blue bars denote a histogram of data divided into 1 sec bins. Red curve is a Poisson curve with rate = median count rate of data. |
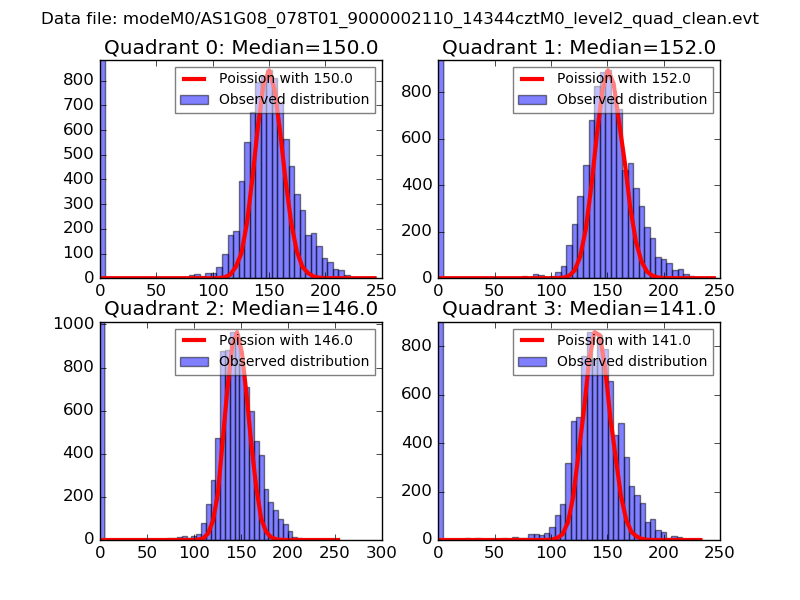 |
 |
| Quadrant-wise count rates Data is divided into 100 sec bins |
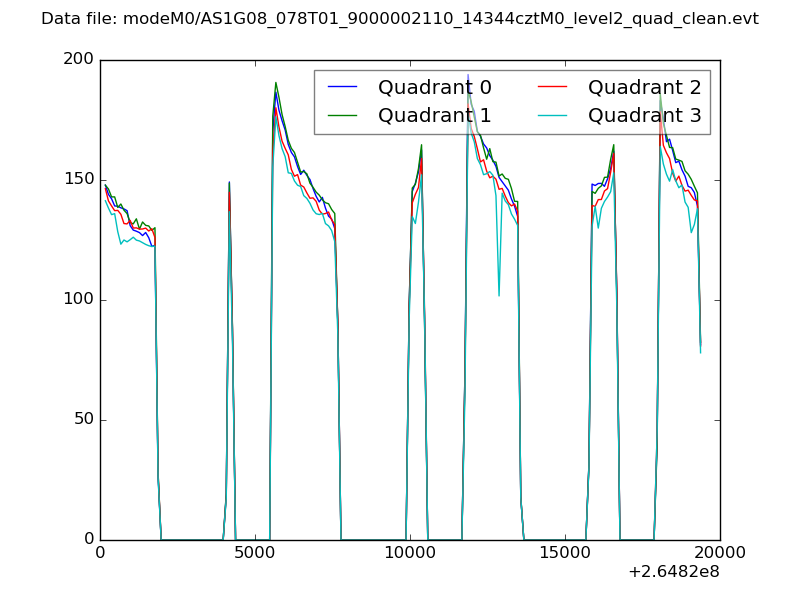 |
|
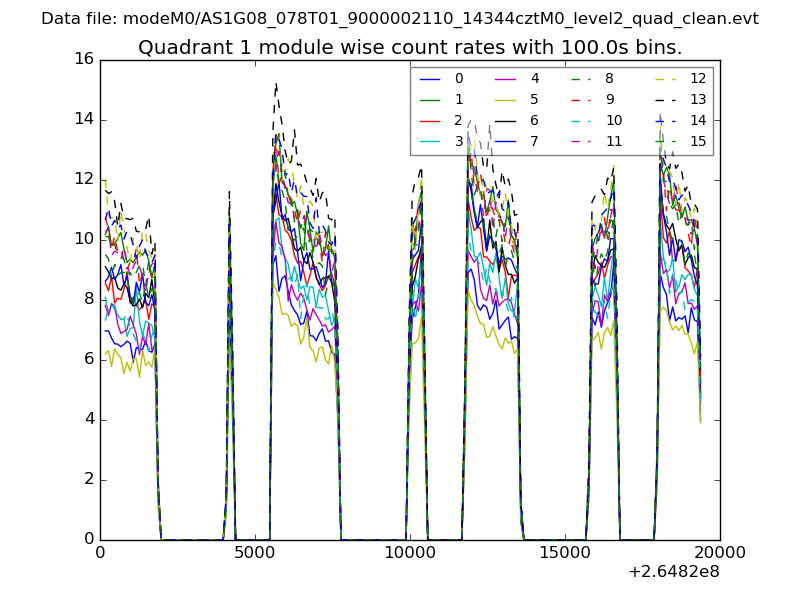
| Module-wise count rates for Quadrant A Data is divided into 100 sec bins |
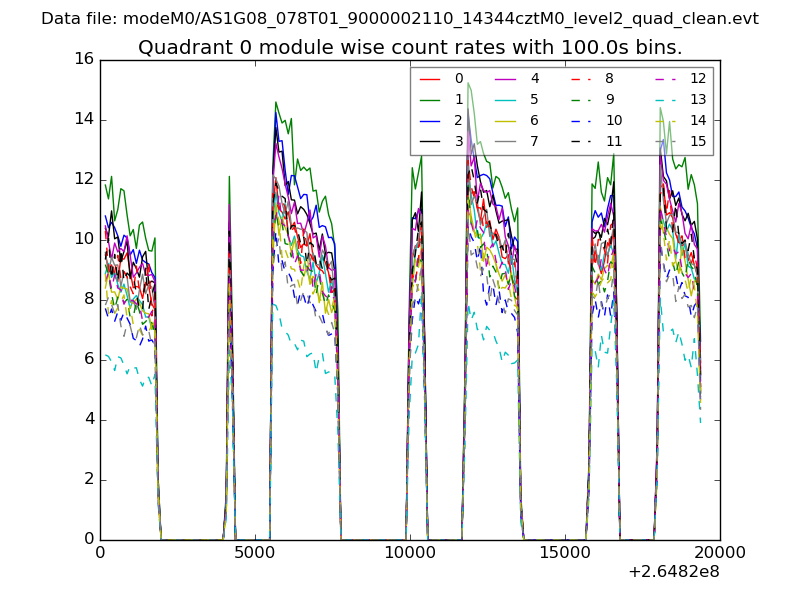 |
 |
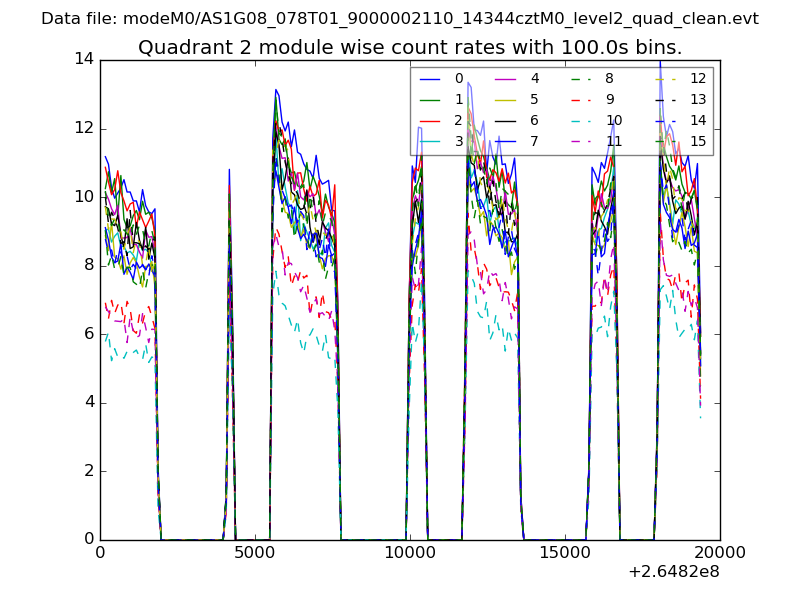
| Module-wise count rates for Quadrant B Data is divided into 100 sec bins |
 |
 |
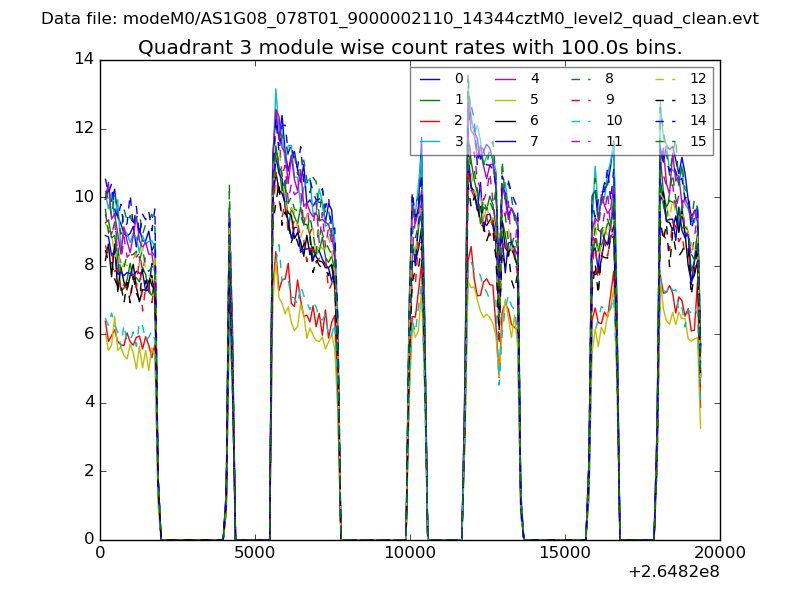
| Module-wise count rates for Quadrant C Data is divided into 100 sec bins |
 |
 |
| Module-wise count rates for Quadrant D Data is divided into 100 sec bins |
 |
 |
| Parameter | Plot |
|---|---|
| CZT HV Monitor | 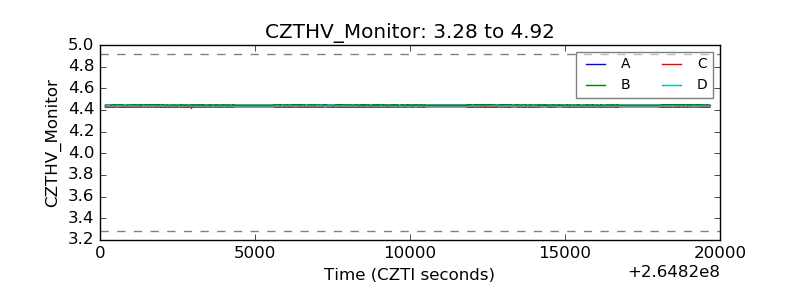 |
| D_VDD |  |
| Temperature 1 | 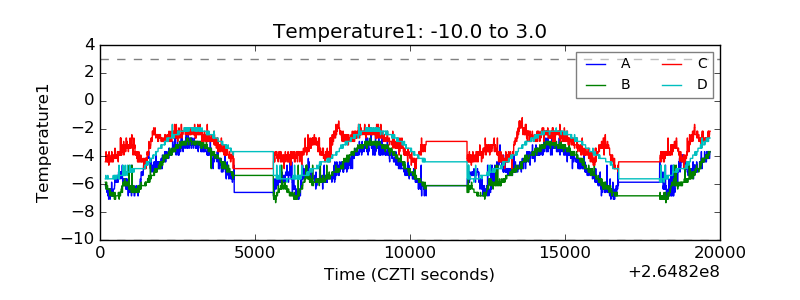 |
| Veto HV Monitor |  |
| Veto LLD | 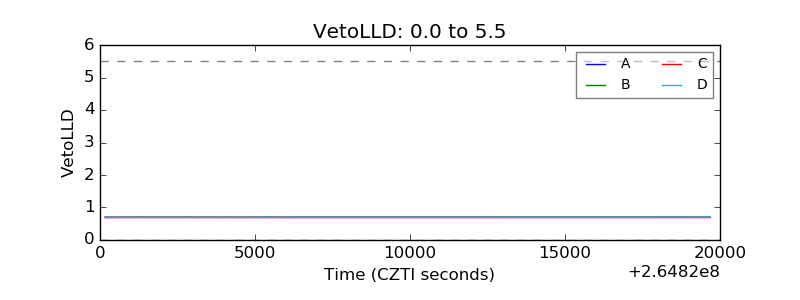 |
| Alpha Counter | 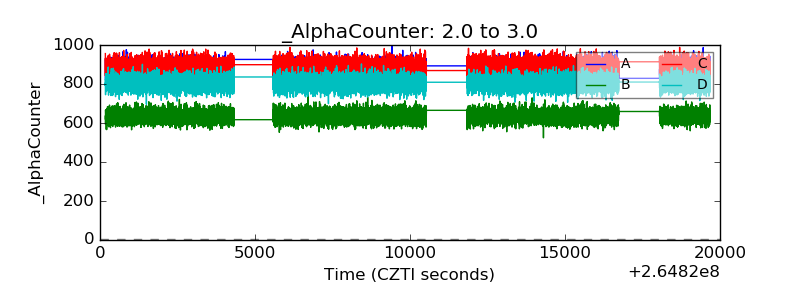 |
| _CPM_Rate |  |
| CZT Counter | 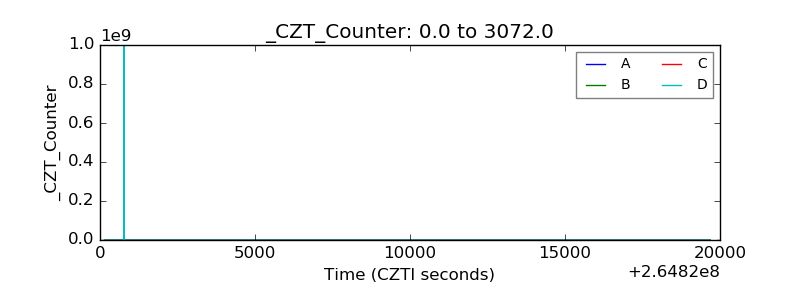 |
| +2.5 Volts monitor |  |
| +5 Volts monitor |  |
| _ROLL_ROT | 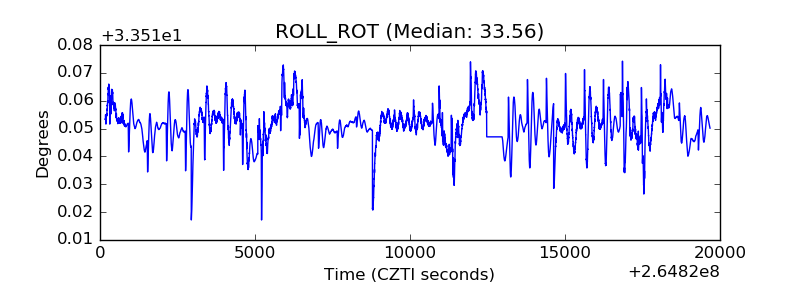 |
| _Roll_DEC | 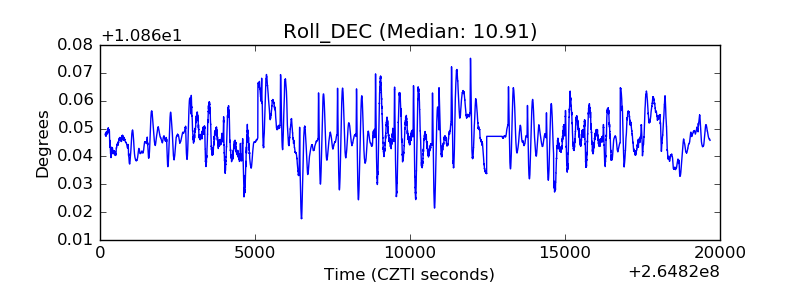 |
| _Roll_RA | 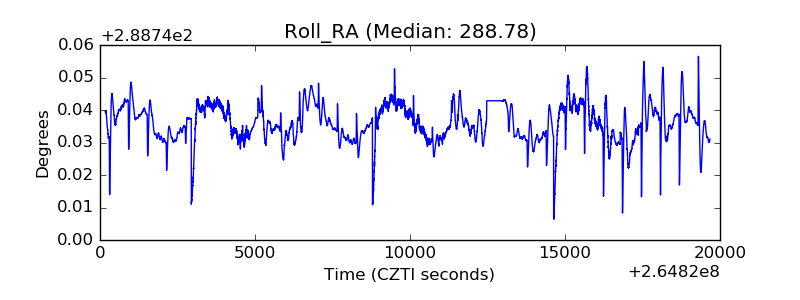 |
| Veto Counter | 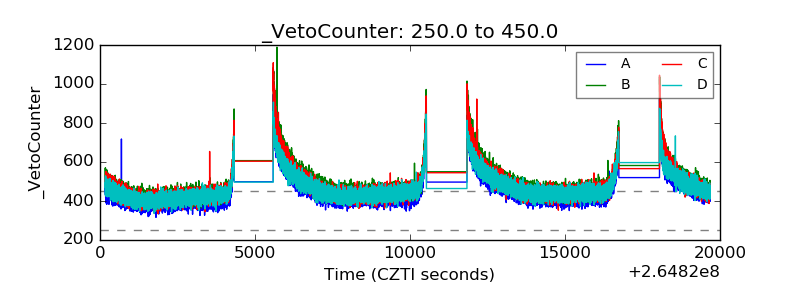 |