| Param | Original file | Final file |
|---|---|---|
| Filename | modeM0/AS1G08_078T01_9000002110_14345cztM0_level2.evt | modeM0/AS1G08_078T01_9000002110_14345cztM0_level2_quad_clean.evt |
| Size (bytes) | 482,149,440 | 78,505,920 |
| Size | 459.8 MB | 74.9 MB |
| Events in quadrant A | 3,188,535 | 494,322 |
| Events in quadrant B | 3,359,461 | 497,478 |
| Events in quadrant C | 3,391,722 | 482,690 |
| Events in quadrant D | 4,235,218 | 463,431 |
| Mode SS | |||
|---|---|---|---|
| Quadrant | BADHDUFLAG | Total packets | Discarded packets |
| A | 0 | 128 | 0 |
| B | 0 | 128 | 0 |
| C | 0 | 128 | 0 |
| D | 0 | 128 | 0 |
| Mode M0 | |||
|---|---|---|---|
| Quadrant | BADHDUFLAG | Total packets | Discarded packets |
| A | 0 | 13122 | 2 |
| B | 0 | 13676 | 1 |
| C | 0 | 13444 | 1 |
| D | 0 | 16656 | 1 |
| Mode M9 | |||
|---|---|---|---|
| Quadrant | BADHDUFLAG | Total packets | Discarded packets |
| A | 0 | 12 | 0 |
| B | 0 | 12 | 0 |
| C | 0 | 12 | 0 |
| D | 0 | 12 | 0 |
| Quadrant | Total seconds | Saturated seconds | Saturation percentage |
|---|---|---|---|
| A | 6291 | 69 | 1.096805% |
| B | 6291 | 111 | 1.764425% |
| C | 6291 | 41 | 0.651725% |
| D | 6291 | 179 | 2.845335% |
Noise dominated data is calculated using 1-second bins in cleaned event files. If a bin has >2000 counts, and if more than 50% of those come from <1% of pixels, then it is considered to be noise-dominated and hence unusable.
| Quadrant | # 1 sec bins | Bins with >0 counts | Bins with >2000 counts | High rate bins dominated by noise | Noise dominated (total time) | Noise dominated (detector-on time) | Marked lightcurve |
|---|---|---|---|---|---|---|---|
| A | 7502 | 6292 | 0 | 0 | 0.00% | 0.00% | 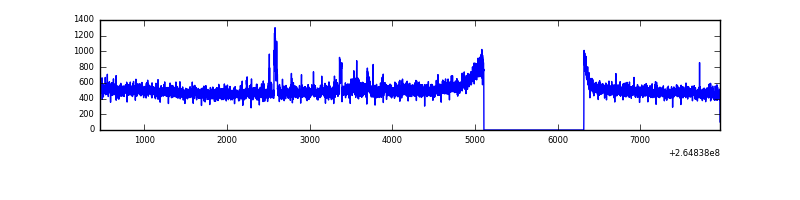 |
| B | 7502 | 6292 | 20 | 20 | 0.27% | 0.32% | 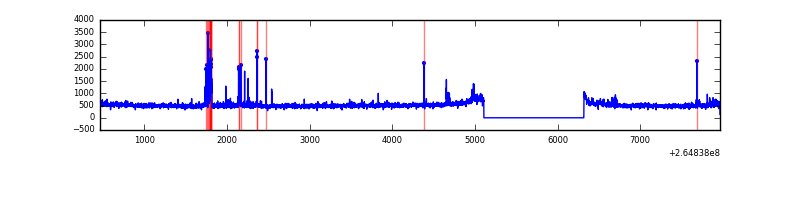 |
| C | 7502 | 6293 | 2 | 2 | 0.03% | 0.03% | 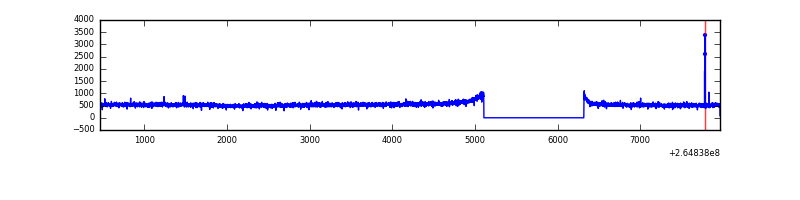 |
| D | 7502 | 6293 | 110 | 110 | 1.47% | 1.75% | 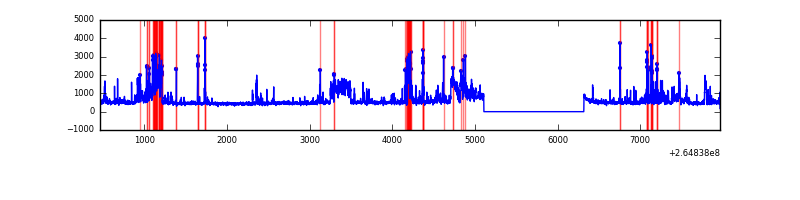 |
Top three noisy pixels from each quadrant. If the there are fewer than three noisy pixels in the level2.evt file, extra rows are filled as -1
| Pixel properties | Quadrant properties | ||||||
|---|---|---|---|---|---|---|---|
| Quadrant | DetID | PixID | Counts | Sigma | Mean | Median | Sigma |
| A | 12 | 189 | 57102 | 343.74 | 811 | 794 | 163.8 |
| A | 8 | 15 | 11489 | 65.29 | 811 | 794 | 163.8 |
| A | 0 | 226 | 7275 | 39.56 | 811 | 794 | 163.8 |
| B | 0 | 229 | 136016 | 879.42 | 797 | 777 | 153.8 |
| B | 0 | 245 | 48892 | 312.88 | 797 | 777 | 153.8 |
| B | 0 | 214 | 24515 | 154.36 | 797 | 777 | 153.8 |
| C | 3 | 233 | 390717 | 2194.2 | 767 | 772 | 177.7 |
| C | 14 | 234 | 11837 | 62.26 | 767 | 772 | 177.7 |
| C | 13 | 61 | 5477 | 26.47 | 767 | 772 | 177.7 |
| D | 12 | 110 | 523434 | 2838.47 | 771 | 755 | 184.1 |
| D | 2 | 120 | 205764 | 1113.32 | 771 | 755 | 184.1 |
| D | 10 | 199 | 167754 | 906.91 | 771 | 755 | 184.1 |
Histogram calculated using DETX and DETY for each event in the final _common_clean file
| Quadrant A | 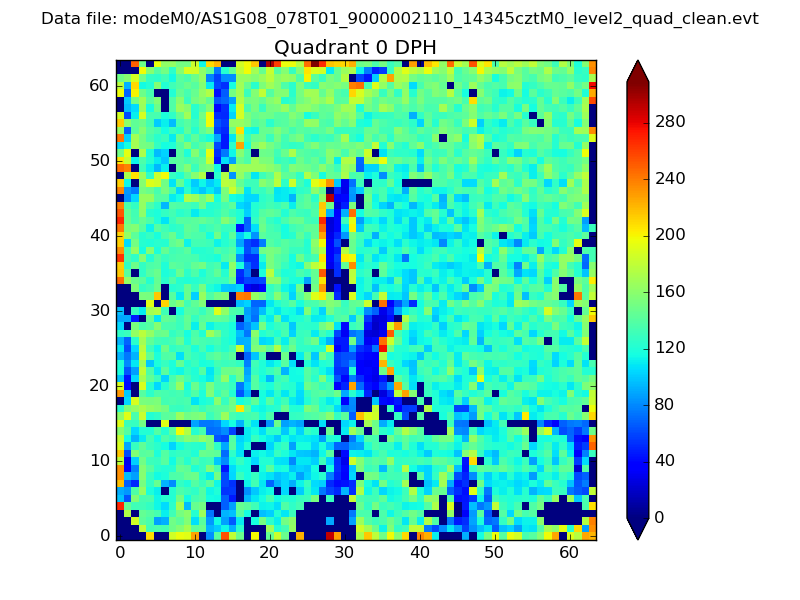 |
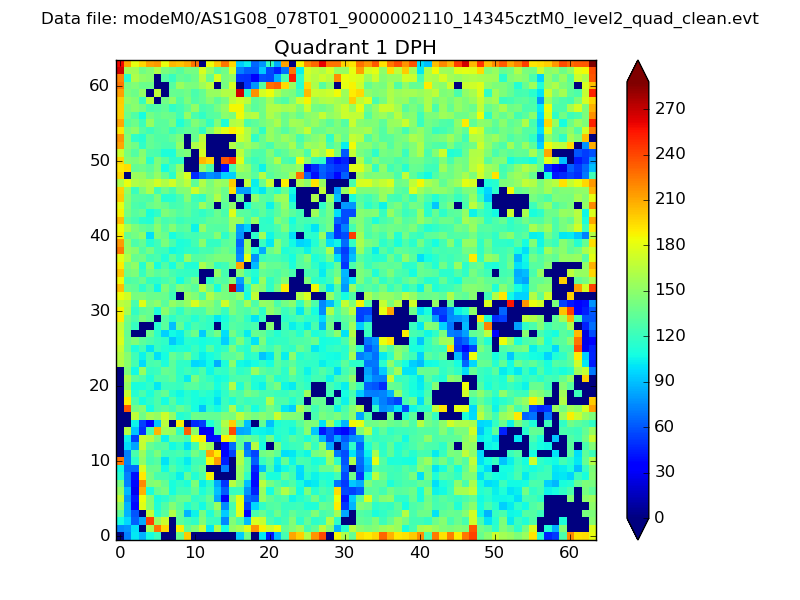 |
Quadrant B |
|---|---|---|---|
| Quadrant D | 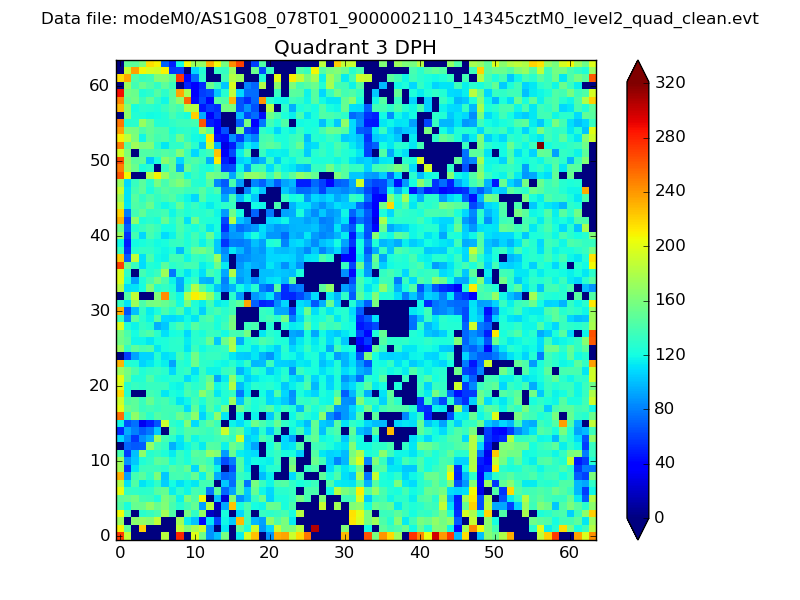 |
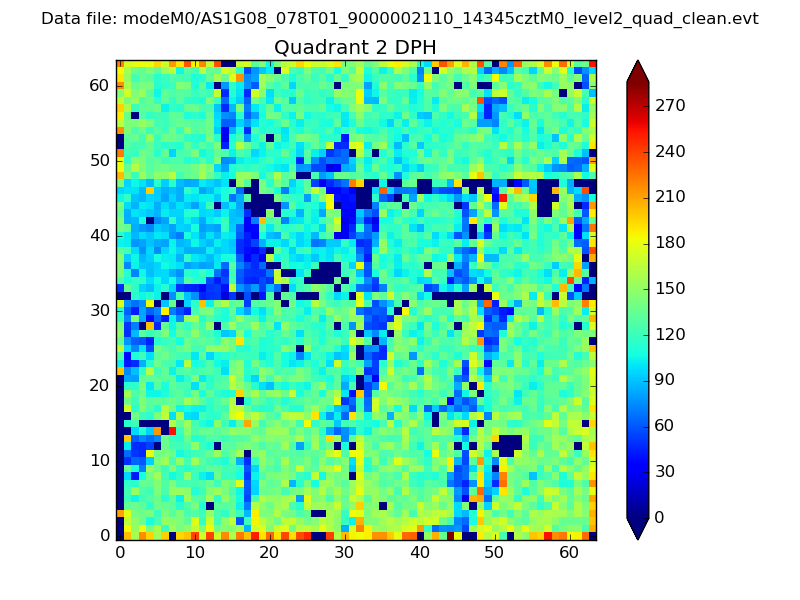 |
Quadrant C |
| Plot type | Count rate plots | Images |
|---|---|---|
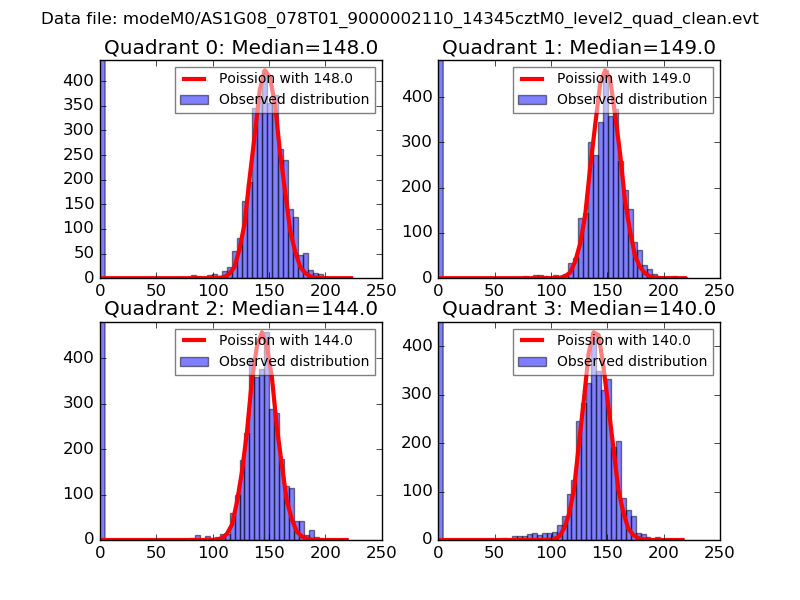
| Comparison with Poisson distribution Blue bars denote a histogram of data divided into 1 sec bins. Red curve is a Poisson curve with rate = median count rate of data. |
 |
 |
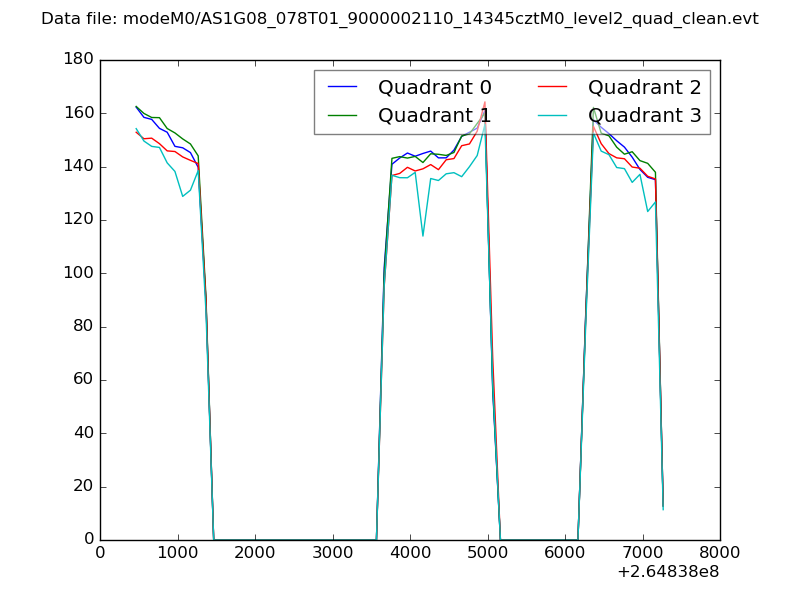
| Quadrant-wise count rates Data is divided into 100 sec bins |
 |
|
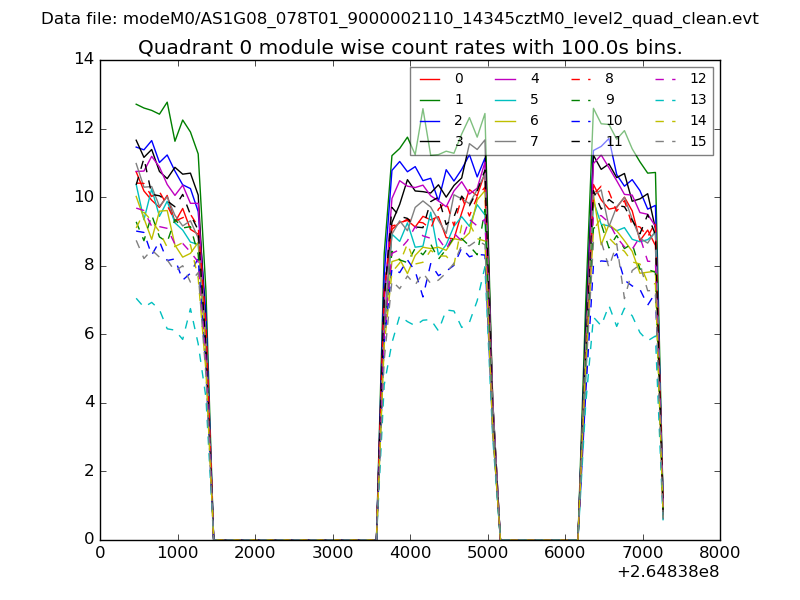
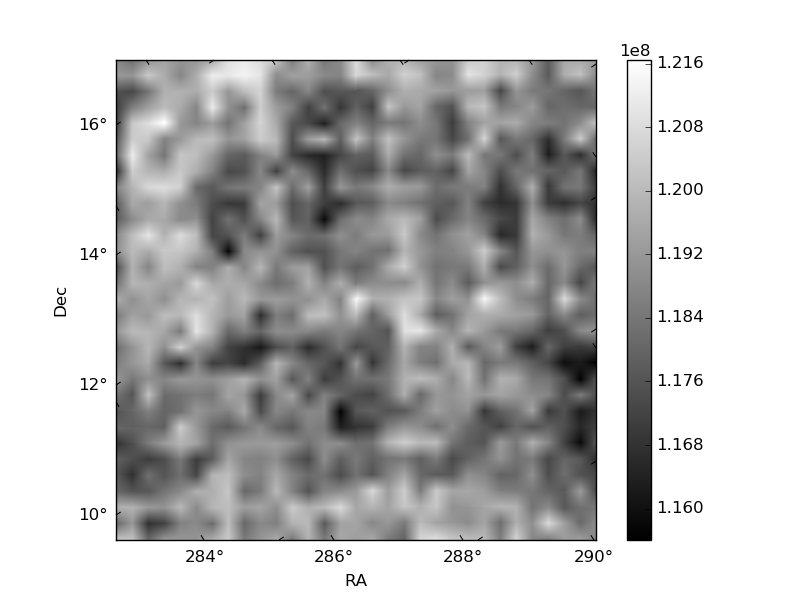
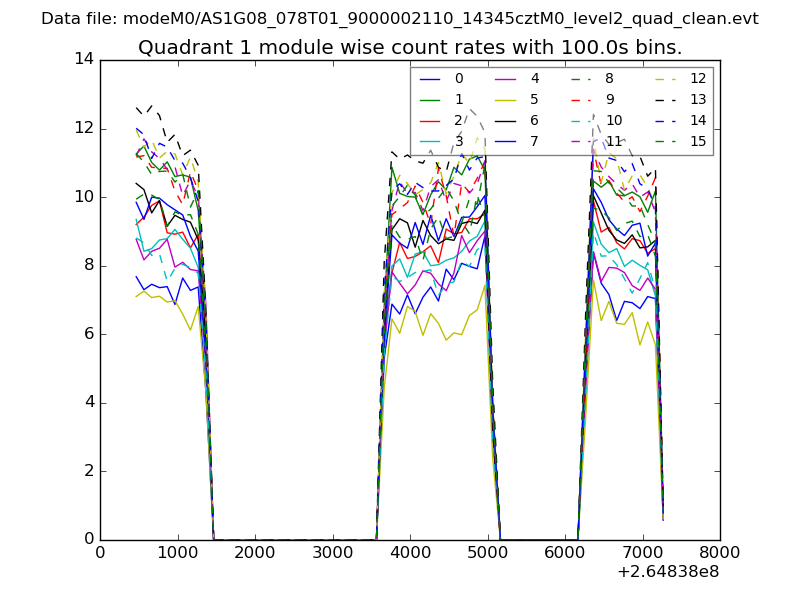
| Module-wise count rates for Quadrant A Data is divided into 100 sec bins |
 |
 |
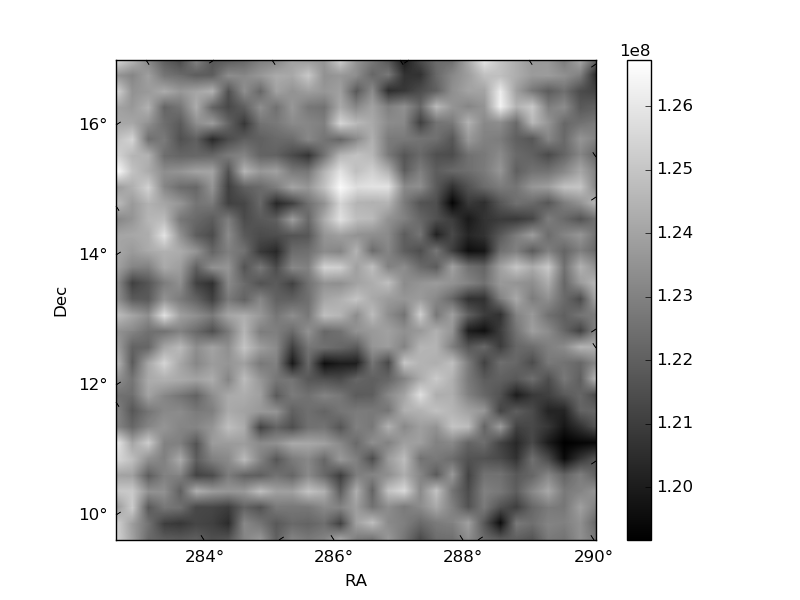
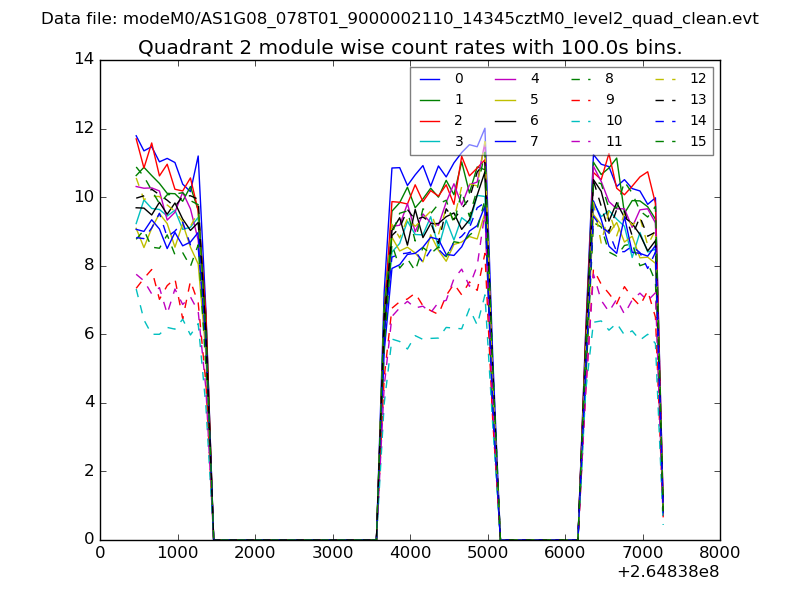
| Module-wise count rates for Quadrant B Data is divided into 100 sec bins |
 |
 |
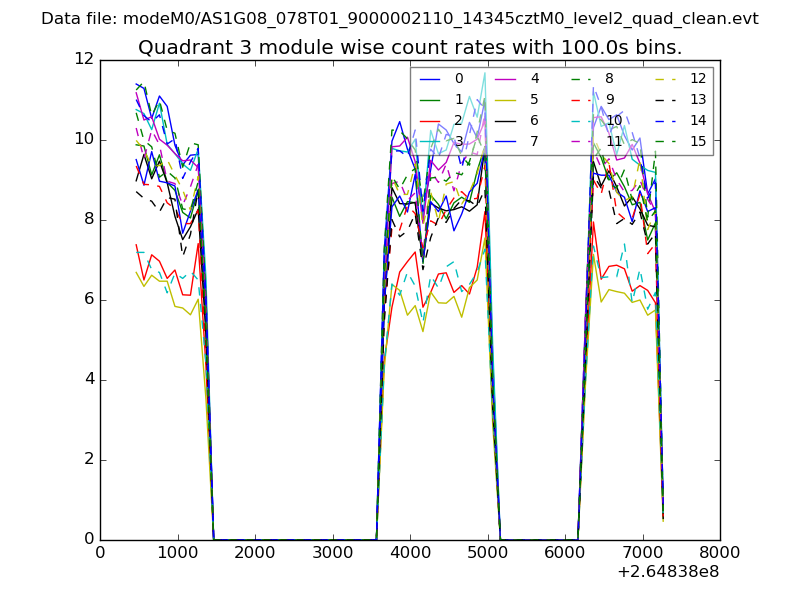
| Module-wise count rates for Quadrant C Data is divided into 100 sec bins |
 |
 |
| Module-wise count rates for Quadrant D Data is divided into 100 sec bins |
 |
 |
| Parameter | Plot |
|---|---|
| CZT HV Monitor | 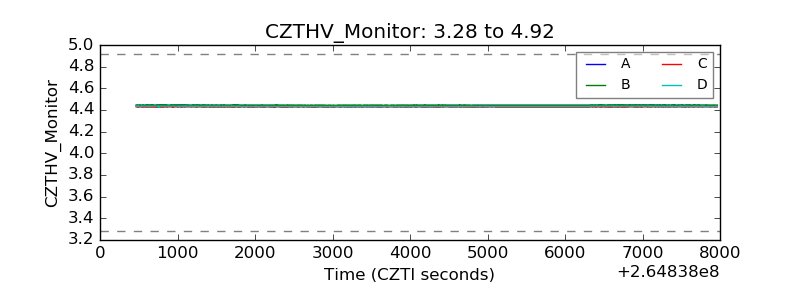 |
| D_VDD | 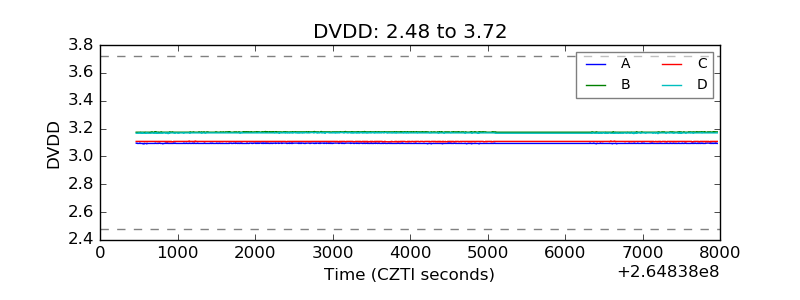 |
| Temperature 1 | 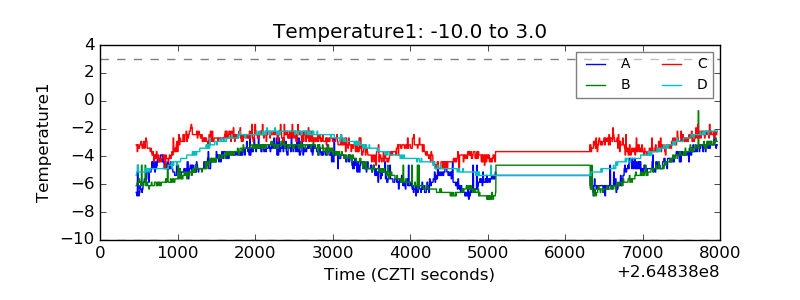 |
| Veto HV Monitor |  |
| Veto LLD | 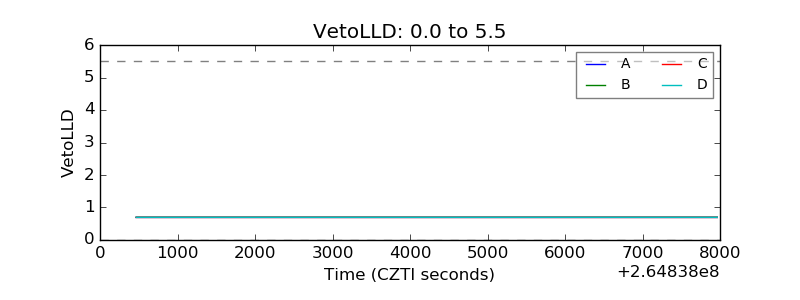 |
| Alpha Counter | 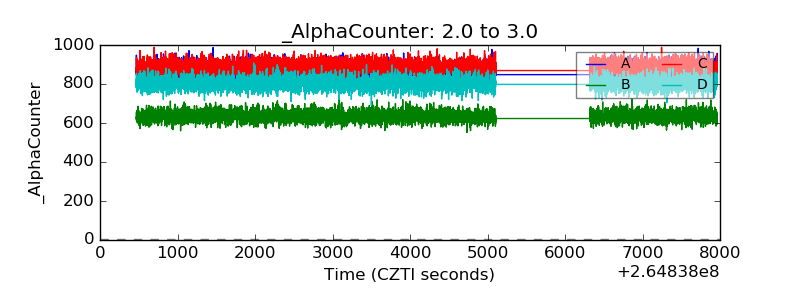 |
| _CPM_Rate | 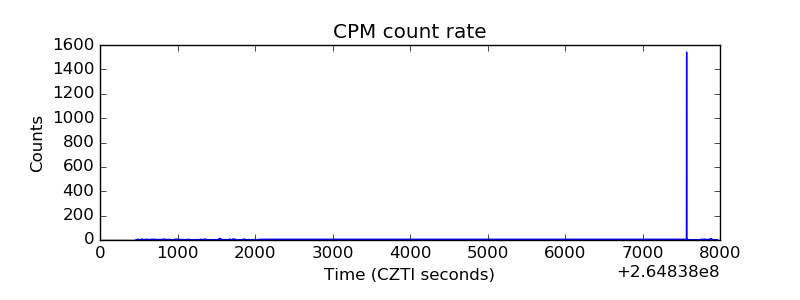 |
| CZT Counter | 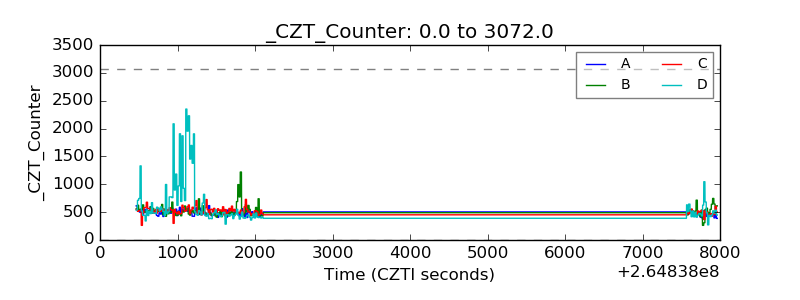 |
| +2.5 Volts monitor |  |
| +5 Volts monitor | 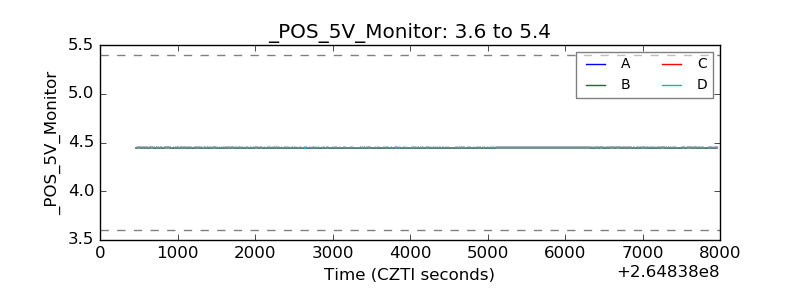 |
| _ROLL_ROT | 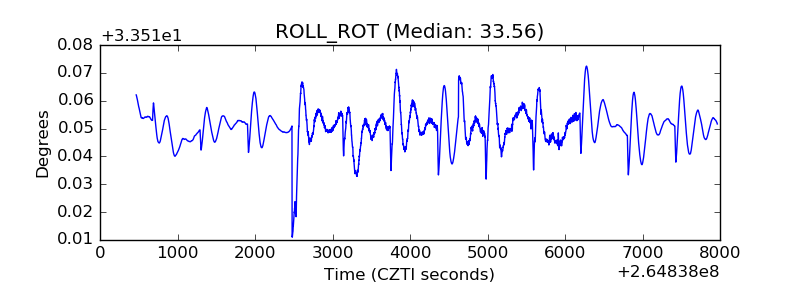 |
| _Roll_DEC | 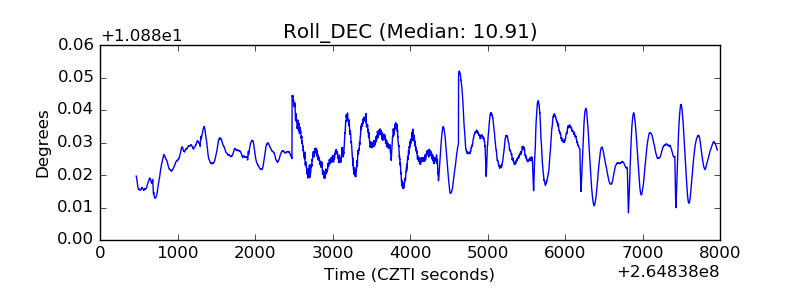 |
| _Roll_RA | 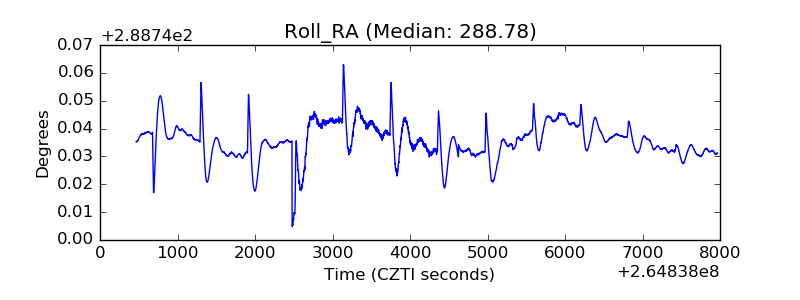 |
| Veto Counter | 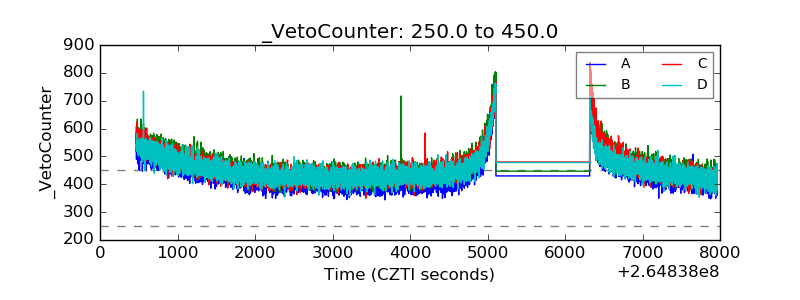 |