| Param | Original file | Final file |
|---|---|---|
| Filename | modeM0/AS1G08_078T01_9000002110_14346cztM0_level2.evt | modeM0/AS1G08_078T01_9000002110_14346cztM0_level2_quad_clean.evt |
| Size (bytes) | 539,435,520 | 74,151,360 |
| Size | 514.4 MB | 70.7 MB |
| Events in quadrant A | 3,337,388 | 456,489 |
| Events in quadrant B | 3,288,771 | 459,722 |
| Events in quadrant C | 3,518,123 | 447,364 |
| Events in quadrant D | 5,752,016 | 428,426 |
| Mode SS | |||
|---|---|---|---|
| Quadrant | BADHDUFLAG | Total packets | Discarded packets |
| A | 0 | 132 | 0 |
| B | 0 | 132 | 0 |
| C | 0 | 132 | 0 |
| D | 0 | 132 | 0 |
| Mode M0 | |||
|---|---|---|---|
| Quadrant | BADHDUFLAG | Total packets | Discarded packets |
| A | 0 | 13860 | 2 |
| B | 0 | 13690 | 1 |
| C | 0 | 13924 | 1 |
| D | 0 | 21394 | 1 |
| Mode M9 | |||
|---|---|---|---|
| Quadrant | BADHDUFLAG | Total packets | Discarded packets |
| A | 0 | 10 | 0 |
| B | 0 | 10 | 0 |
| C | 0 | 10 | 0 |
| D | 0 | 10 | 0 |
| Quadrant | Total seconds | Saturated seconds | Saturation percentage |
|---|---|---|---|
| A | 6503 | 108 | 1.660772% |
| B | 6503 | 121 | 1.860680% |
| C | 6503 | 64 | 0.984161% |
| D | 6503 | 835 | 12.840228% |
Noise dominated data is calculated using 1-second bins in cleaned event files. If a bin has >2000 counts, and if more than 50% of those come from <1% of pixels, then it is considered to be noise-dominated and hence unusable.
| Quadrant | # 1 sec bins | Bins with >0 counts | Bins with >2000 counts | High rate bins dominated by noise | Noise dominated (total time) | Noise dominated (detector-on time) | Marked lightcurve |
|---|---|---|---|---|---|---|---|
| A | 7424 | 6504 | 2 | 2 | 0.03% | 0.03% | 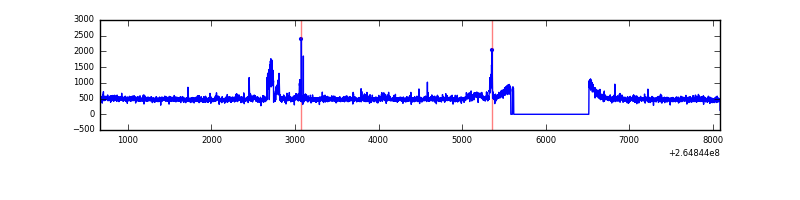 |
| B | 7424 | 6504 | 4 | 4 | 0.05% | 0.06% | 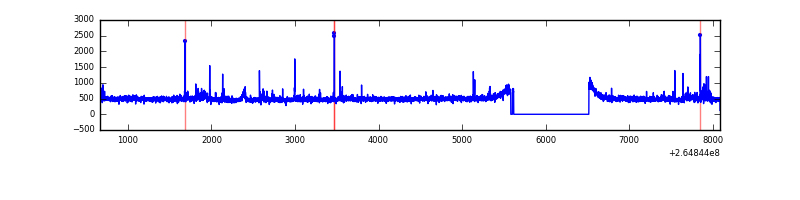 |
| C | 7424 | 6505 | 2 | 2 | 0.03% | 0.03% | 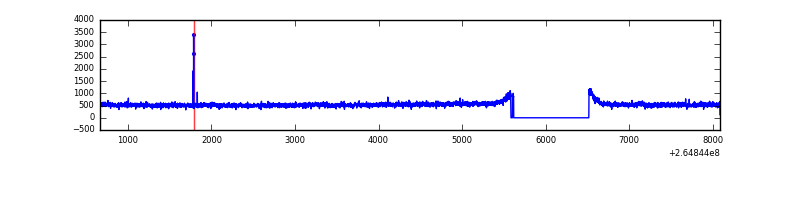 |
| D | 7424 | 6505 | 620 | 620 | 8.35% | 9.53% | 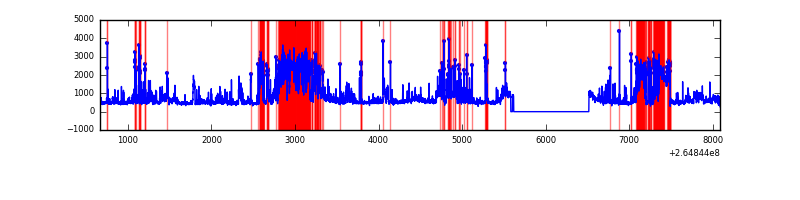 |
Top three noisy pixels from each quadrant. If the there are fewer than three noisy pixels in the level2.evt file, extra rows are filled as -1
| Pixel properties | Quadrant properties | ||||||
|---|---|---|---|---|---|---|---|
| Quadrant | DetID | PixID | Counts | Sigma | Mean | Median | Sigma |
| A | 12 | 189 | 177843 | 1066.45 | 815 | 798 | 166.0 |
| A | 8 | 15 | 18715 | 107.93 | 815 | 798 | 166.0 |
| A | 0 | 226 | 7064 | 37.74 | 815 | 798 | 166.0 |
| B | 0 | 189 | 46949 | 295.69 | 806 | 787 | 156.1 |
| B | 0 | 214 | 29090 | 181.29 | 806 | 787 | 156.1 |
| B | 0 | 229 | 25572 | 158.76 | 806 | 787 | 156.1 |
| C | 3 | 233 | 471909 | 2606.54 | 778 | 783 | 180.7 |
| C | 14 | 234 | 11165 | 57.44 | 778 | 783 | 180.7 |
| C | 13 | 61 | 5455 | 25.85 | 778 | 783 | 180.7 |
| D | 5 | 222 | 1031425 | 5823.98 | 742 | 726 | 177.0 |
| D | 13 | 122 | 857671 | 4842.18 | 742 | 726 | 177.0 |
| D | 13 | 172 | 569743 | 3215.24 | 742 | 726 | 177.0 |
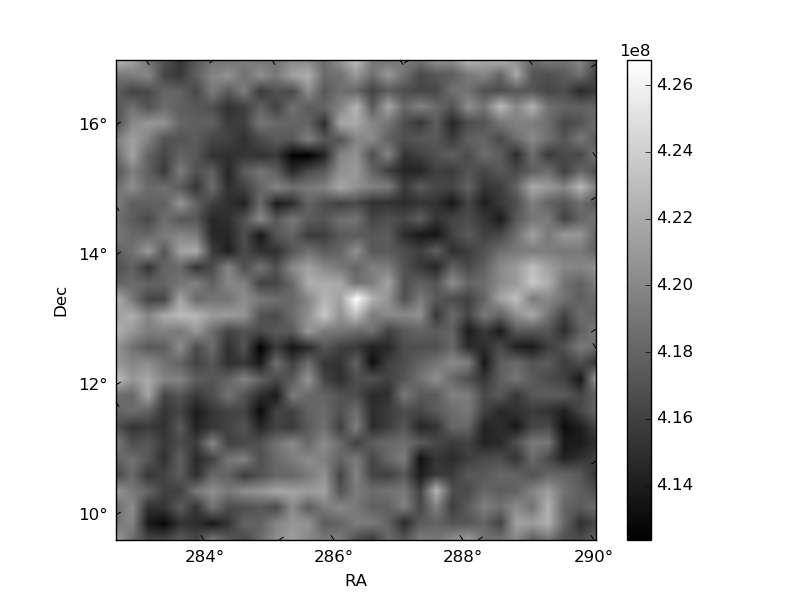
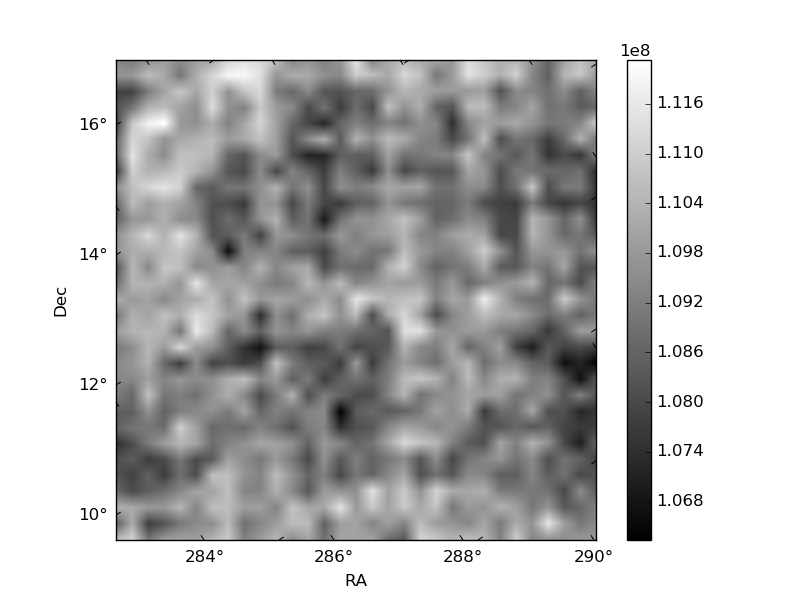
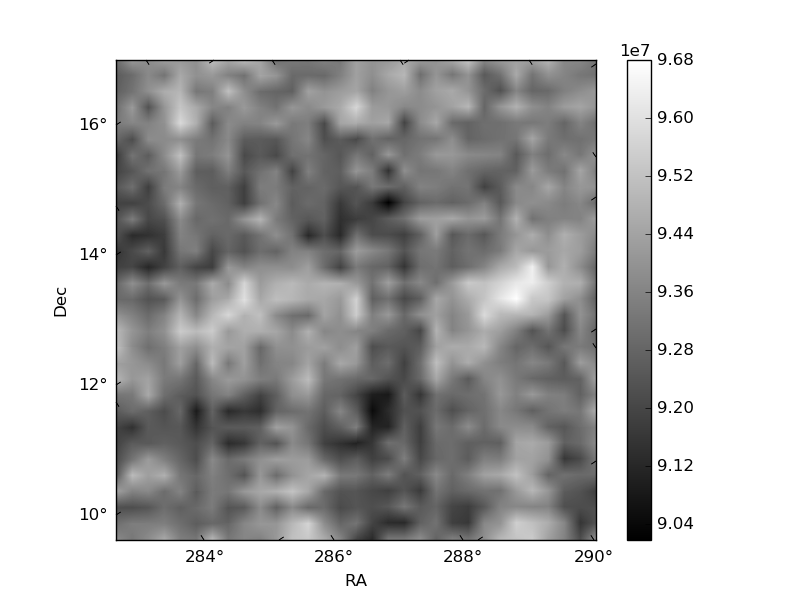
Histogram calculated using DETX and DETY for each event in the final _common_clean file
| Quadrant A | 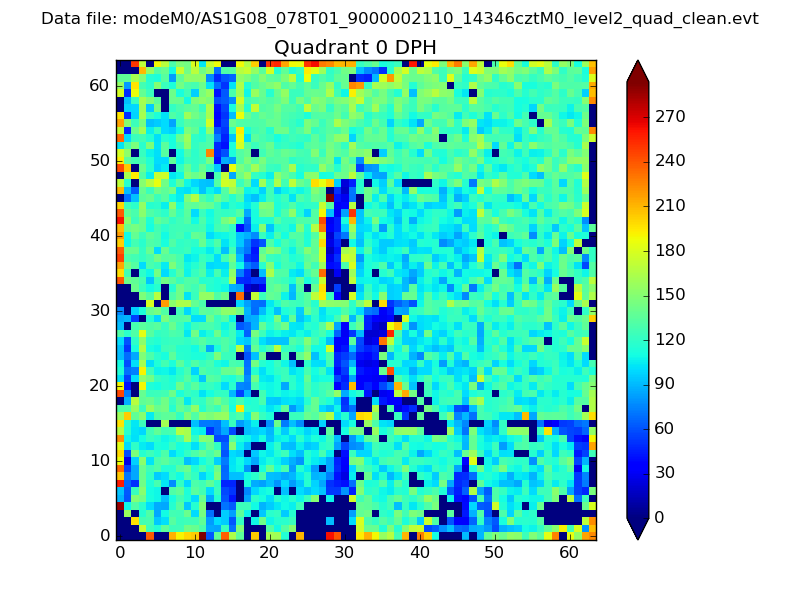 |
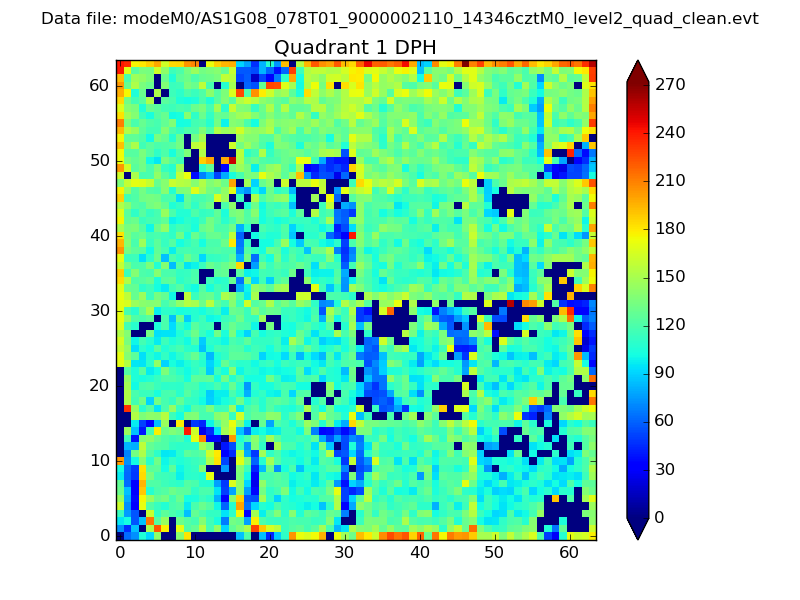 |
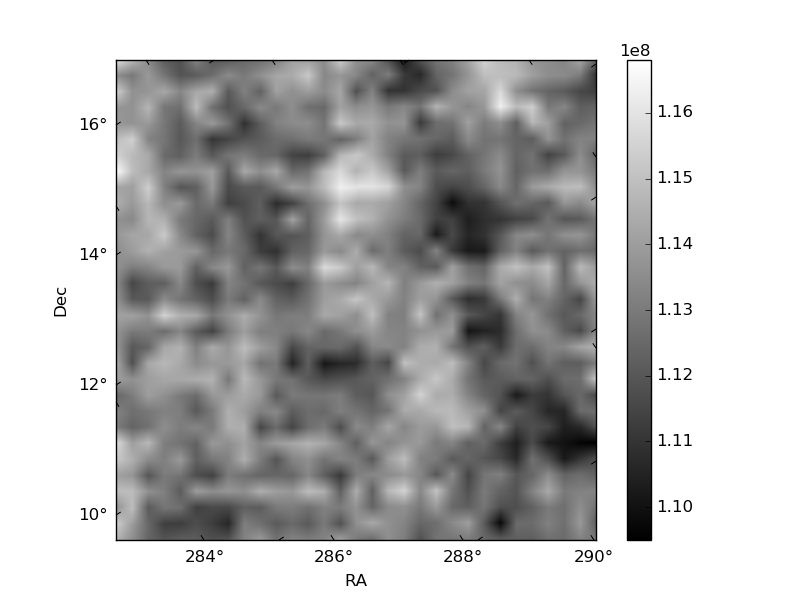
Quadrant B |
|---|---|---|---|
| Quadrant D | 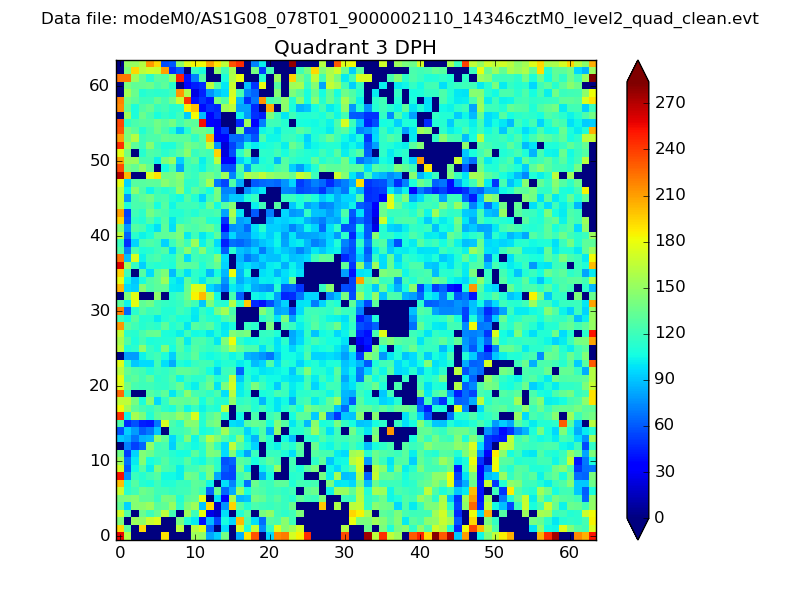 |
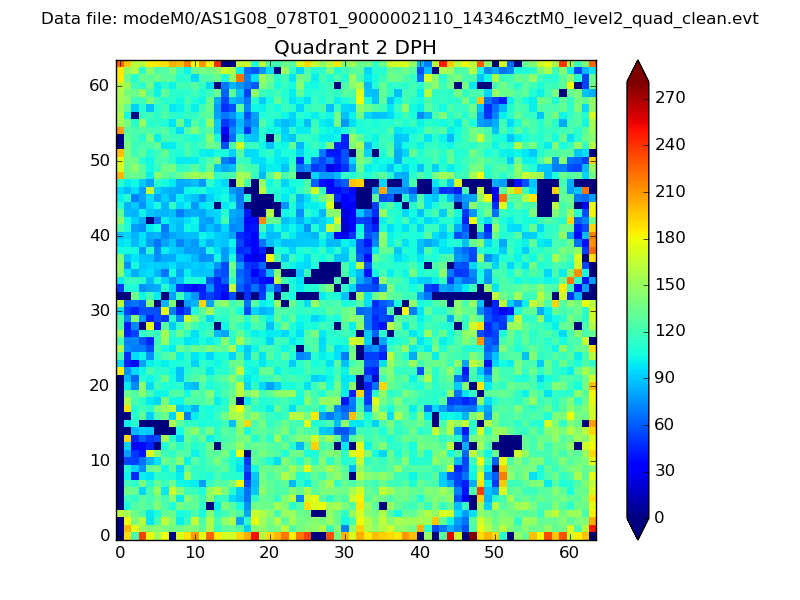 |
Quadrant C |
| Plot type | Count rate plots | Images |
|---|---|---|
| Comparison with Poisson distribution Blue bars denote a histogram of data divided into 1 sec bins. Red curve is a Poisson curve with rate = median count rate of data. |
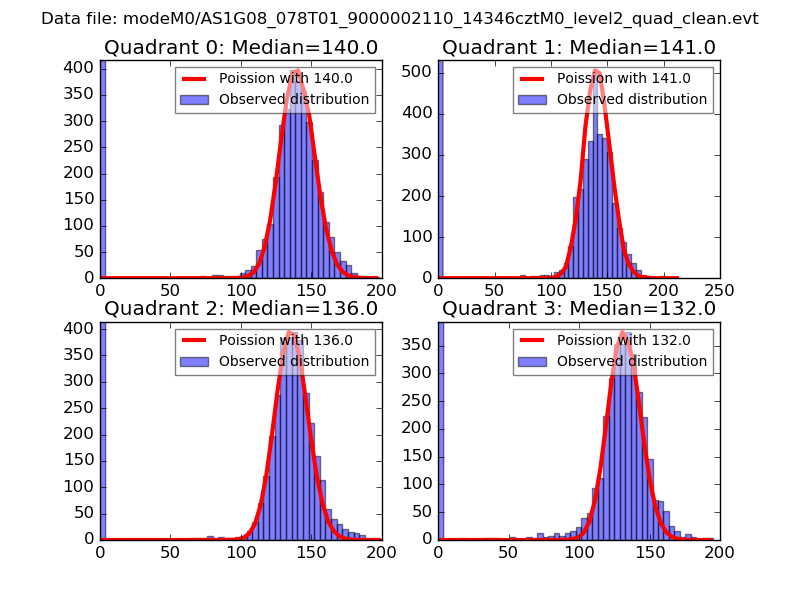 |
 |
| Quadrant-wise count rates Data is divided into 100 sec bins |
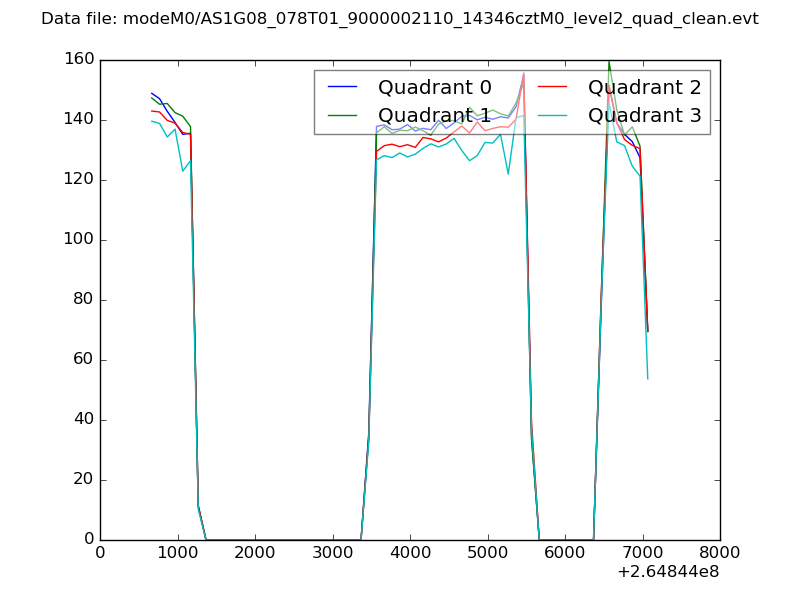 |
|
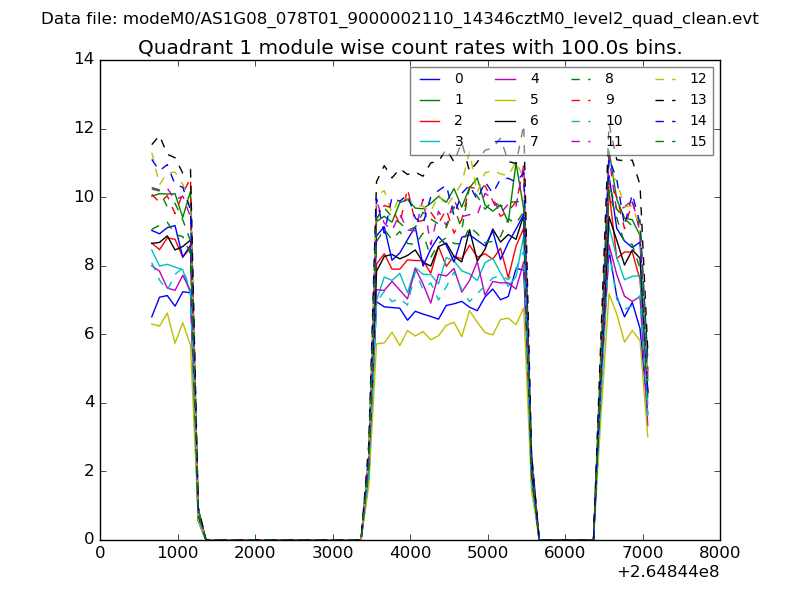
| Module-wise count rates for Quadrant A Data is divided into 100 sec bins |
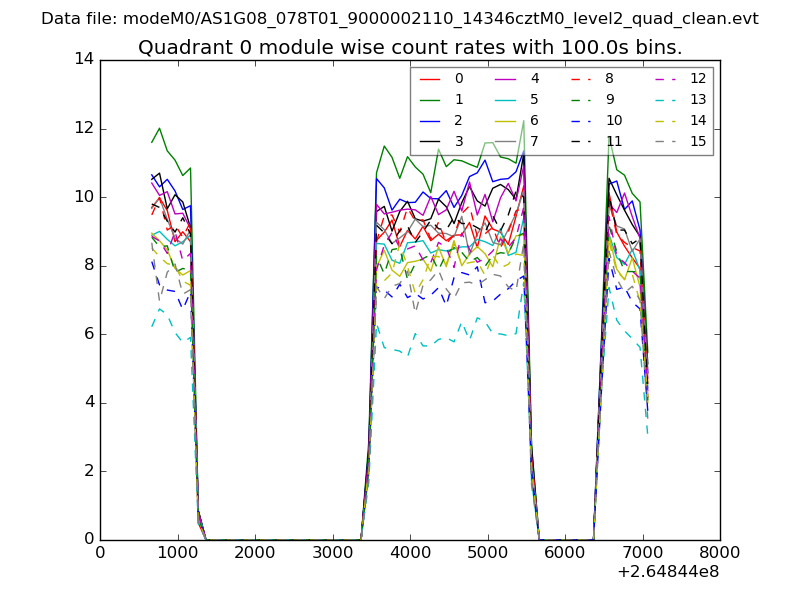 |
 |
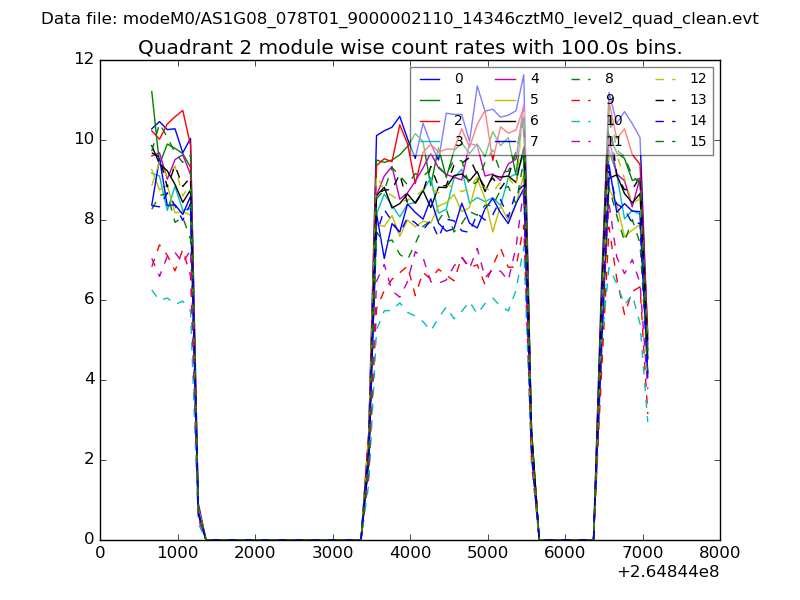
| Module-wise count rates for Quadrant B Data is divided into 100 sec bins |
 |
 |
| Module-wise count rates for Quadrant C Data is divided into 100 sec bins |
 |
 |
| Module-wise count rates for Quadrant D Data is divided into 100 sec bins |
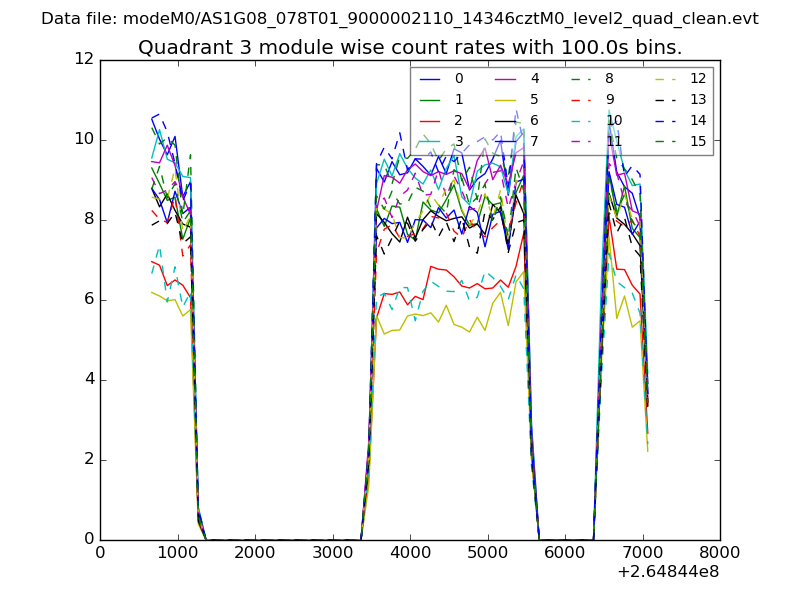 |
 |
| Parameter | Plot |
|---|---|
| CZT HV Monitor | 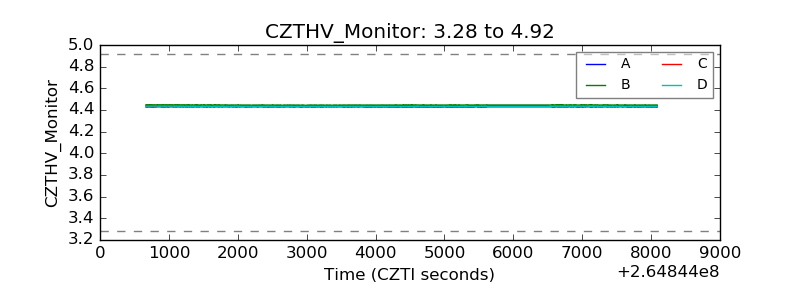 |
| D_VDD | 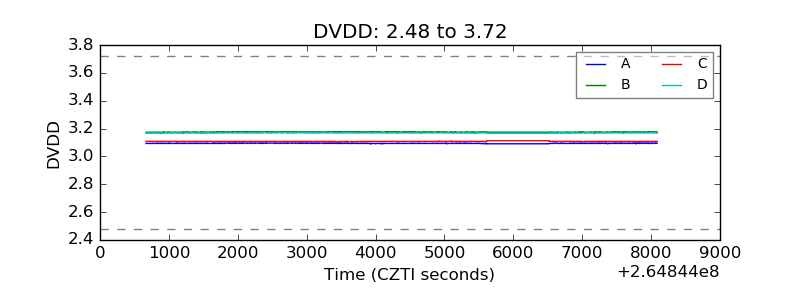 |
| Temperature 1 | 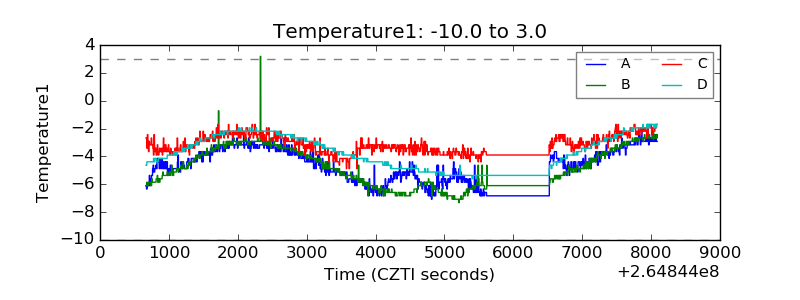 |
| Veto HV Monitor | 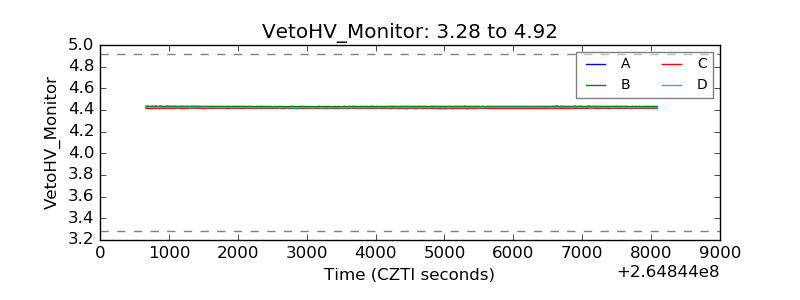 |
| Veto LLD | 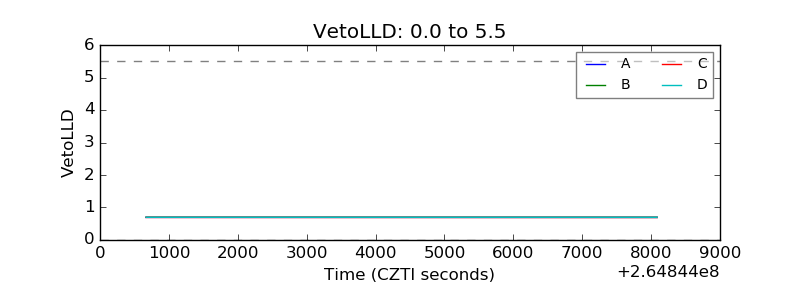 |
| Alpha Counter | 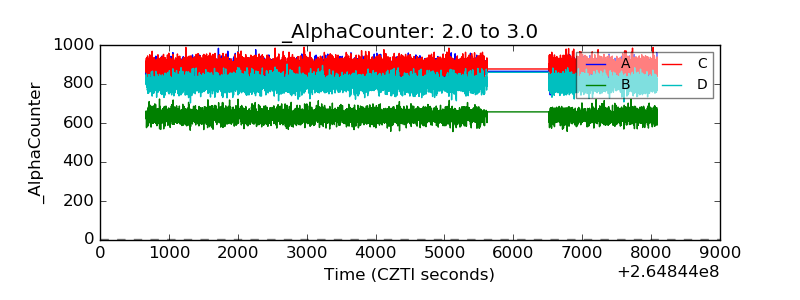 |
| _CPM_Rate | 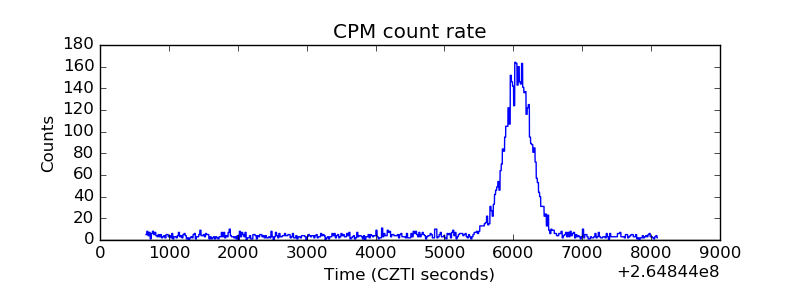 |
| CZT Counter | 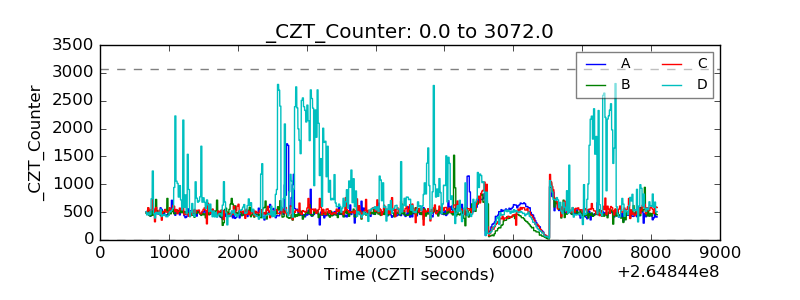 |
| +2.5 Volts monitor |  |
| +5 Volts monitor |  |
| _ROLL_ROT | 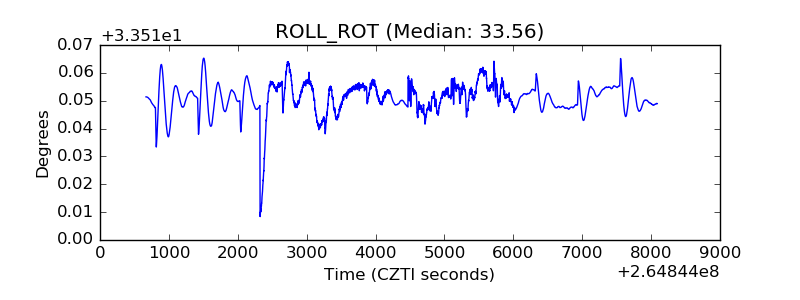 |
| _Roll_DEC | 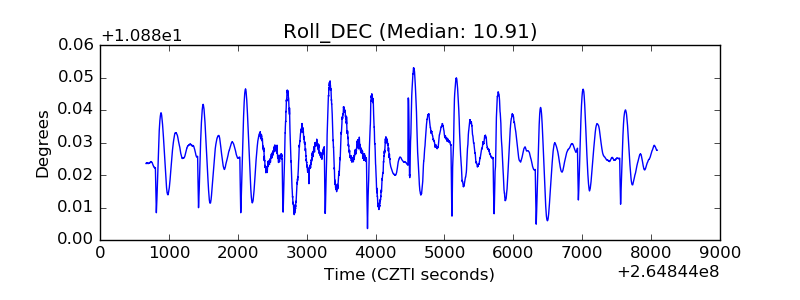 |
| _Roll_RA | 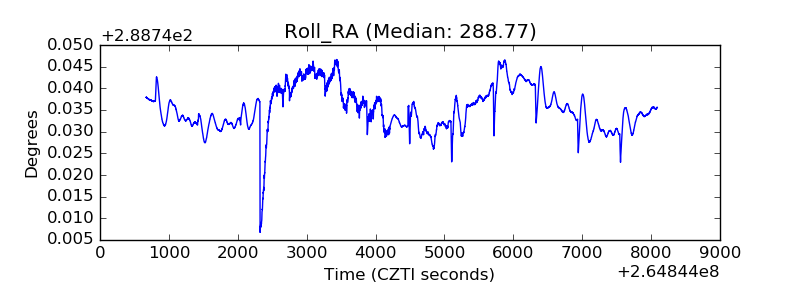 |
| Veto Counter | 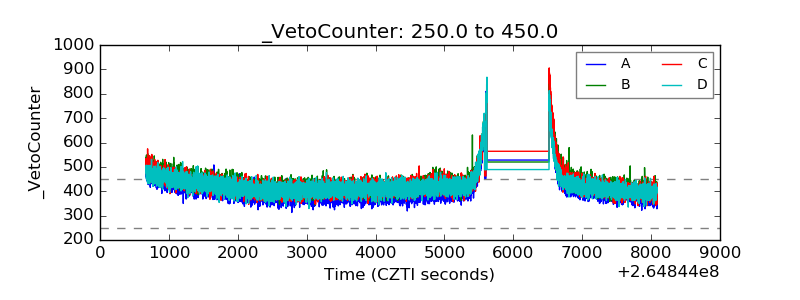 |