| Param | Original file | Final file |
|---|---|---|
| Filename | modeM0/AS1G08_078T01_9000002110_14348cztM0_level2.evt | modeM0/AS1G08_078T01_9000002110_14348cztM0_level2_quad_clean.evt |
| Size (bytes) | 232,819,200 | 23,103,360 |
| Size | 222.0 MB | 22.0 MB |
| Events in quadrant A | 1,596,102 | 119,354 |
| Events in quadrant B | 1,731,274 | 120,484 |
| Events in quadrant C | 1,685,595 | 118,373 |
| Events in quadrant D | 1,820,881 | 115,291 |
| Mode SS | |||
|---|---|---|---|
| Quadrant | BADHDUFLAG | Total packets | Discarded packets |
| A | 0 | 66 | 0 |
| B | 0 | 66 | 0 |
| C | 0 | 66 | 0 |
| D | 0 | 66 | 0 |
| Mode M0 | |||
|---|---|---|---|
| Quadrant | BADHDUFLAG | Total packets | Discarded packets |
| A | 0 | 6756 | 1 |
| B | 0 | 7137 | 1 |
| C | 0 | 6835 | 1 |
| D | 0 | 7526 | 1 |
| Mode M9 | |||
|---|---|---|---|
| Quadrant | BADHDUFLAG | Total packets | Discarded packets |
| A | 0 | 5 | 0 |
| B | 0 | 5 | 0 |
| C | 0 | 5 | 0 |
| D | 0 | 5 | 0 |
| Quadrant | Total seconds | Saturated seconds | Saturation percentage |
|---|---|---|---|
| A | 3165 | 118 | 3.728278% |
| B | 3165 | 140 | 4.423381% |
| C | 3165 | 85 | 2.685624% |
| D | 3165 | 106 | 3.349131% |
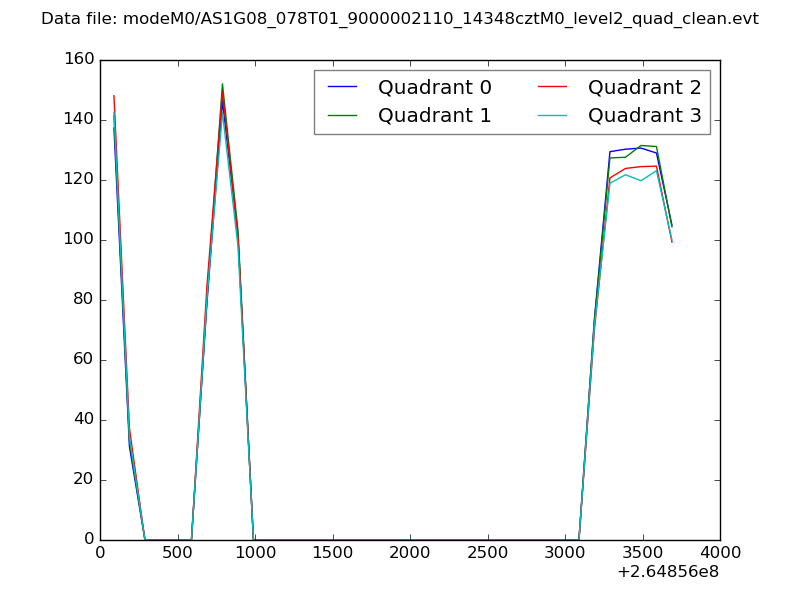
Noise dominated data is calculated using 1-second bins in cleaned event files. If a bin has >2000 counts, and if more than 50% of those come from <1% of pixels, then it is considered to be noise-dominated and hence unusable.
| Quadrant | # 1 sec bins | Bins with >0 counts | Bins with >2000 counts | High rate bins dominated by noise | Noise dominated (total time) | Noise dominated (detector-on time) | Marked lightcurve |
|---|---|---|---|---|---|---|---|
| A | 3686 | 3166 | 0 | 0 | 0.00% | 0.00% | 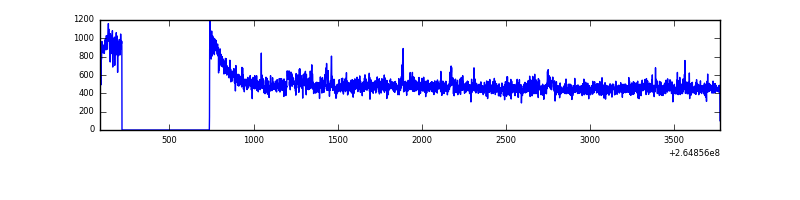 |
| B | 3686 | 3166 | 7 | 7 | 0.19% | 0.22% | 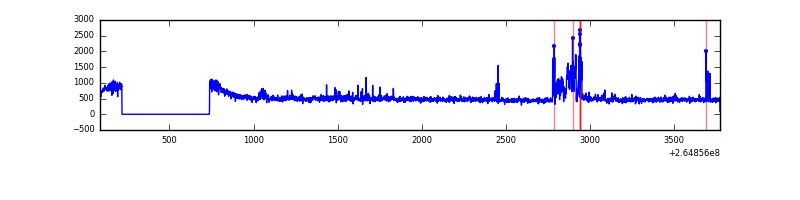 |
| C | 3686 | 3167 | 0 | 0 | 0.00% | 0.00% | 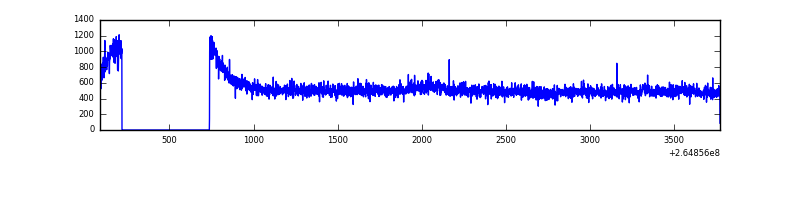 |
| D | 3686 | 3166 | 24 | 24 | 0.65% | 0.76% |  |
Top three noisy pixels from each quadrant. If the there are fewer than three noisy pixels in the level2.evt file, extra rows are filled as -1
| Pixel properties | Quadrant properties | ||||||
|---|---|---|---|---|---|---|---|
| Quadrant | DetID | PixID | Counts | Sigma | Mean | Median | Sigma |
| A | 12 | 189 | 43061 | 504.17 | 403 | 395 | 84.6 |
| A | 0 | 226 | 3539 | 37.15 | 403 | 395 | 84.6 |
| A | 12 | 194 | 3079 | 31.72 | 403 | 395 | 84.6 |
| B | 0 | 229 | 128777 | 1628.6 | 396 | 387 | 78.8 |
| B | 0 | 189 | 28666 | 358.71 | 396 | 387 | 78.8 |
| B | 0 | 214 | 13010 | 160.12 | 396 | 387 | 78.8 |
| C | 3 | 233 | 189646 | 2059.2 | 383 | 384 | 91.9 |
| C | 13 | 61 | 2746 | 25.7 | 383 | 384 | 91.9 |
| C | 3 | 202 | 918 | 5.81 | 383 | 384 | 91.9 |
| D | 2 | 120 | 130453 | 1363.87 | 388 | 378 | 95.4 |
| D | 5 | 222 | 112814 | 1178.92 | 388 | 378 | 95.4 |
| D | 10 | 172 | 41068 | 426.64 | 388 | 378 | 95.4 |
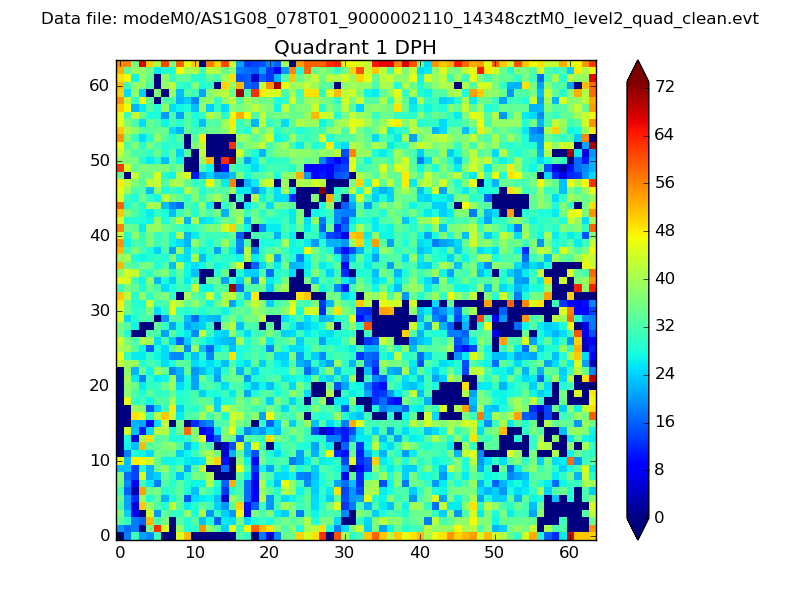
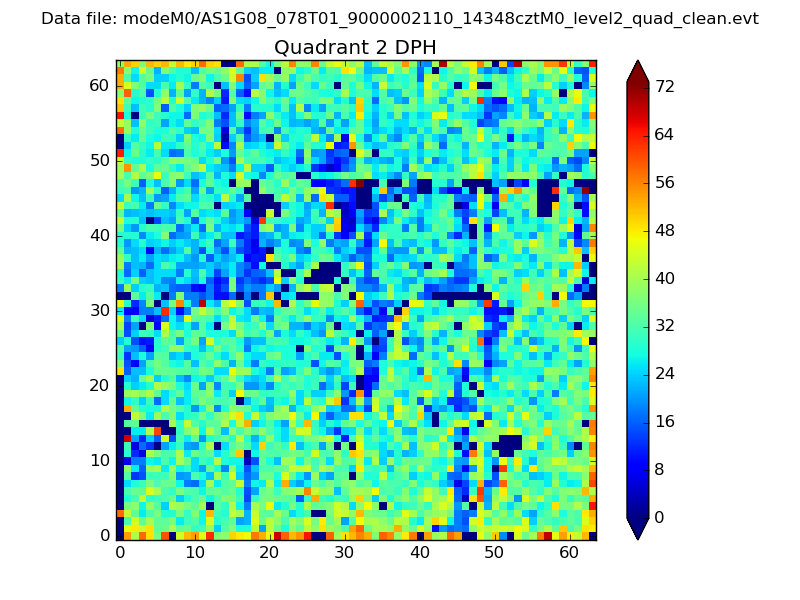
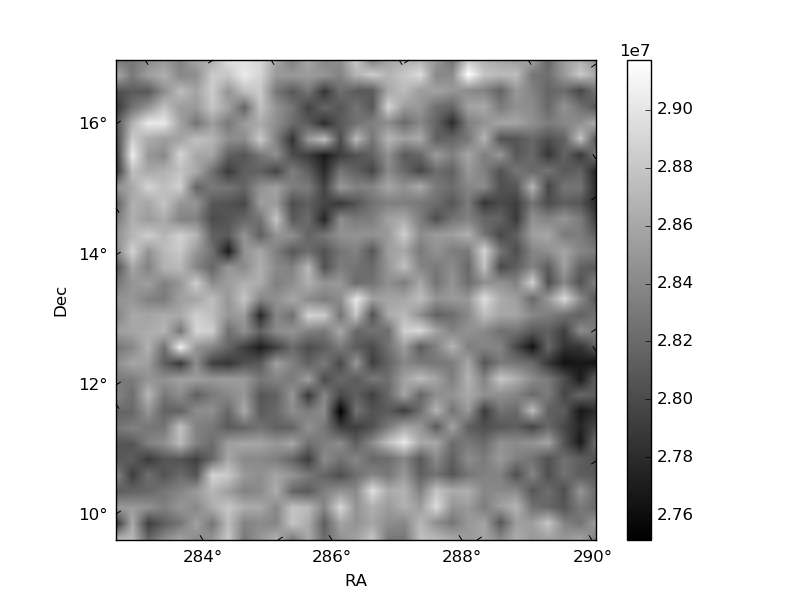
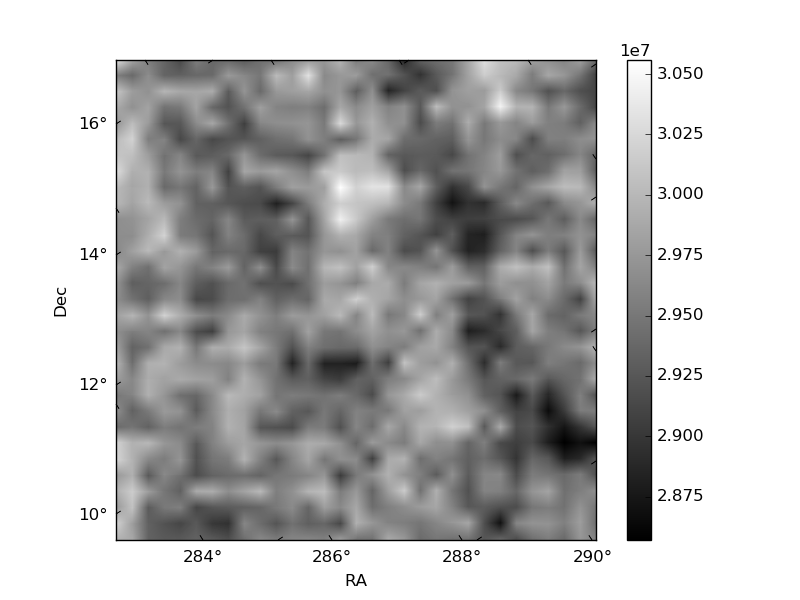
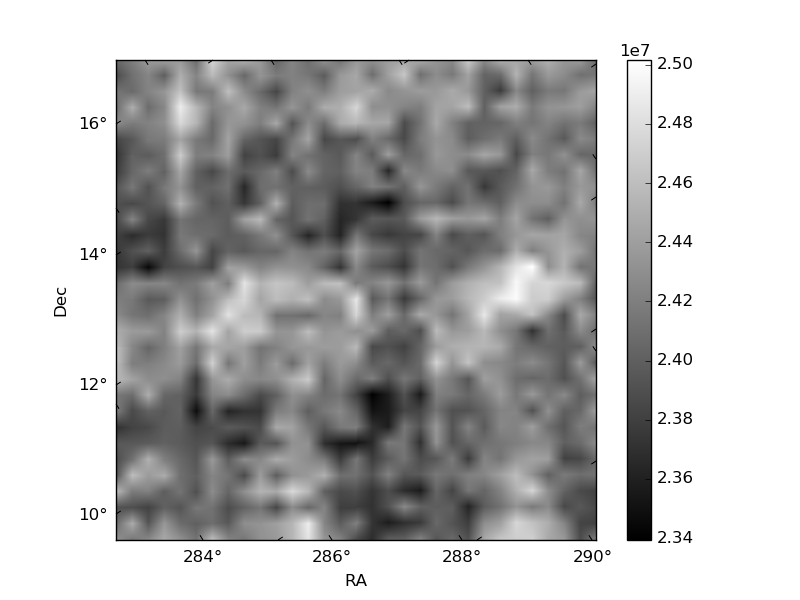
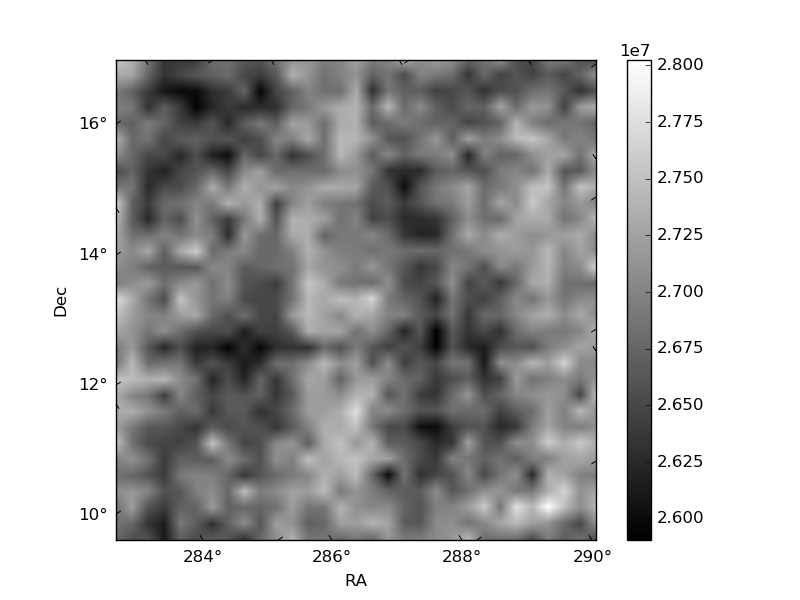
Histogram calculated using DETX and DETY for each event in the final _common_clean file
| Quadrant A | 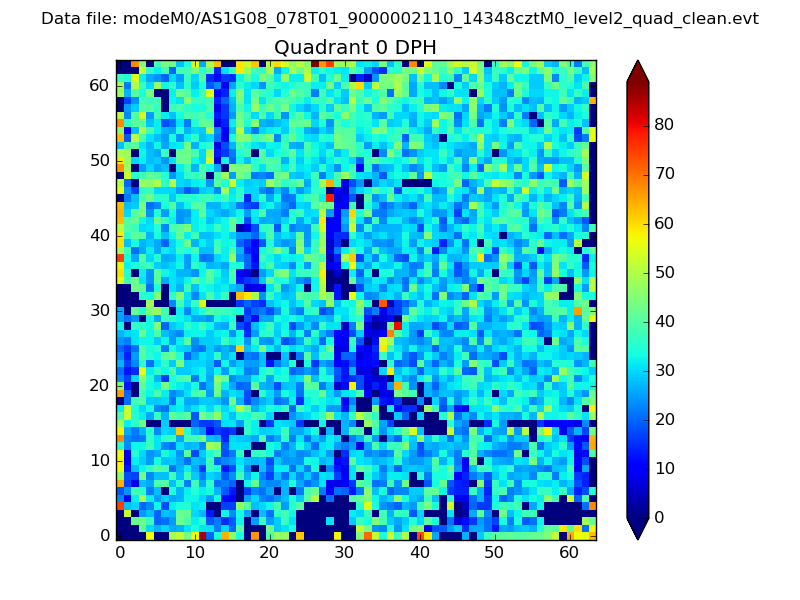 |
 |
Quadrant B |
|---|---|---|---|
| Quadrant D | 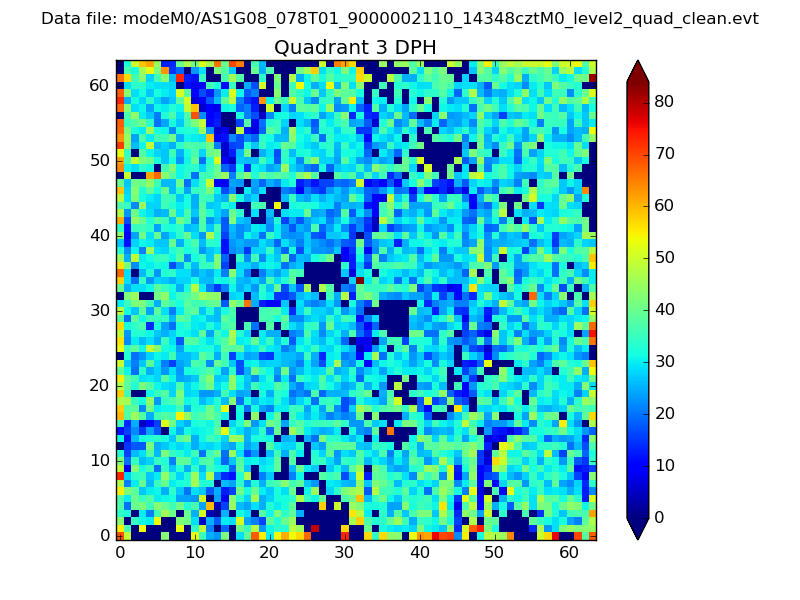 |
 |
Quadrant C |
| Plot type | Count rate plots | Images |
|---|---|---|
| Comparison with Poisson distribution Blue bars denote a histogram of data divided into 1 sec bins. Red curve is a Poisson curve with rate = median count rate of data. |
 |
 |
| Quadrant-wise count rates Data is divided into 100 sec bins |
 |
|
| Module-wise count rates for Quadrant A Data is divided into 100 sec bins |
 |
 |
| Module-wise count rates for Quadrant B Data is divided into 100 sec bins |
 |
 |
| Module-wise count rates for Quadrant C Data is divided into 100 sec bins |
 |
 |
| Module-wise count rates for Quadrant D Data is divided into 100 sec bins |
 |
 |
| Parameter | Plot |
|---|---|
| CZT HV Monitor |  |
| D_VDD | 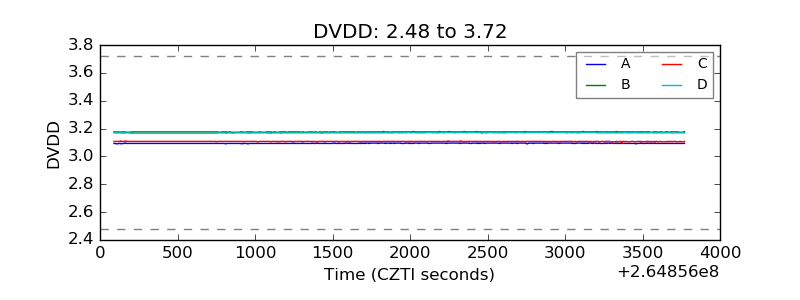 |
| Temperature 1 | 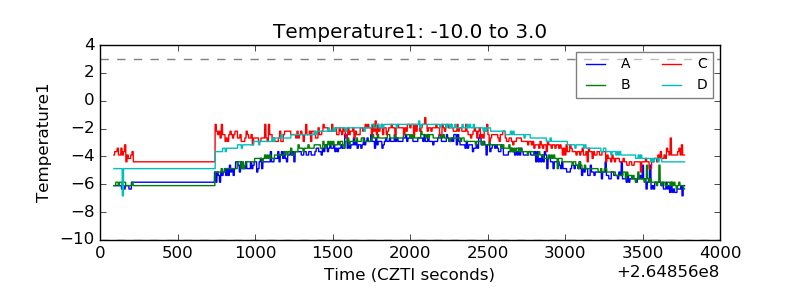 |
| Veto HV Monitor | 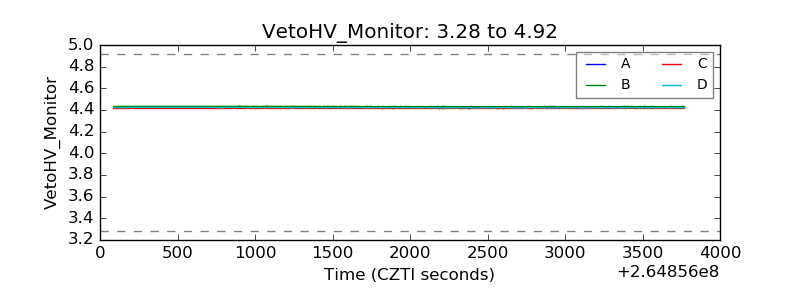 |
| Veto LLD |  |
| Alpha Counter | 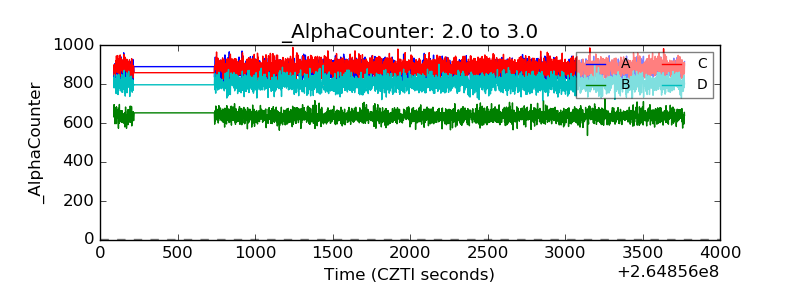 |
| _CPM_Rate | 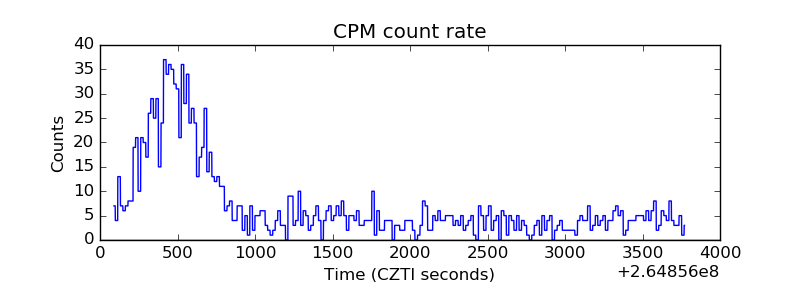 |
| CZT Counter | 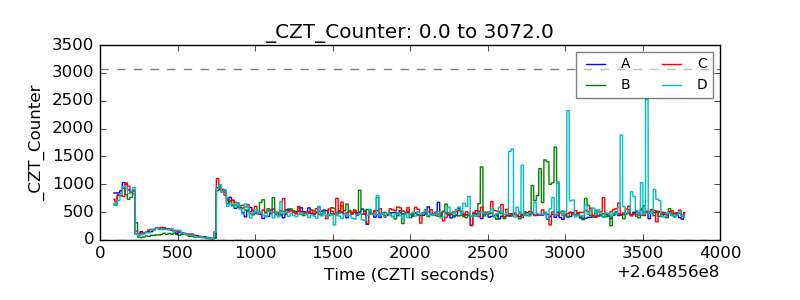 |
| +2.5 Volts monitor |  |
| +5 Volts monitor | 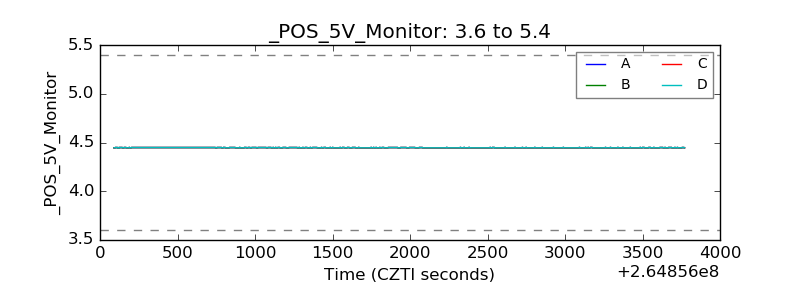 |
| _ROLL_ROT |  |
| _Roll_DEC | 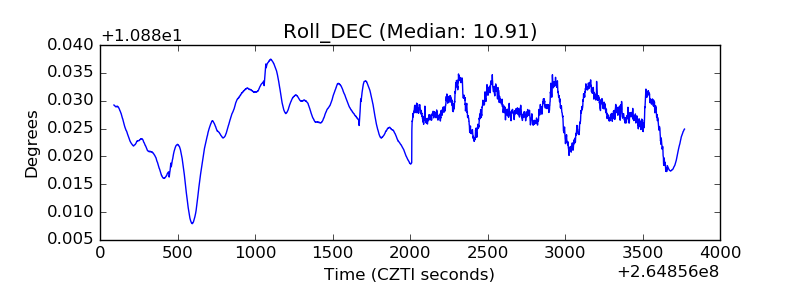 |
| _Roll_RA | 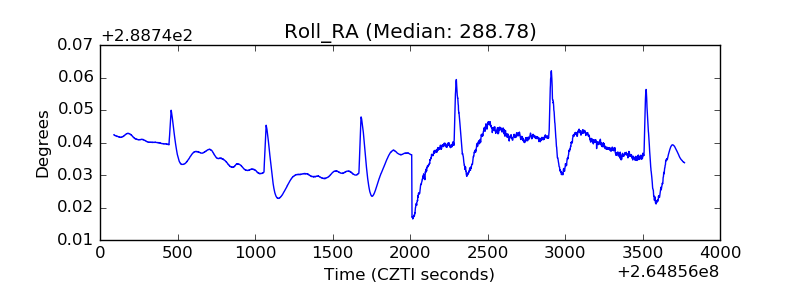 |
| Veto Counter |  |