| Param | Original file | Final file |
|---|---|---|
| Filename | modeM0/AS1A04_048T01_9000002114cztM0_level2.fits | modeM0/AS1A04_048T01_9000002114cztM0_level2_quad_clean.evt |
| Size (bytes) | 572,736,960 | 529,876,800 |
| Size | 546.2 MB | 505.3 MB |
| Events in quadrant A | 3,517,378 | 3,174,432 |
| Events in quadrant B | 3,363,594 | 3,136,826 |
| Events in quadrant C | 3,458,200 | 2,979,198 |
| Events in quadrant D | 2,988,560 | 2,739,695 |
| Mode SS | |||
|---|---|---|---|
| Quadrant | BADHDUFLAG | Total packets | Discarded packets |
| A | 0 | 1196 | 0 |
| B | 0 | 1196 | 0 |
| C | 0 | 1196 | 0 |
| D | 0 | 1196 | 0 |
| Mode M0 | |||
|---|---|---|---|
| Quadrant | BADHDUFLAG | Total packets | Discarded packets |
| A | 0 | 124237 | 0 |
| B | 0 | 134542 | 0 |
| C | 0 | 138847 | 0 |
| D | 0 | 151762 | 0 |
| Mode M9 | |||
|---|---|---|---|
| Quadrant | BADHDUFLAG | Total packets | Discarded packets |
| A | 0 | 97 | 0 |
| B | 0 | 97 | 0 |
| C | 0 | 97 | 0 |
| D | 0 | 97 | 0 |
| Quadrant | Total seconds | Saturated seconds | Saturation percentage |
|---|---|---|---|
| A | 58547 | 783 | 1.337387% |
| B | 58547 | 1727 | 2.949767% |
| C | 58547 | 680 | 1.161460% |
| D | 58547 | 1965 | 3.356278% |
Noise dominated data is calculated using 1-second bins in cleaned event files. If a bin has >2000 counts, and if more than 50% of those come from <1% of pixels, then it is considered to be noise-dominated and hence unusable.
| Quadrant | # 1 sec bins | Bins with >0 counts | Bins with >2000 counts | High rate bins dominated by noise | Noise dominated (total time) | Noise dominated (detector-on time) | Marked lightcurve |
|---|---|---|---|---|---|---|---|
| A | 68383 | 58542 | 0 | 0 | 0.00% | 0.00% | 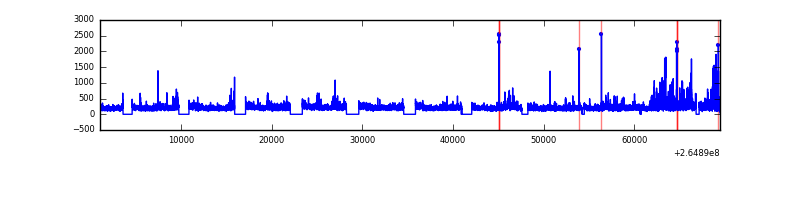 |
| B | 68383 | 58529 | 0 | 0 | 0.00% | 0.00% |  |
| C | 68383 | 58542 | 0 | 0 | 0.00% | 0.00% |  |
| D | 68383 | 58527 | 0 | 0 | 0.00% | 0.00% |  |
Top three noisy pixels from each quadrant. If the there are fewer than three noisy pixels in the level2.evt file, extra rows are filled as -1
| Pixel properties | Quadrant properties | ||||||
|---|---|---|---|---|---|---|---|
| Quadrant | DetID | PixID | Counts | Sigma | Mean | Median | Sigma |
| A | 0 | 29 | 3399 | 11.15 | 914 | 856 | 228.1 |
| A | 7 | 110 | 2861 | 8.79 | 914 | 856 | 228.1 |
| A | 9 | 19 | 2631 | 7.78 | 914 | 856 | 228.1 |
| B | 2 | 9 | 2898 | 12.0 | 887 | 849 | 170.7 |
| B | 14 | 254 | 2275 | 8.35 | 887 | 849 | 170.7 |
| B | 2 | 8 | 2189 | 7.85 | 887 | 849 | 170.7 |
| C | 12 | 241 | 2528 | 7.17 | 914 | 852 | 233.8 |
| C | 2 | 191 | 2374 | 6.51 | 914 | 852 | 233.8 |
| C | 3 | 126 | 2349 | 6.4 | 914 | 852 | 233.8 |
| D | 3 | 14 | 2210 | 6.31 | 852 | 777 | 227.2 |
| D | 6 | 231 | 2157 | 6.08 | 852 | 777 | 227.2 |
| D | 15 | 46 | 2080 | 5.74 | 852 | 777 | 227.2 |
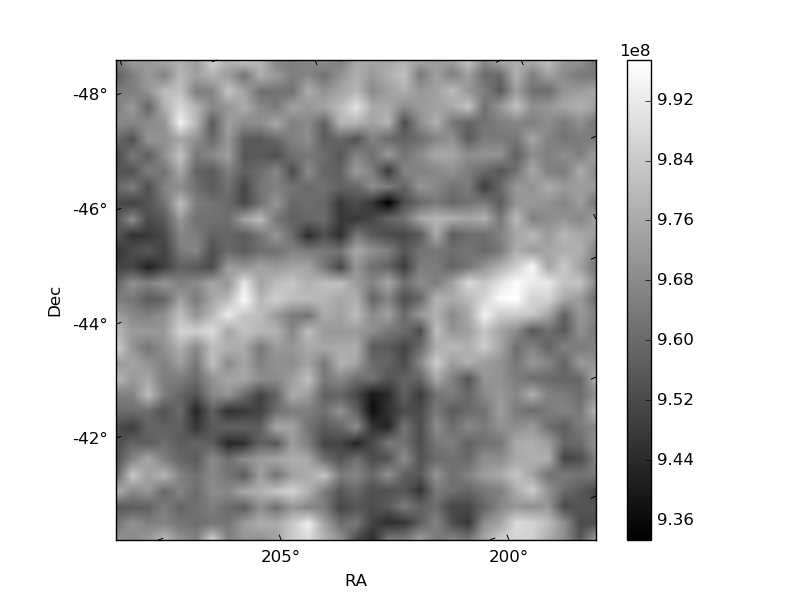
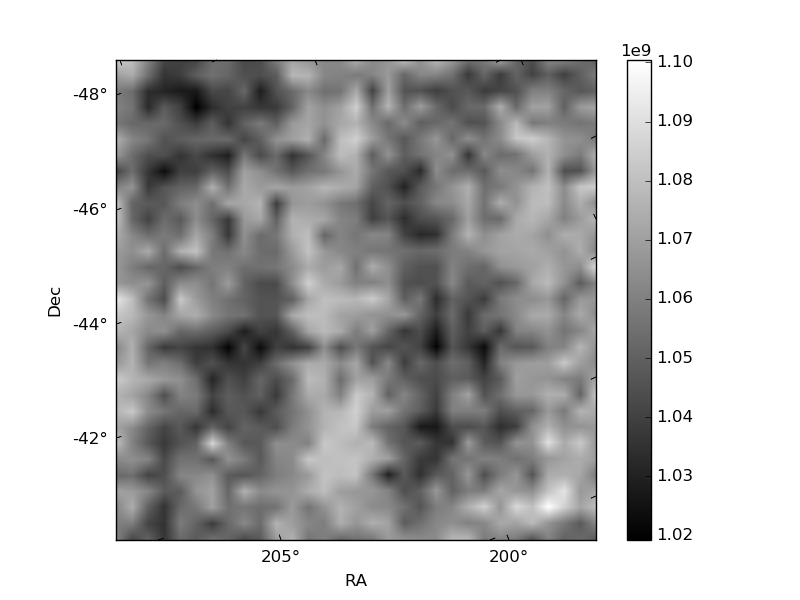
Histogram calculated using DETX and DETY for each event in the final _common_clean file
| Quadrant A |  |
 |
Quadrant B |
|---|---|---|---|
| Quadrant D | 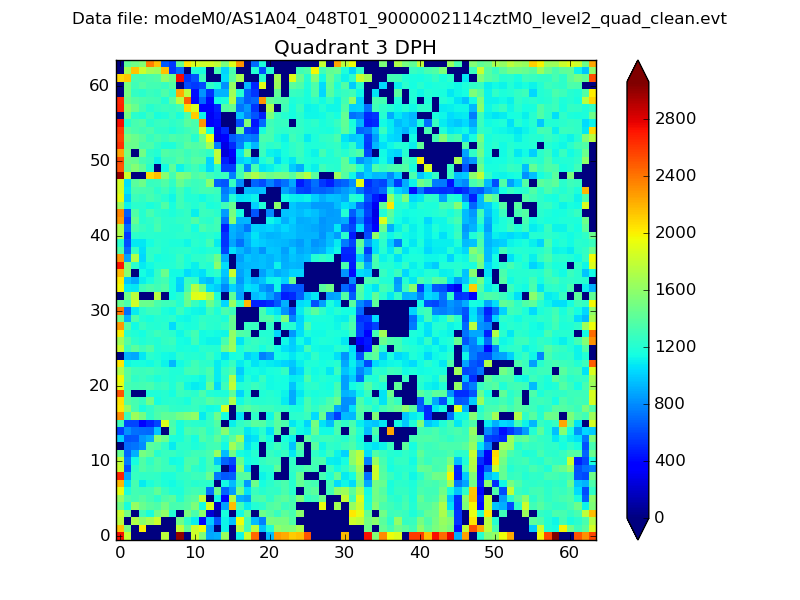 |
 |
Quadrant C |
| Plot type | Count rate plots | Images |
|---|---|---|
| Comparison with Poisson distribution Blue bars denote a histogram of data divided into 1 sec bins. Red curve is a Poisson curve with rate = median count rate of data. |
 |
 |
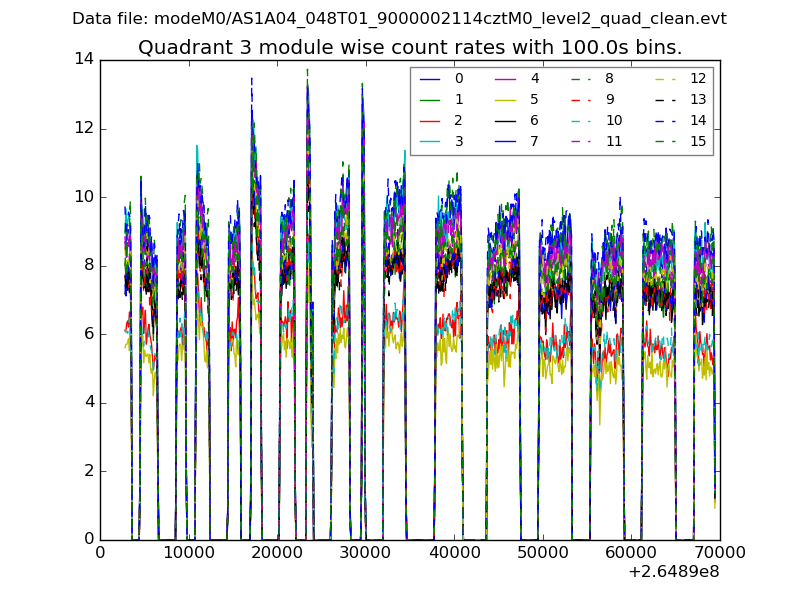
| Quadrant-wise count rates Data is divided into 100 sec bins |
 |
|
| Module-wise count rates for Quadrant A Data is divided into 100 sec bins |
 |
 |
| Module-wise count rates for Quadrant B Data is divided into 100 sec bins |
 |
 |
| Module-wise count rates for Quadrant C Data is divided into 100 sec bins |
 |
 |
| Module-wise count rates for Quadrant D Data is divided into 100 sec bins |
 |
 |
| Parameter | Plot |
|---|---|
| CZT HV Monitor | 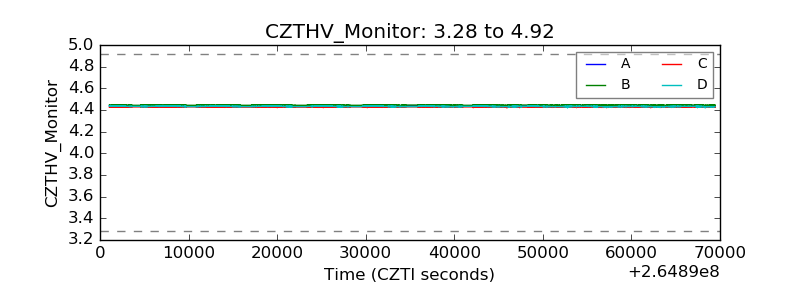 |
| D_VDD | 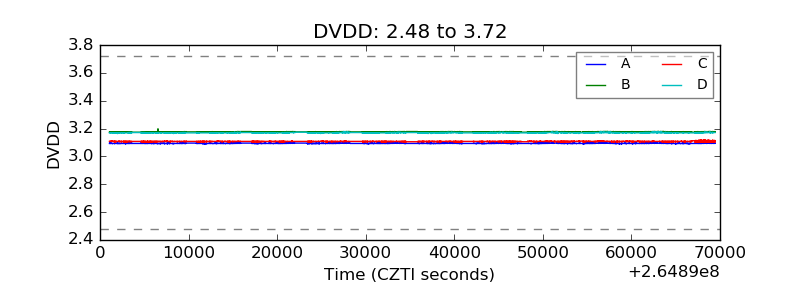 |
| Temperature 1 |  |
| Veto HV Monitor |  |
| Veto LLD | 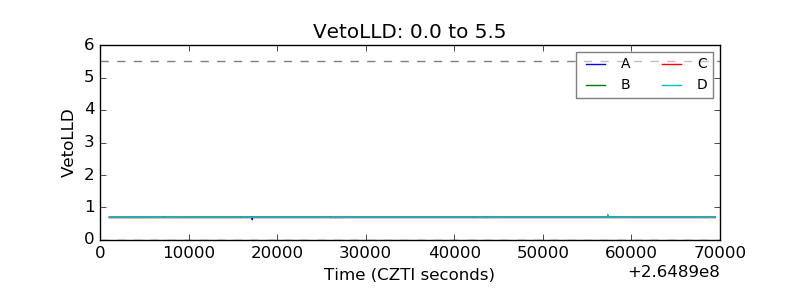 |
| Alpha Counter |  |
| _CPM_Rate |  |
| CZT Counter |  |
| +2.5 Volts monitor |  |
| +5 Volts monitor |  |
| _ROLL_ROT | 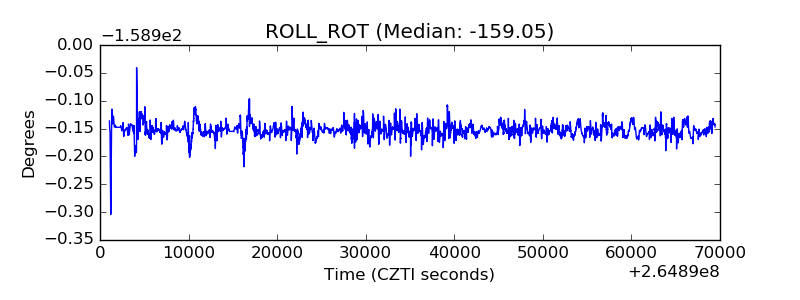 |
| _Roll_DEC |  |
| _Roll_RA | 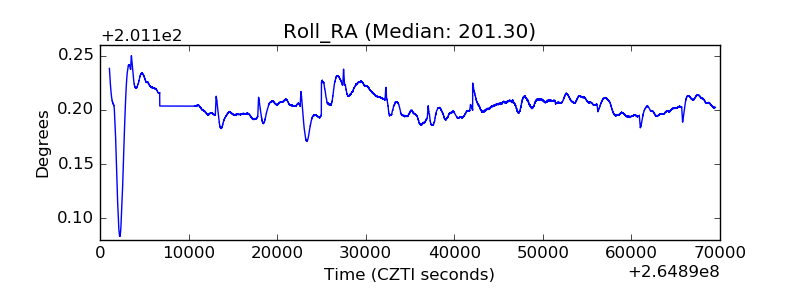 |
| Veto Counter |  |