| Param | Original file | Final file |
|---|---|---|
| Filename | modeM0/AS1A04_048T01_9000002114_14353cztM0_level2.evt | modeM0/AS1A04_048T01_9000002114_14353cztM0_level2_quad_clean.evt |
| Size (bytes) | 307,224,000 | 47,113,920 |
| Size | 293.0 MB | 44.9 MB |
| Events in quadrant A | 1,875,756 | 292,992 |
| Events in quadrant B | 2,431,219 | 293,913 |
| Events in quadrant C | 2,251,992 | 285,629 |
| Events in quadrant D | 2,476,056 | 275,194 |
| Mode SS | |||
|---|---|---|---|
| Quadrant | BADHDUFLAG | Total packets | Discarded packets |
| A | 0 | 82 | 0 |
| B | 0 | 82 | 0 |
| C | 0 | 82 | 0 |
| D | 0 | 82 | 0 |
| Mode M0 | |||
|---|---|---|---|
| Quadrant | BADHDUFLAG | Total packets | Discarded packets |
| A | 0 | 8034 | 2 |
| B | 0 | 9648 | 1 |
| C | 0 | 9196 | 1 |
| D | 0 | 9910 | 1 |
| Mode M9 | |||
|---|---|---|---|
| Quadrant | BADHDUFLAG | Total packets | Discarded packets |
| A | 0 | 10 | 0 |
| B | 0 | 10 | 0 |
| C | 0 | 10 | 0 |
| D | 0 | 10 | 0 |
| Quadrant | Total seconds | Saturated seconds | Saturation percentage |
|---|---|---|---|
| A | 3942 | 11 | 0.279046% |
| B | 3942 | 143 | 3.627600% |
| C | 3942 | 9 | 0.228311% |
| D | 3942 | 48 | 1.217656% |
Noise dominated data is calculated using 1-second bins in cleaned event files. If a bin has >2000 counts, and if more than 50% of those come from <1% of pixels, then it is considered to be noise-dominated and hence unusable.
| Quadrant | # 1 sec bins | Bins with >0 counts | Bins with >2000 counts | High rate bins dominated by noise | Noise dominated (total time) | Noise dominated (detector-on time) | Marked lightcurve |
|---|---|---|---|---|---|---|---|
| A | 4948 | 3944 | 0 | 0 | 0.00% | 0.00% | 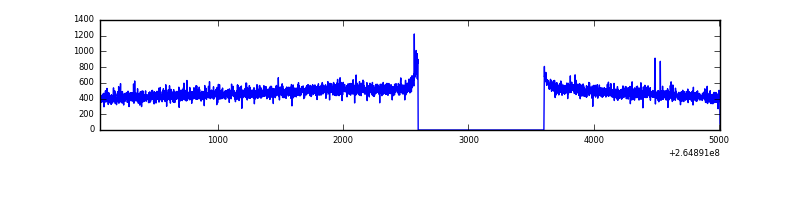 |
| B | 4948 | 3943 | 100 | 100 | 2.02% | 2.54% | 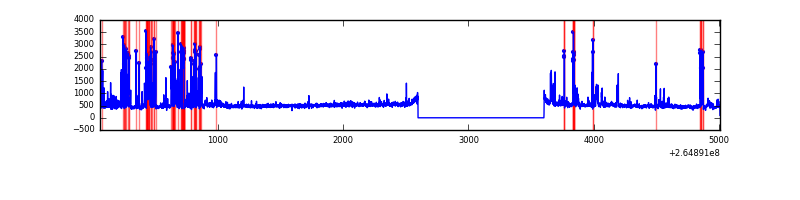 |
| C | 4948 | 3944 | 2 | 2 | 0.04% | 0.05% | 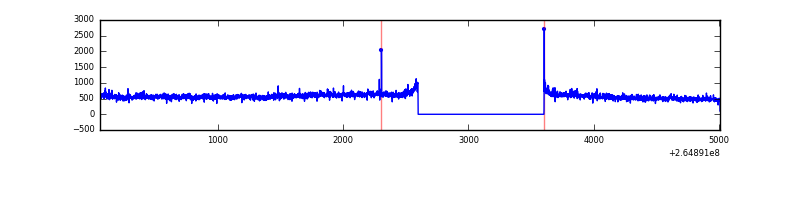 |
| D | 4948 | 3944 | 41 | 41 | 0.83% | 1.04% | 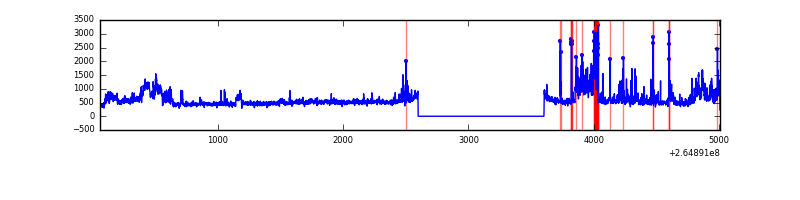 |
Top three noisy pixels from each quadrant. If the there are fewer than three noisy pixels in the level2.evt file, extra rows are filled as -1
| Pixel properties | Quadrant properties | ||||||
|---|---|---|---|---|---|---|---|
| Quadrant | DetID | PixID | Counts | Sigma | Mean | Median | Sigma |
| A | 12 | 189 | 10162 | 96.31 | 483 | 473 | 100.6 |
| A | 8 | 15 | 5597 | 50.93 | 483 | 473 | 100.6 |
| A | 0 | 226 | 4202 | 37.07 | 483 | 473 | 100.6 |
| B | 10 | 16 | 394947 | 4233.41 | 478 | 465 | 93.2 |
| B | 0 | 229 | 95956 | 1024.77 | 478 | 465 | 93.2 |
| B | 0 | 245 | 20999 | 220.36 | 478 | 465 | 93.2 |
| C | 3 | 233 | 423698 | 3859.41 | 466 | 466 | 109.7 |
| C | 14 | 234 | 4133 | 33.44 | 466 | 466 | 109.7 |
| C | 13 | 61 | 3304 | 25.88 | 466 | 466 | 109.7 |
| D | 12 | 110 | 225049 | 2014.24 | 464 | 450 | 111.5 |
| D | 5 | 222 | 224389 | 2008.33 | 464 | 450 | 111.5 |
| D | 13 | 122 | 84811 | 756.56 | 464 | 450 | 111.5 |
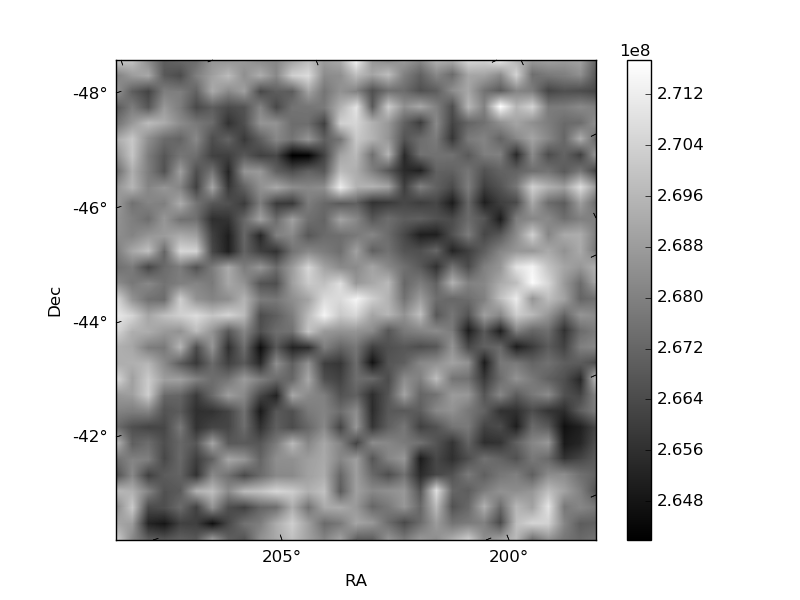
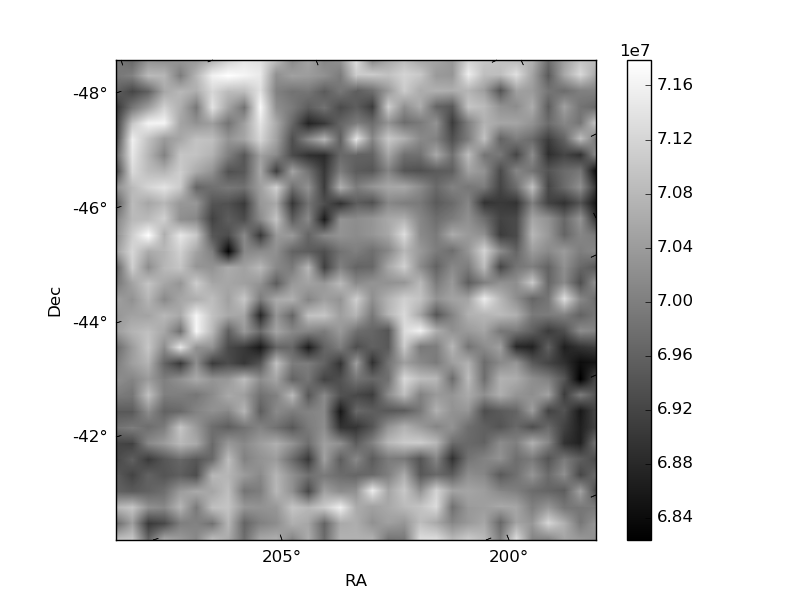
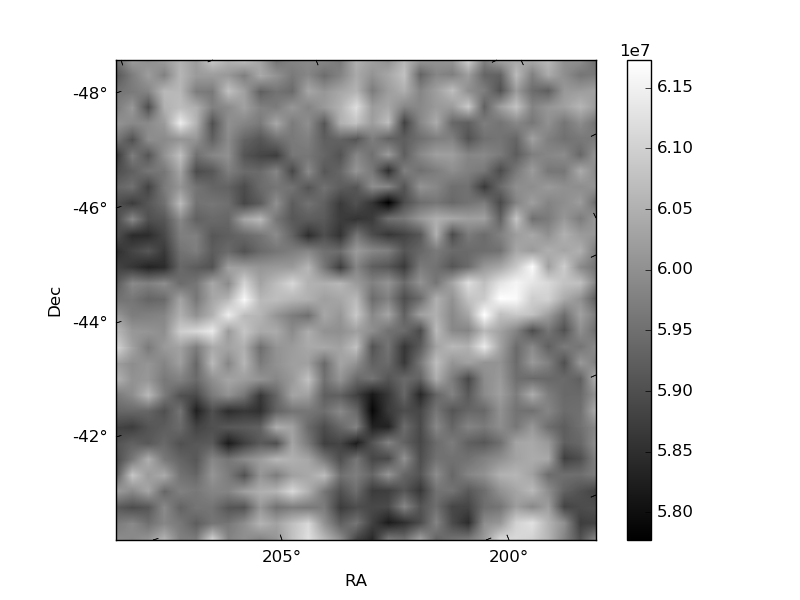
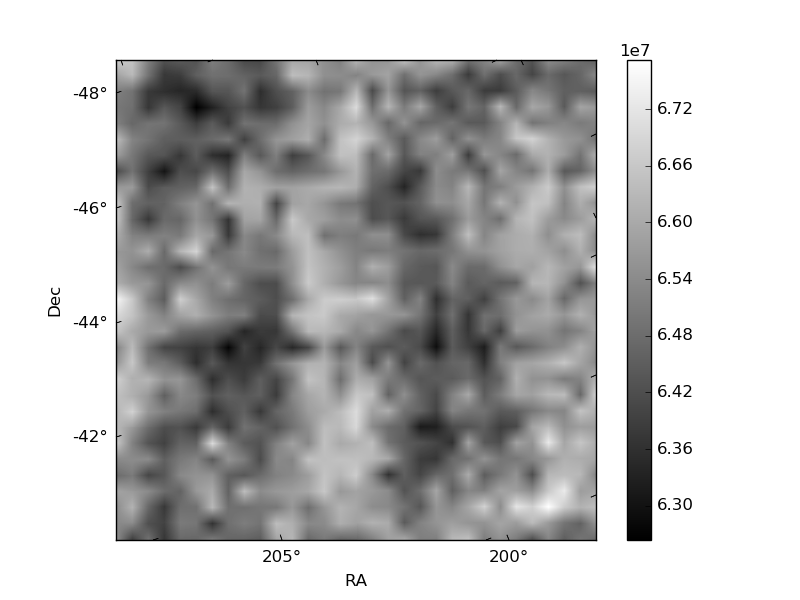
Histogram calculated using DETX and DETY for each event in the final _common_clean file
| Quadrant A | 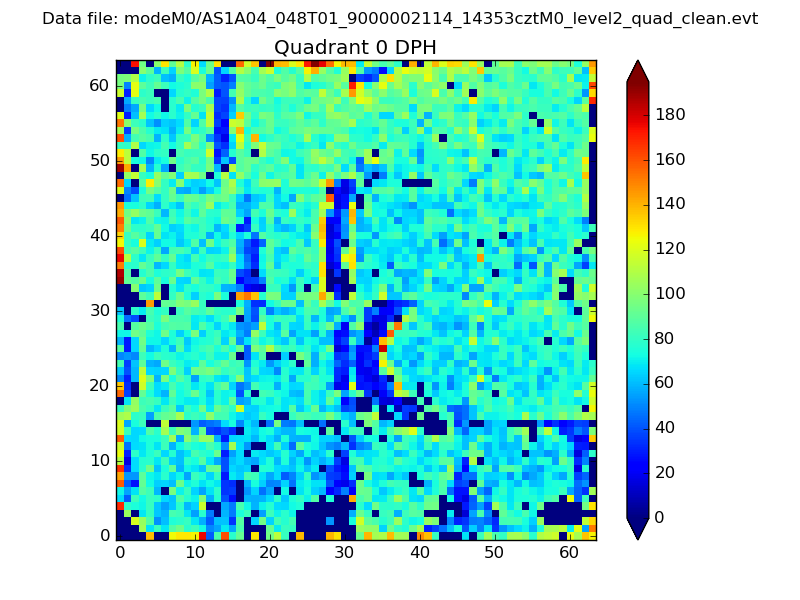 |
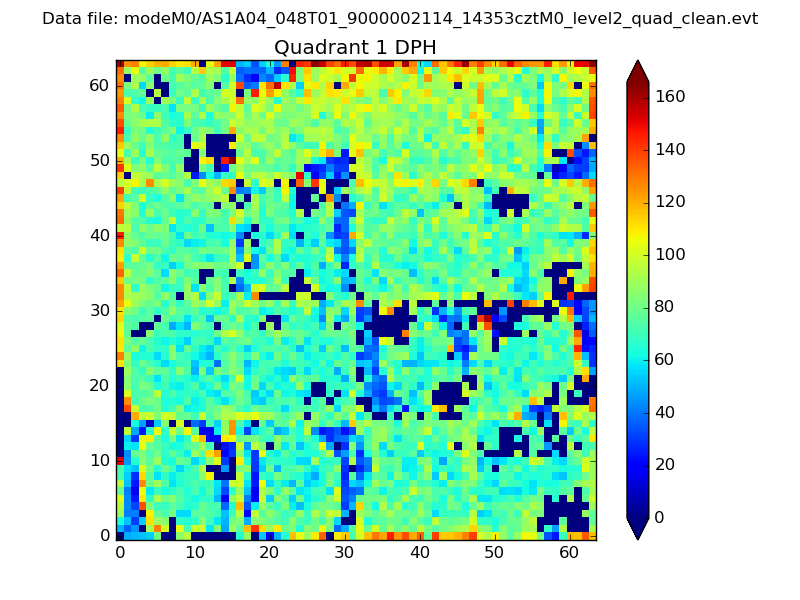 |
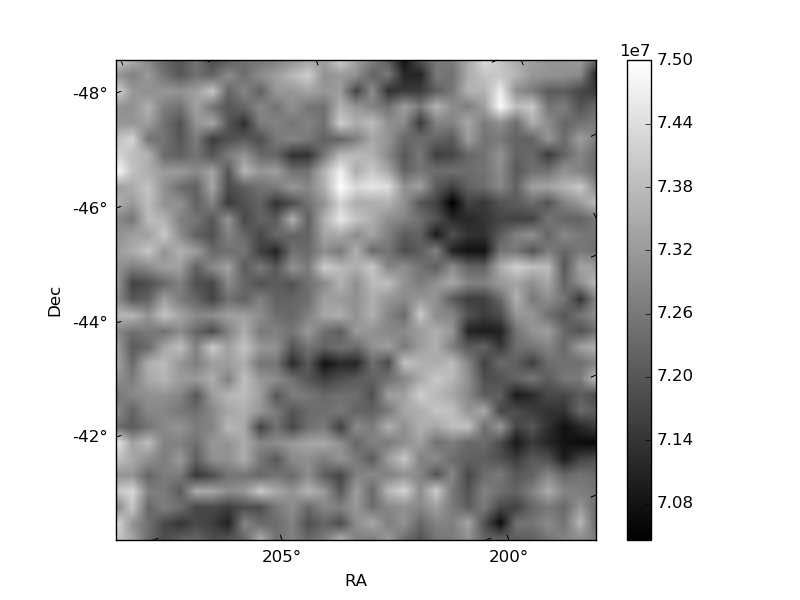
Quadrant B |
|---|---|---|---|
| Quadrant D | 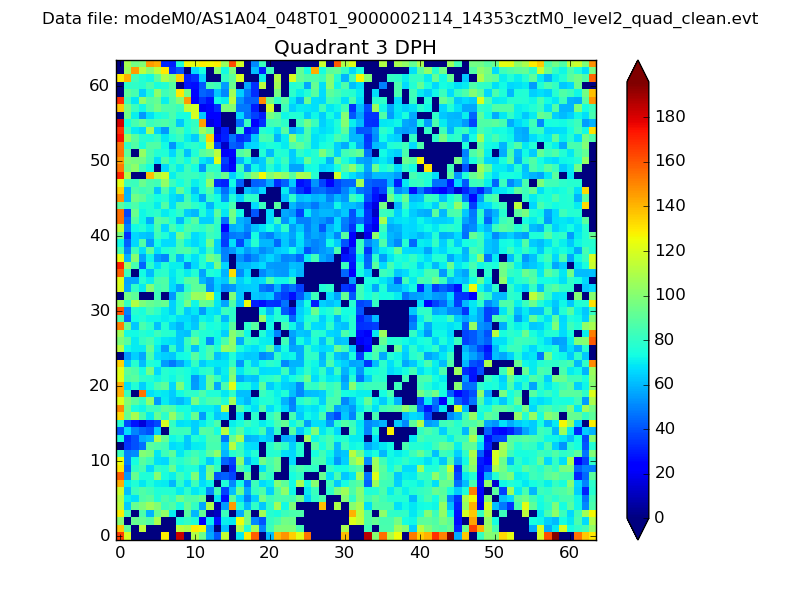 |
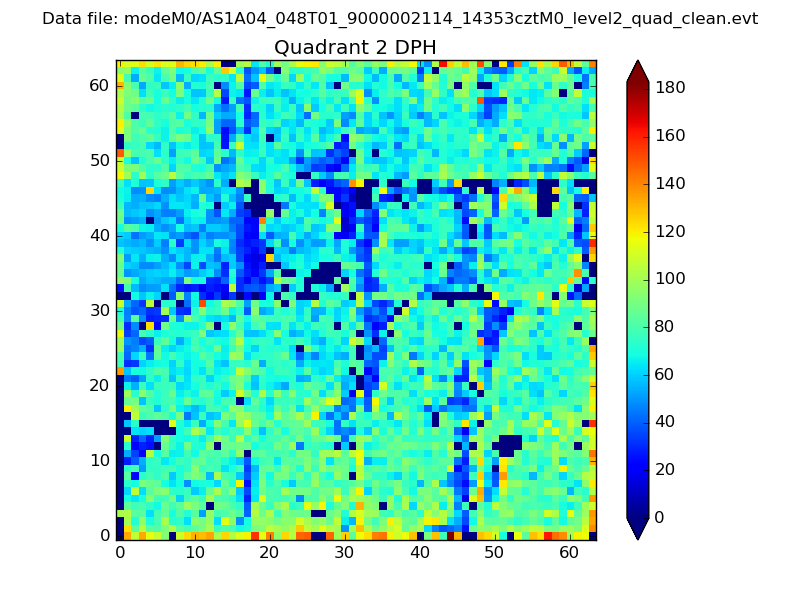 |
Quadrant C |
| Plot type | Count rate plots | Images |
|---|---|---|
| Comparison with Poisson distribution Blue bars denote a histogram of data divided into 1 sec bins. Red curve is a Poisson curve with rate = median count rate of data. |
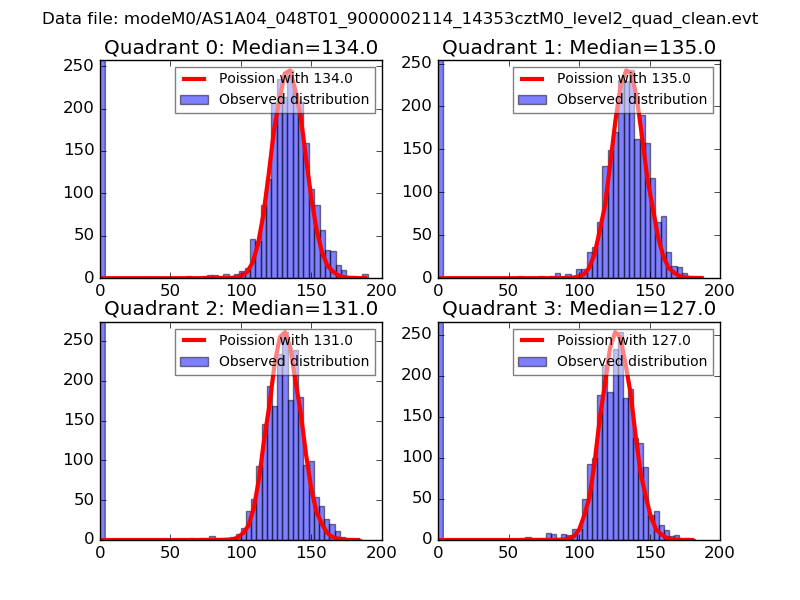 |
 |
| Quadrant-wise count rates Data is divided into 100 sec bins |
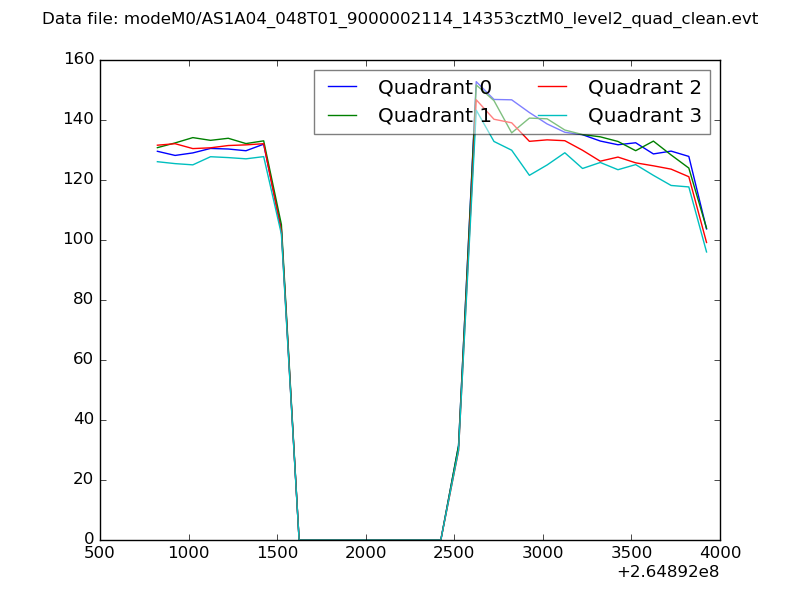 |
|
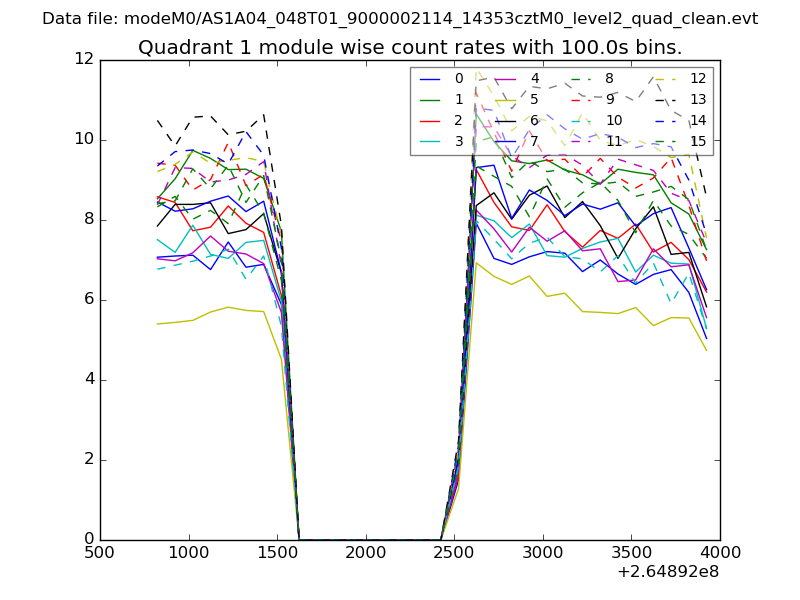
| Module-wise count rates for Quadrant A Data is divided into 100 sec bins |
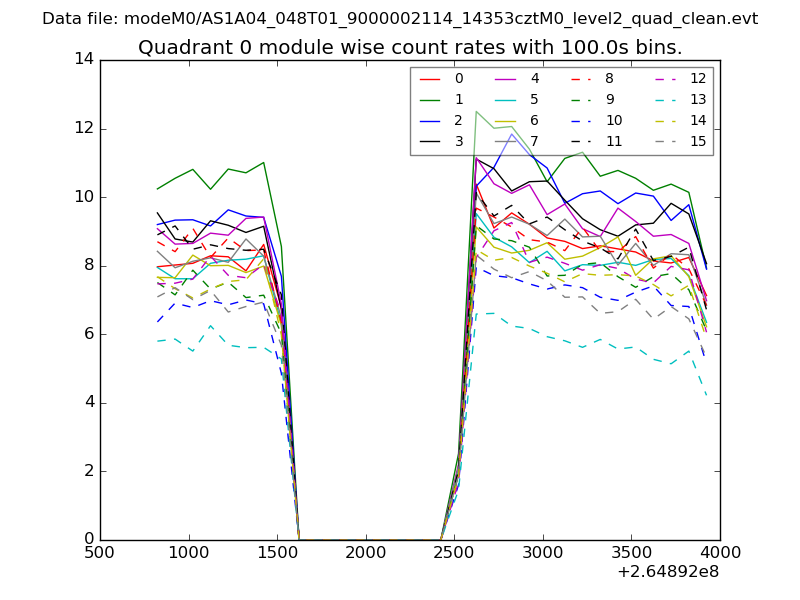 |
 |
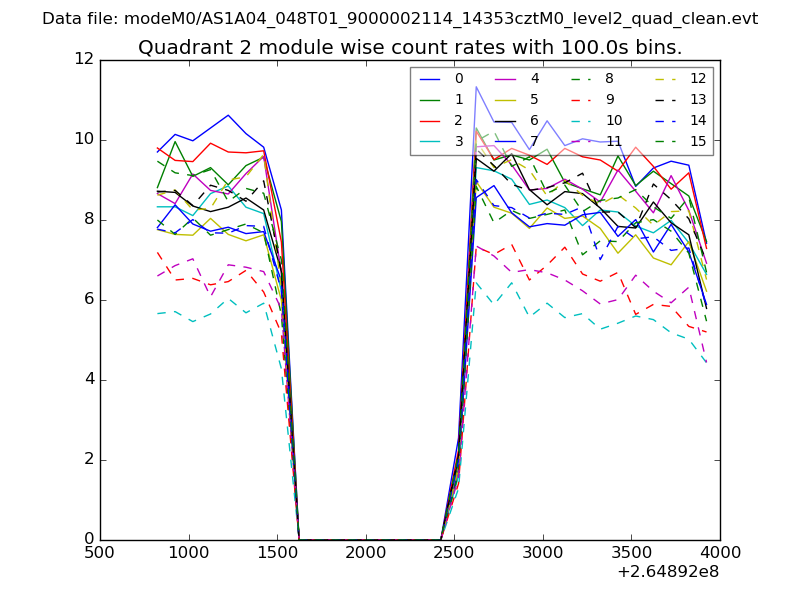
| Module-wise count rates for Quadrant B Data is divided into 100 sec bins |
 |
 |
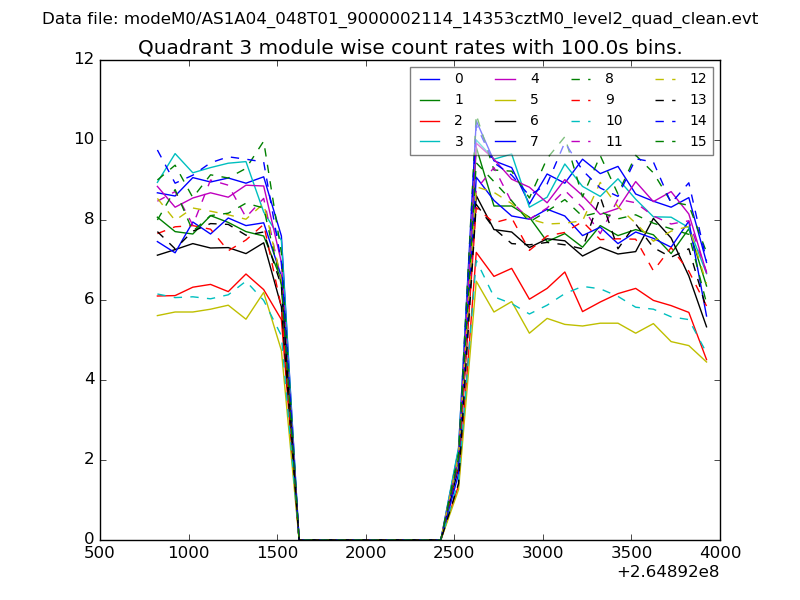
| Module-wise count rates for Quadrant C Data is divided into 100 sec bins |
 |
 |
| Module-wise count rates for Quadrant D Data is divided into 100 sec bins |
 |
 |
| Parameter | Plot |
|---|---|
| CZT HV Monitor | 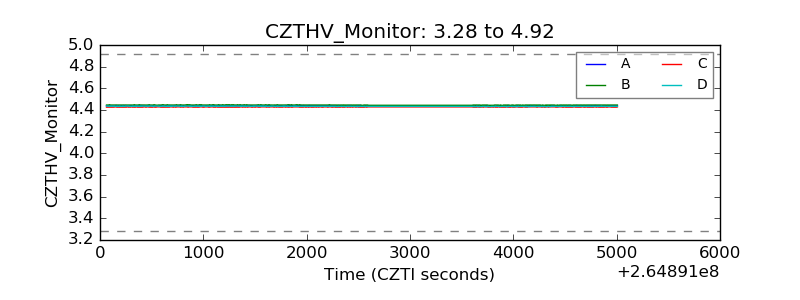 |
| D_VDD | 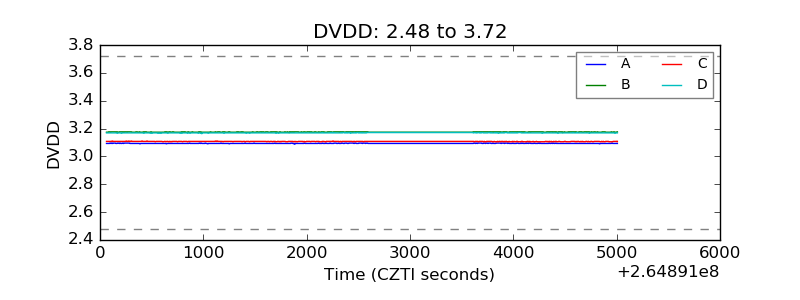 |
| Temperature 1 | 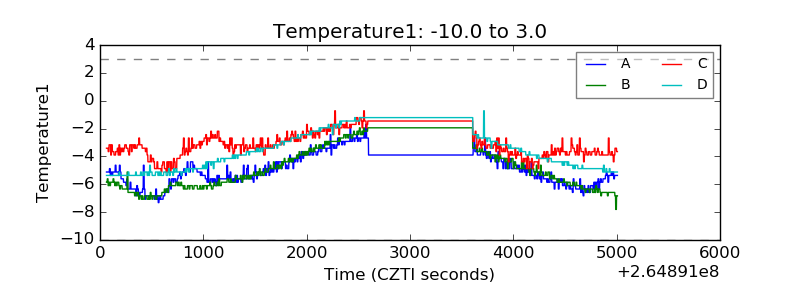 |
| Veto HV Monitor | 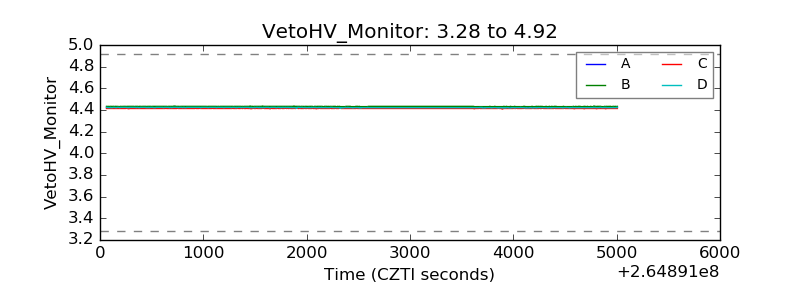 |
| Veto LLD | 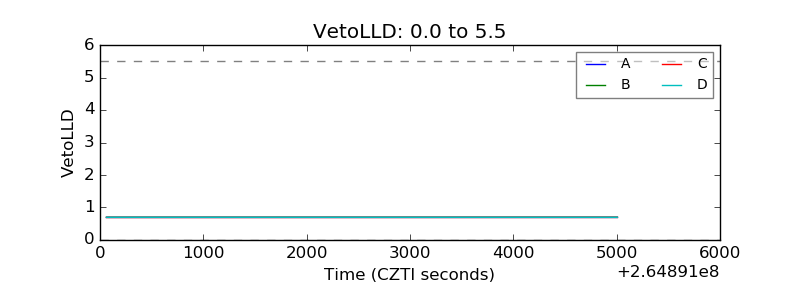 |
| Alpha Counter | 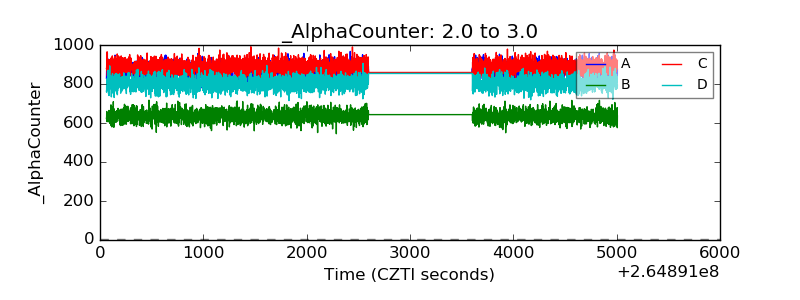 |
| _CPM_Rate | 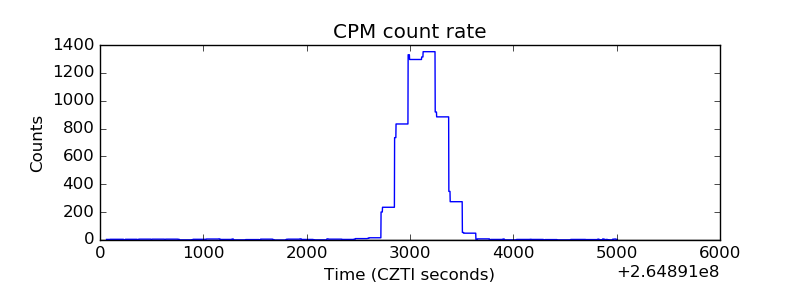 |
| CZT Counter | 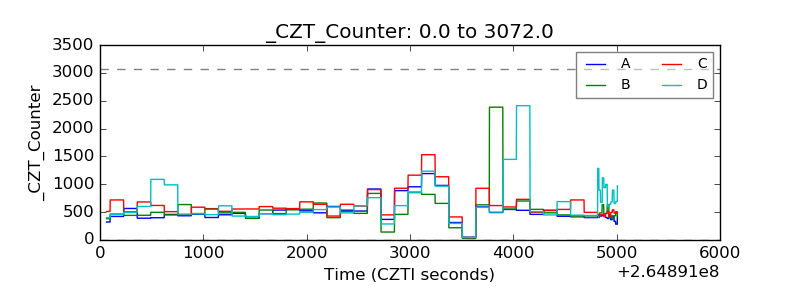 |
| +2.5 Volts monitor | 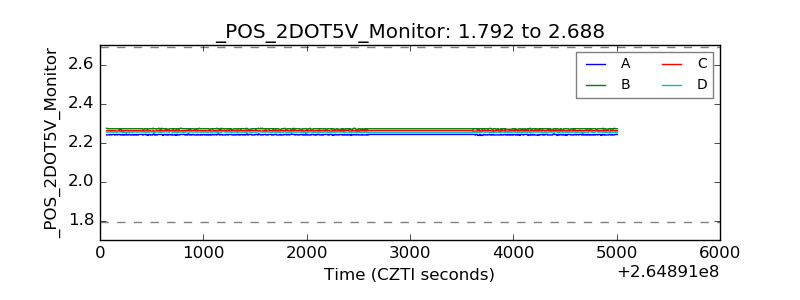 |
| +5 Volts monitor | 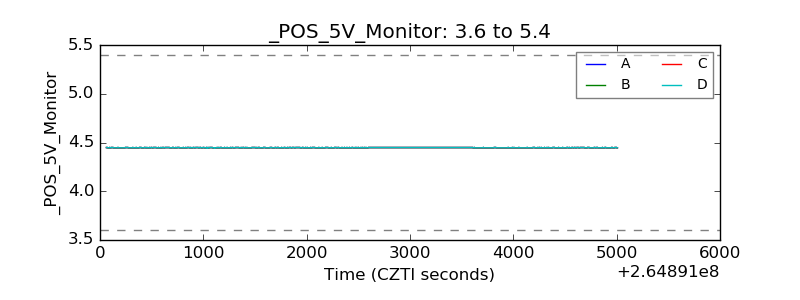 |
| _ROLL_ROT | 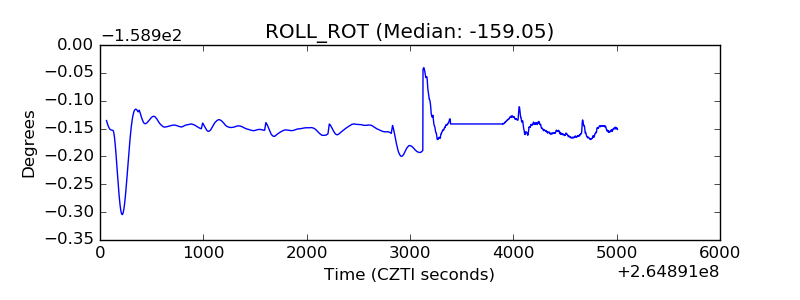 |
| _Roll_DEC | 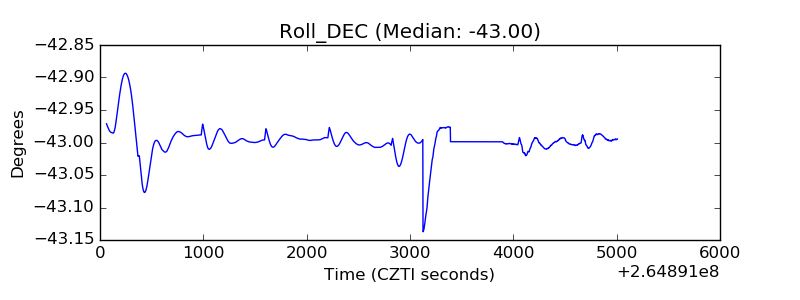 |
| _Roll_RA | 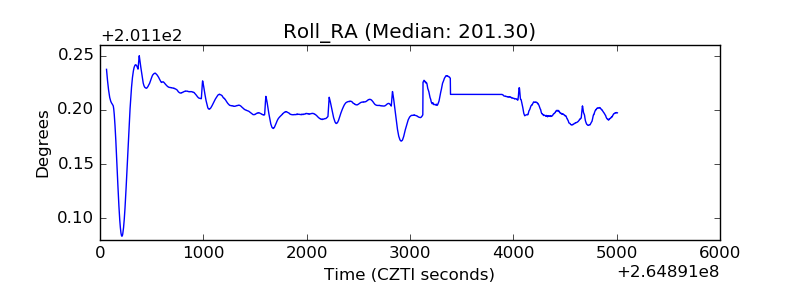 |
| Veto Counter | 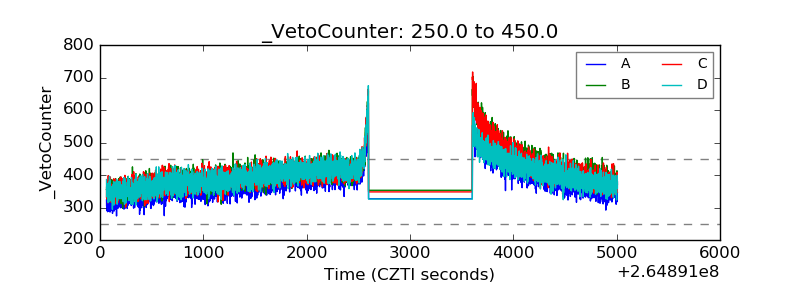 |