| Param | Original file | Final file |
|---|---|---|
| Filename | modeM0/AS1A04_048T01_9000002114_14358cztM0_level2.evt | modeM0/AS1A04_048T01_9000002114_14358cztM0_level2_quad_clean.evt |
| Size (bytes) | 544,973,760 | 75,916,800 |
| Size | 519.7 MB | 72.4 MB |
| Events in quadrant A | 3,284,860 | 479,320 |
| Events in quadrant B | 4,238,417 | 477,696 |
| Events in quadrant C | 3,756,904 | 475,025 |
| Events in quadrant D | 4,799,281 | 428,546 |
| Mode SS | |||
|---|---|---|---|
| Quadrant | BADHDUFLAG | Total packets | Discarded packets |
| A | 0 | 128 | 0 |
| B | 0 | 128 | 0 |
| C | 0 | 128 | 0 |
| D | 0 | 128 | 0 |
| Mode M0 | |||
|---|---|---|---|
| Quadrant | BADHDUFLAG | Total packets | Discarded packets |
| A | 0 | 13401 | 3 |
| B | 0 | 16480 | 2 |
| C | 0 | 15480 | 2 |
| D | 0 | 18213 | 2 |
| Mode M9 | |||
|---|---|---|---|
| Quadrant | BADHDUFLAG | Total packets | Discarded packets |
| A | 0 | 17 | 0 |
| B | 0 | 17 | 0 |
| C | 0 | 17 | 0 |
| D | 0 | 18 | 0 |
| Quadrant | Total seconds | Saturated seconds | Saturation percentage |
|---|---|---|---|
| A | 6273 | 19 | 0.302885% |
| B | 6273 | 272 | 4.336043% |
| C | 6273 | 20 | 0.318827% |
| D | 6273 | 480 | 7.651841% |
Noise dominated data is calculated using 1-second bins in cleaned event files. If a bin has >2000 counts, and if more than 50% of those come from <1% of pixels, then it is considered to be noise-dominated and hence unusable.
| Quadrant | # 1 sec bins | Bins with >0 counts | Bins with >2000 counts | High rate bins dominated by noise | Noise dominated (total time) | Noise dominated (detector-on time) | Marked lightcurve |
|---|---|---|---|---|---|---|---|
| A | 7644 | 6275 | 0 | 0 | 0.00% | 0.00% | 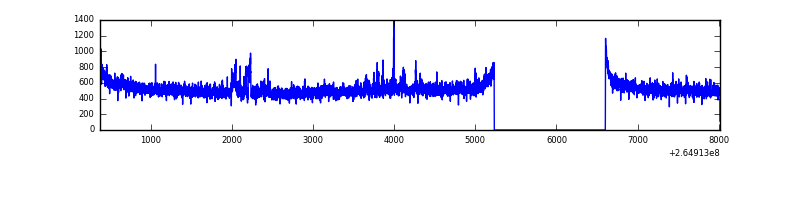 |
| B | 7644 | 6275 | 184 | 184 | 2.41% | 2.93% | 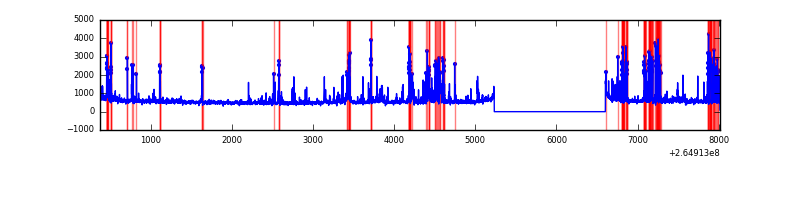 |
| C | 7644 | 6275 | 0 | 0 | 0.00% | 0.00% | 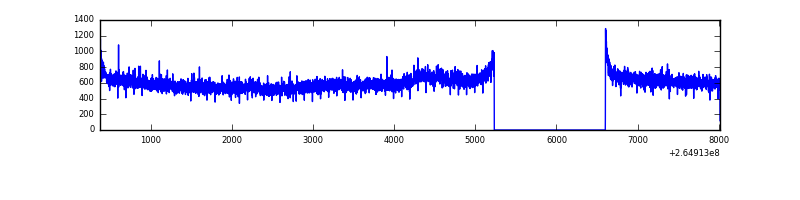 |
| D | 7644 | 6275 | 438 | 438 | 5.73% | 6.98% | 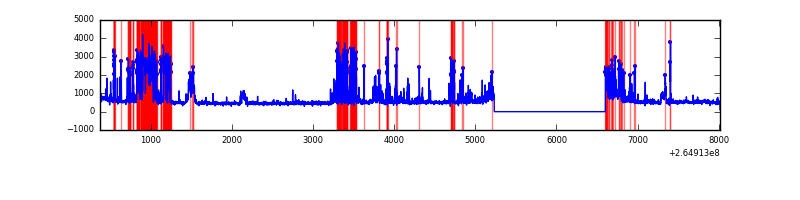 |
Top three noisy pixels from each quadrant. If the there are fewer than three noisy pixels in the level2.evt file, extra rows are filled as -1
| Pixel properties | Quadrant properties | ||||||
|---|---|---|---|---|---|---|---|
| Quadrant | DetID | PixID | Counts | Sigma | Mean | Median | Sigma |
| A | 12 | 189 | 88048 | 530.48 | 827 | 814 | 164.4 |
| A | 2 | 79 | 7688 | 41.8 | 827 | 814 | 164.4 |
| A | 0 | 226 | 7419 | 40.17 | 827 | 814 | 164.4 |
| B | 10 | 16 | 836833 | 5537.98 | 820 | 803 | 151.0 |
| B | 0 | 229 | 89154 | 585.25 | 820 | 803 | 151.0 |
| B | 0 | 189 | 29210 | 188.17 | 820 | 803 | 151.0 |
| C | 3 | 233 | 570005 | 3093.25 | 815 | 822 | 184.0 |
| C | 13 | 61 | 5909 | 27.65 | 815 | 822 | 184.0 |
| C | 3 | 232 | 5592 | 25.92 | 815 | 822 | 184.0 |
| D | 1 | 52 | 908114 | 4995.45 | 777 | 761 | 181.6 |
| D | 5 | 222 | 560652 | 3082.49 | 777 | 761 | 181.6 |
| D | 2 | 120 | 196490 | 1077.59 | 777 | 761 | 181.6 |
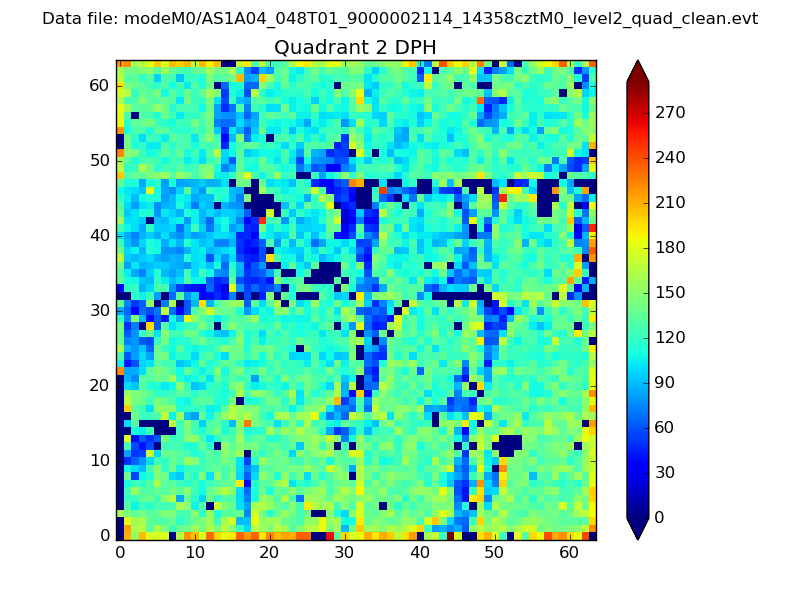
Histogram calculated using DETX and DETY for each event in the final _common_clean file
| Quadrant A | 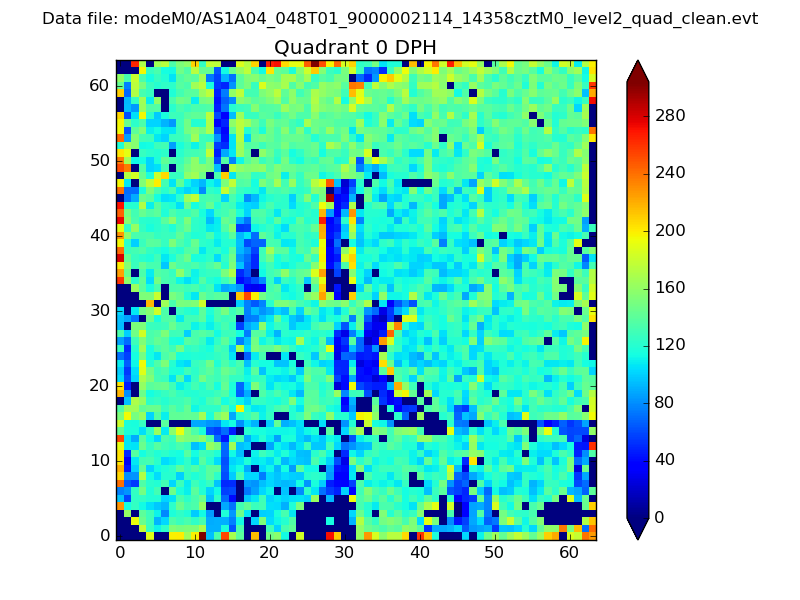 |
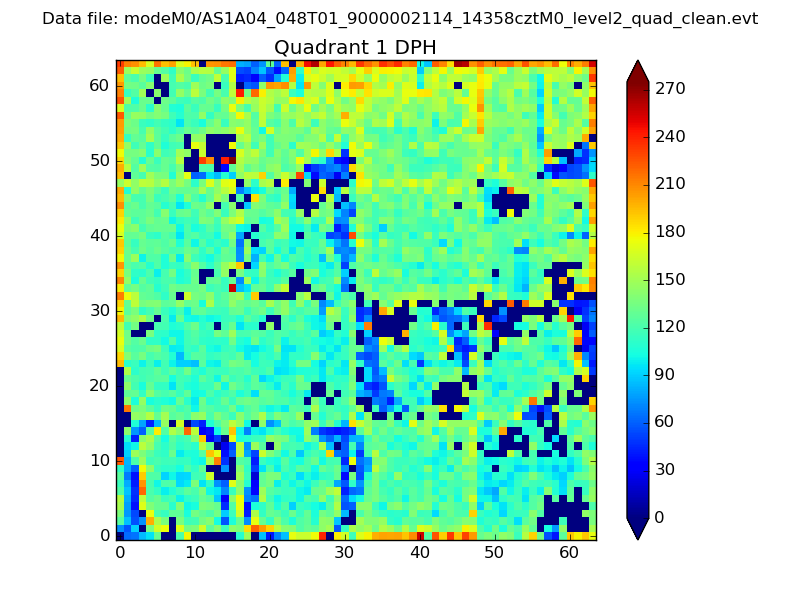 |
Quadrant B |
|---|---|---|---|
| Quadrant D | 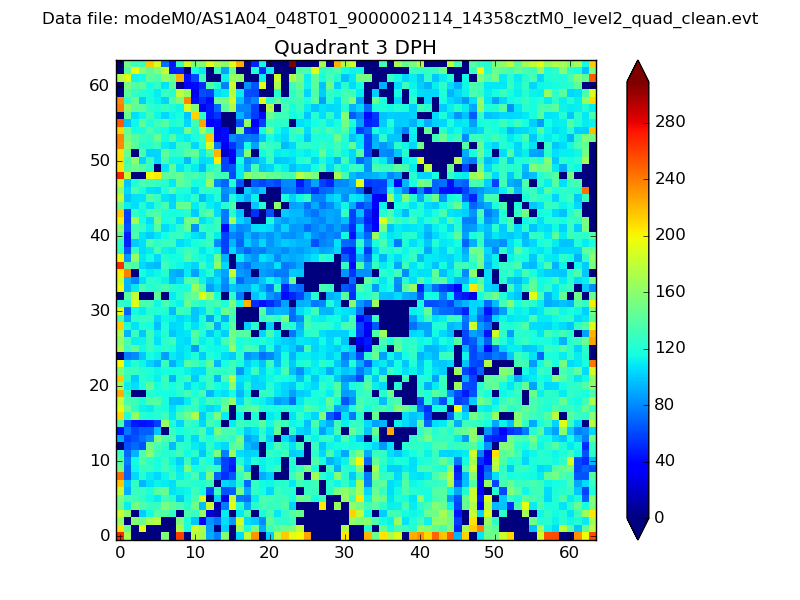 |
 |
Quadrant C |
| Plot type | Count rate plots | Images |
|---|---|---|
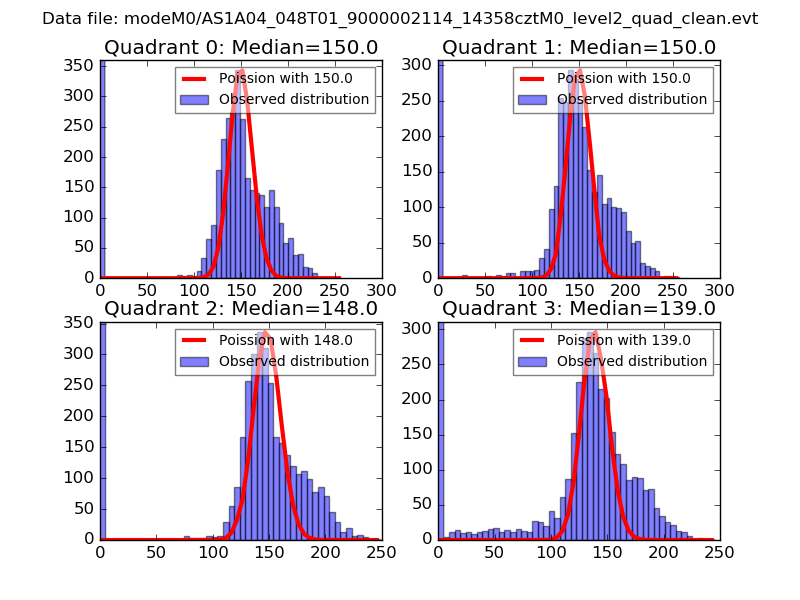
| Comparison with Poisson distribution Blue bars denote a histogram of data divided into 1 sec bins. Red curve is a Poisson curve with rate = median count rate of data. |
 |
 |
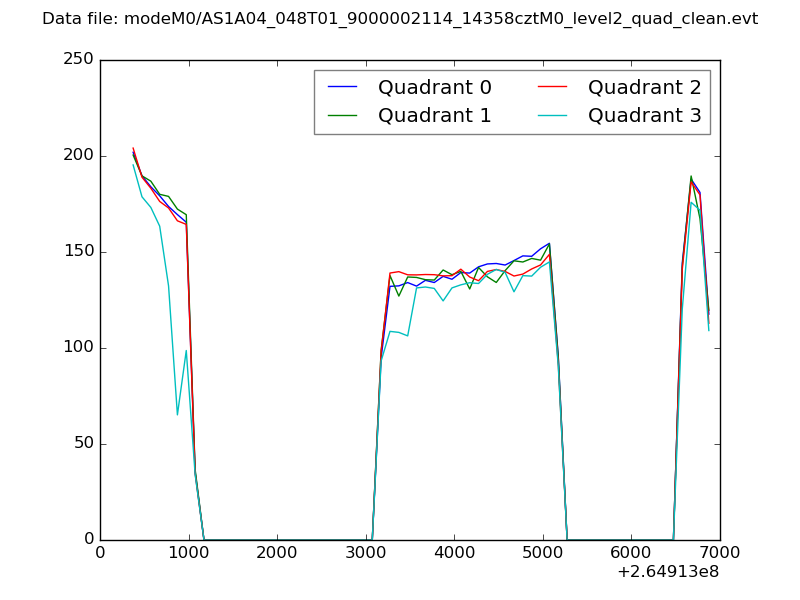
| Quadrant-wise count rates Data is divided into 100 sec bins |
 |
|
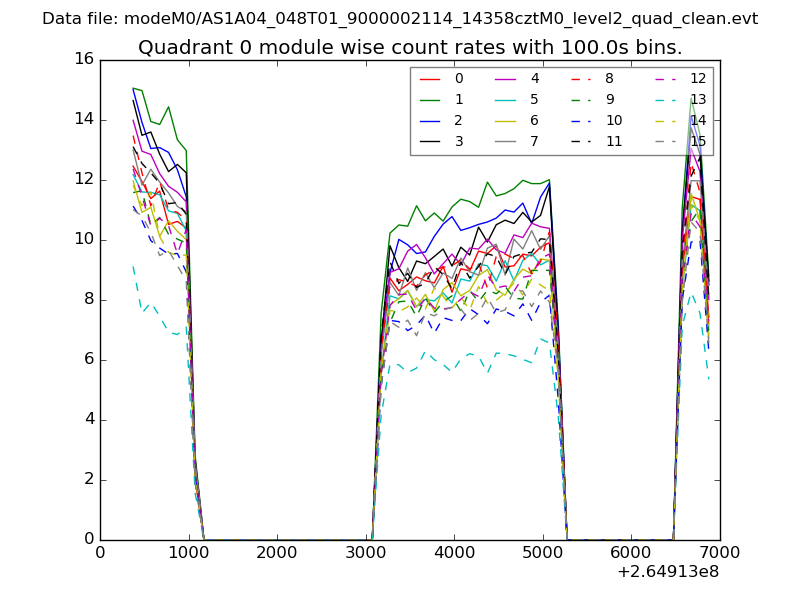
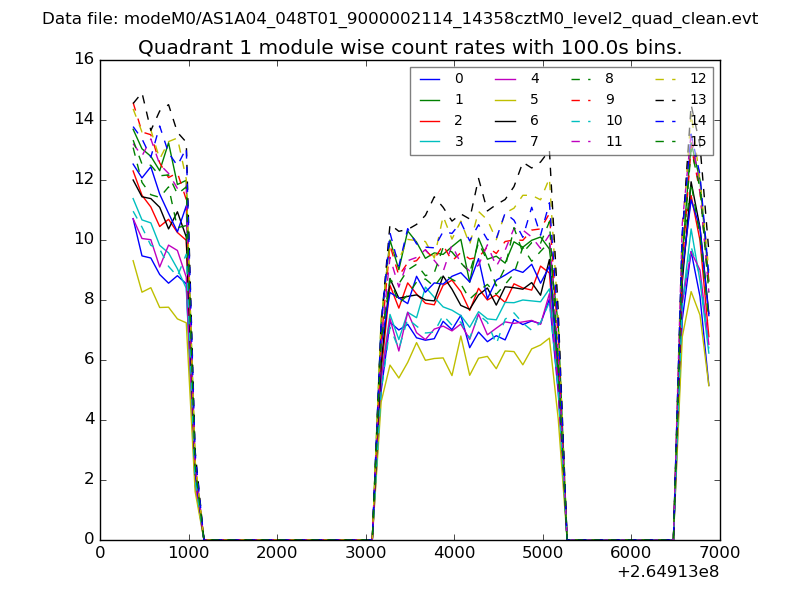
| Module-wise count rates for Quadrant A Data is divided into 100 sec bins |
 |
 |
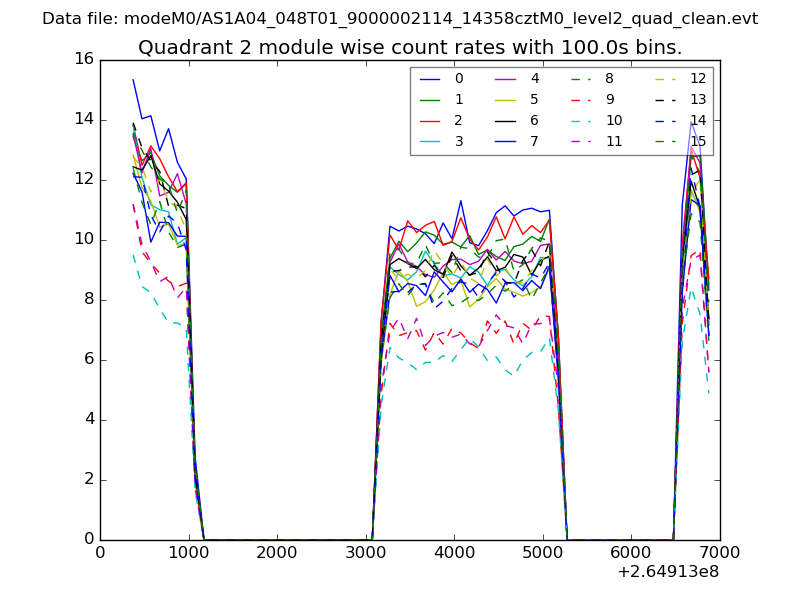
| Module-wise count rates for Quadrant B Data is divided into 100 sec bins |
 |
 |
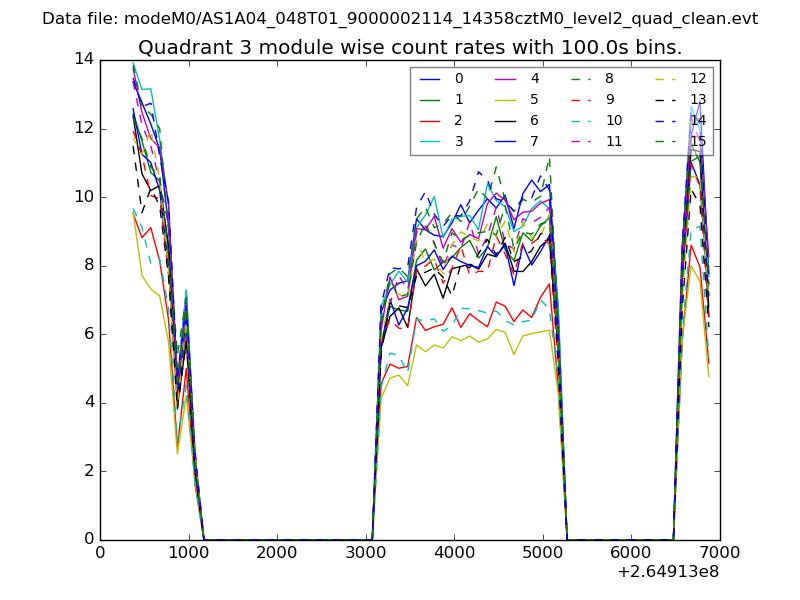
| Module-wise count rates for Quadrant C Data is divided into 100 sec bins |
 |
 |
| Module-wise count rates for Quadrant D Data is divided into 100 sec bins |
 |
 |
| Parameter | Plot |
|---|---|
| CZT HV Monitor | 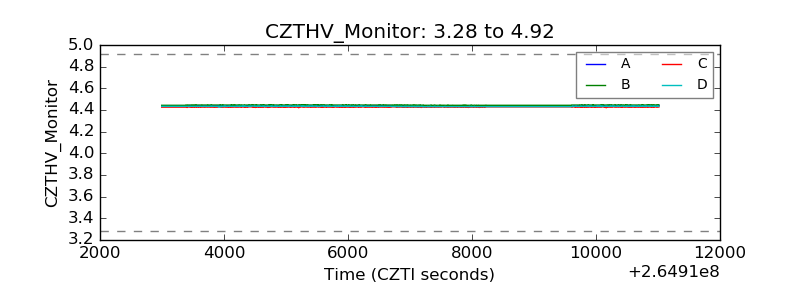 |
| D_VDD | 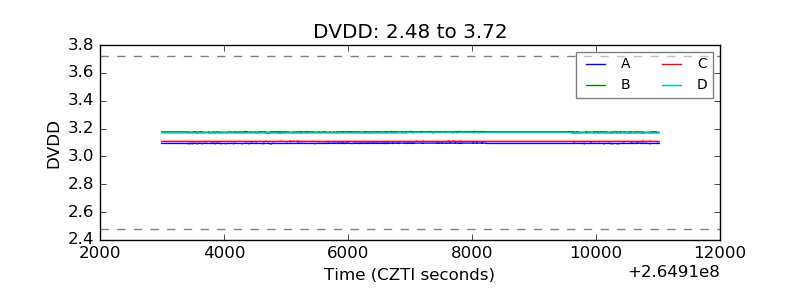 |
| Temperature 1 | 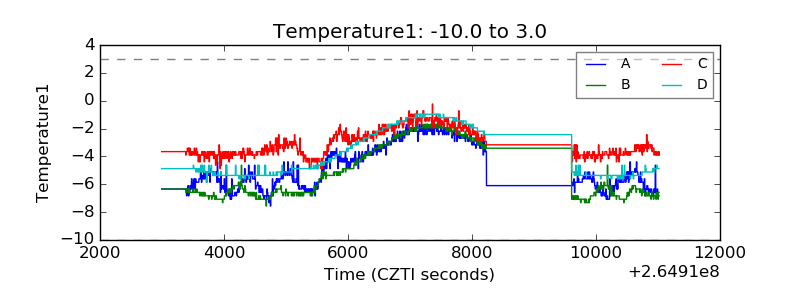 |
| Veto HV Monitor | 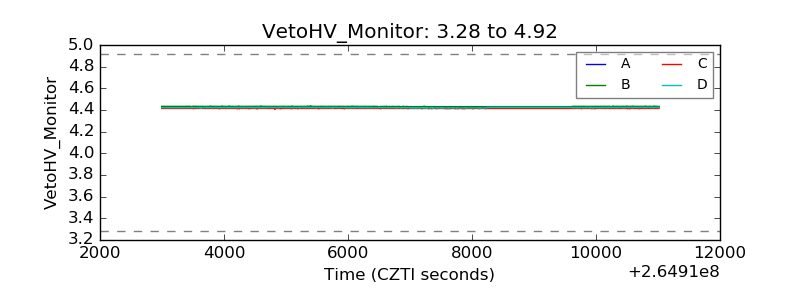 |
| Veto LLD | 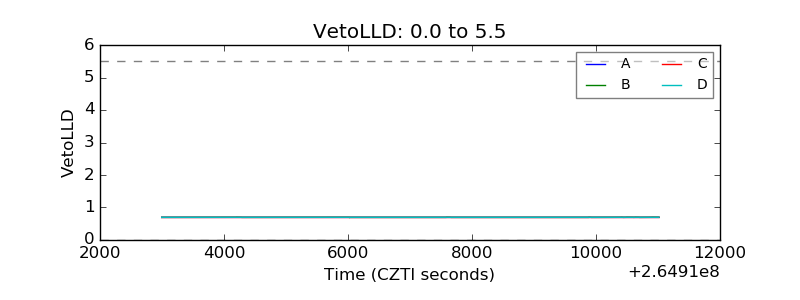 |
| Alpha Counter | 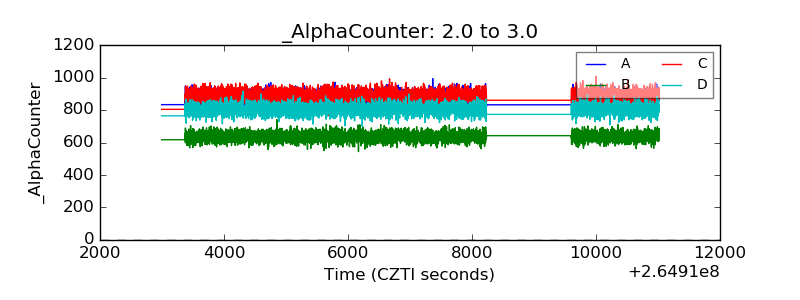 |
| _CPM_Rate | 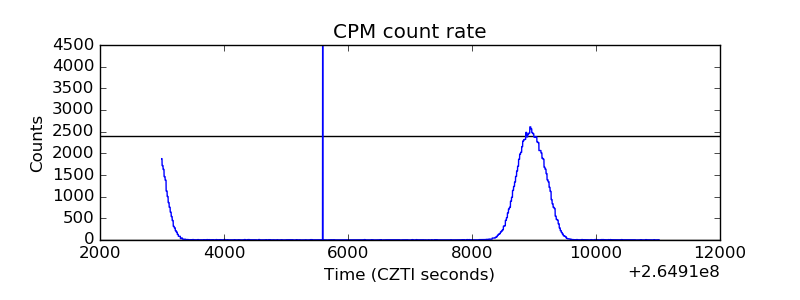 |
| CZT Counter | 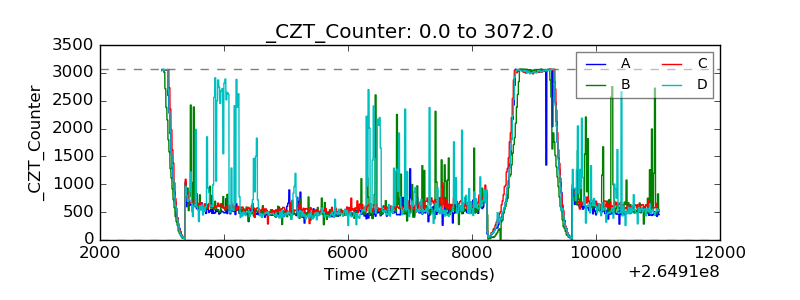 |
| +2.5 Volts monitor |  |
| +5 Volts monitor | 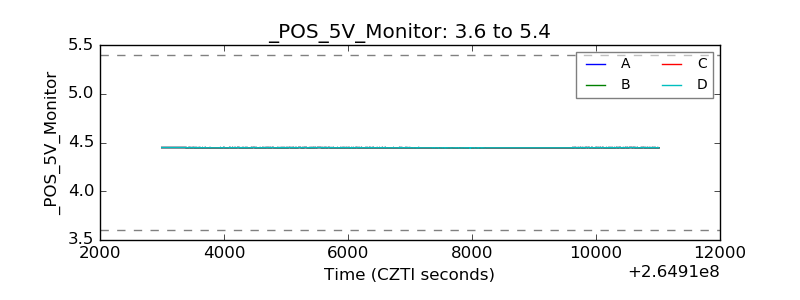 |
| _ROLL_ROT | 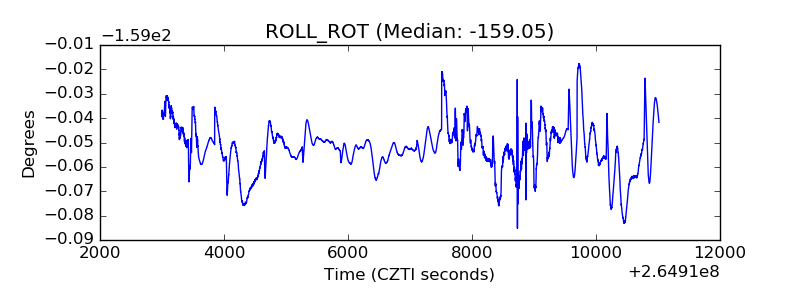 |
| _Roll_DEC | 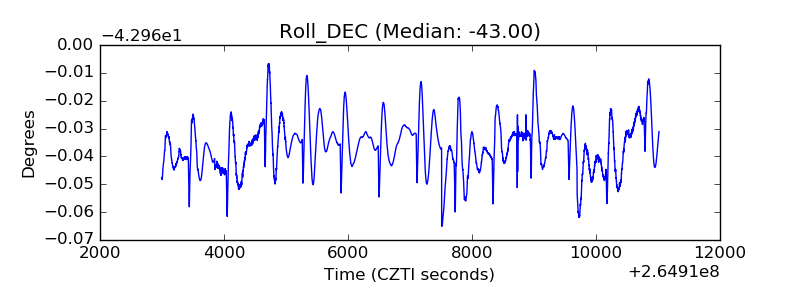 |
| _Roll_RA | 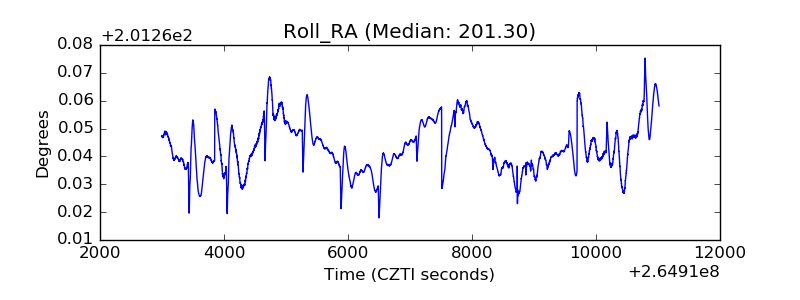 |
| Veto Counter | 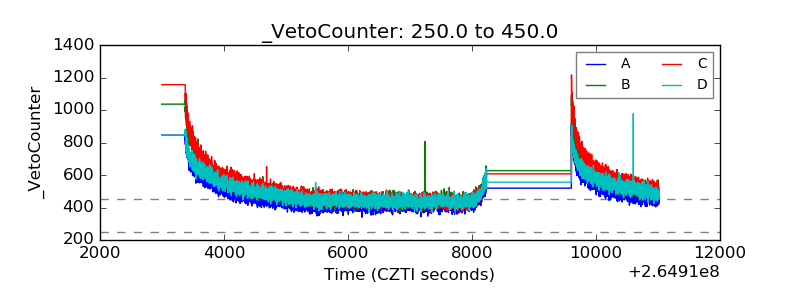 |