| Param | Original file | Final file |
|---|---|---|
| Filename | modeM0/AS1A04_048T01_9000002114_14360cztM0_level2.evt | modeM0/AS1A04_048T01_9000002114_14360cztM0_level2_quad_clean.evt |
| Size (bytes) | 497,355,840 | 68,999,040 |
| Size | 474.3 MB | 65.8 MB |
| Events in quadrant A | 3,162,578 | 416,178 |
| Events in quadrant B | 3,715,580 | 414,955 |
| Events in quadrant C | 3,893,824 | 408,909 |
| Events in quadrant D | 3,857,549 | 403,914 |
| Mode SS | |||
|---|---|---|---|
| Quadrant | BADHDUFLAG | Total packets | Discarded packets |
| A | 0 | 132 | 0 |
| B | 0 | 132 | 0 |
| C | 0 | 132 | 0 |
| D | 0 | 132 | 0 |
| Mode M0 | |||
|---|---|---|---|
| Quadrant | BADHDUFLAG | Total packets | Discarded packets |
| A | 0 | 13221 | 3 |
| B | 0 | 14863 | 2 |
| C | 0 | 16105 | 2 |
| D | 0 | 15504 | 2 |
| Mode M9 | |||
|---|---|---|---|
| Quadrant | BADHDUFLAG | Total packets | Discarded packets |
| A | 0 | 24 | 0 |
| B | 0 | 24 | 0 |
| C | 0 | 24 | 0 |
| D | 0 | 24 | 0 |
| Quadrant | Total seconds | Saturated seconds | Saturation percentage |
|---|---|---|---|
| A | 6379 | 68 | 1.065998% |
| B | 6379 | 205 | 3.213670% |
| C | 6379 | 81 | 1.269792% |
| D | 6379 | 276 | 4.326697% |
Noise dominated data is calculated using 1-second bins in cleaned event files. If a bin has >2000 counts, and if more than 50% of those come from <1% of pixels, then it is considered to be noise-dominated and hence unusable.
| Quadrant | # 1 sec bins | Bins with >0 counts | Bins with >2000 counts | High rate bins dominated by noise | Noise dominated (total time) | Noise dominated (detector-on time) | Marked lightcurve |
|---|---|---|---|---|---|---|---|
| A | 8811 | 6381 | 0 | 0 | 0.00% | 0.00% |  |
| B | 8811 | 6381 | 83 | 83 | 0.94% | 1.30% |  |
| C | 8811 | 6381 | 1 | 1 | 0.01% | 0.02% |  |
| D | 8811 | 6381 | 182 | 182 | 2.07% | 2.85% |  |
Top three noisy pixels from each quadrant. If the there are fewer than three noisy pixels in the level2.evt file, extra rows are filled as -1
| Pixel properties | Quadrant properties | ||||||
|---|---|---|---|---|---|---|---|
| Quadrant | DetID | PixID | Counts | Sigma | Mean | Median | Sigma |
| A | 12 | 189 | 20405 | 120.37 | 813 | 795 | 162.9 |
| A | 8 | 15 | 10284 | 58.24 | 813 | 795 | 162.9 |
| A | 0 | 226 | 7167 | 39.11 | 813 | 795 | 162.9 |
| B | 10 | 16 | 394880 | 2580.08 | 810 | 792 | 152.7 |
| B | 0 | 229 | 101016 | 656.16 | 810 | 792 | 152.7 |
| B | 0 | 189 | 23767 | 150.42 | 810 | 792 | 152.7 |
| C | 3 | 233 | 768714 | 4240.53 | 795 | 800 | 181.1 |
| C | 3 | 232 | 8288 | 41.35 | 795 | 800 | 181.1 |
| C | 14 | 234 | 6651 | 32.31 | 795 | 800 | 181.1 |
| D | 5 | 222 | 804303 | 4341.08 | 781 | 763 | 185.1 |
| D | 2 | 120 | 35386 | 187.05 | 781 | 763 | 185.1 |
| D | 1 | 52 | 27005 | 141.77 | 781 | 763 | 185.1 |
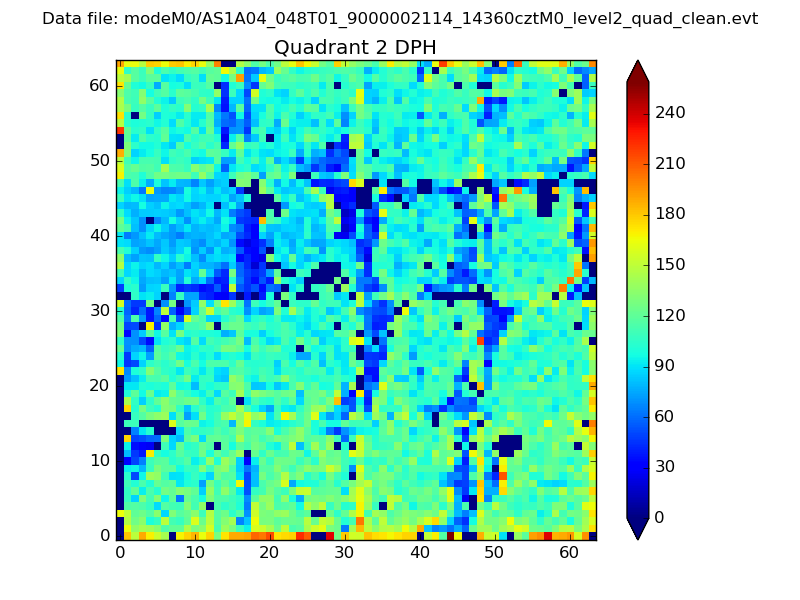
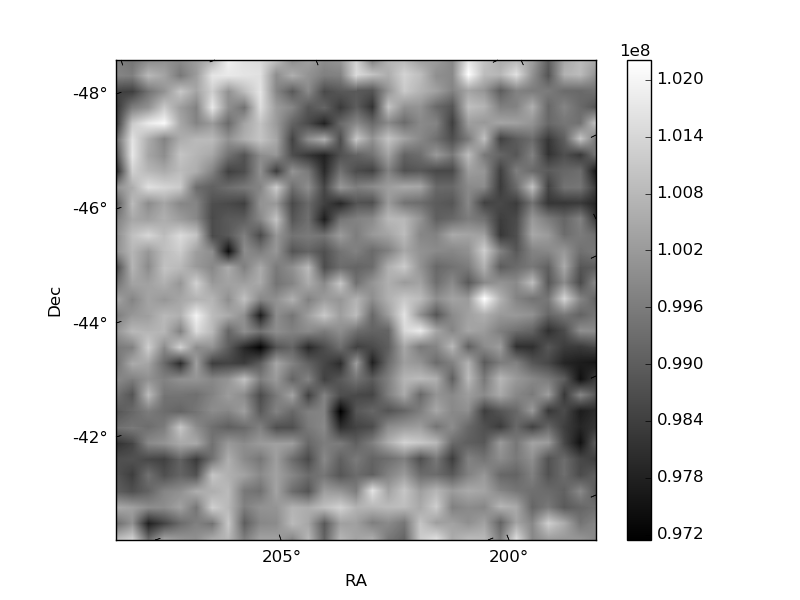
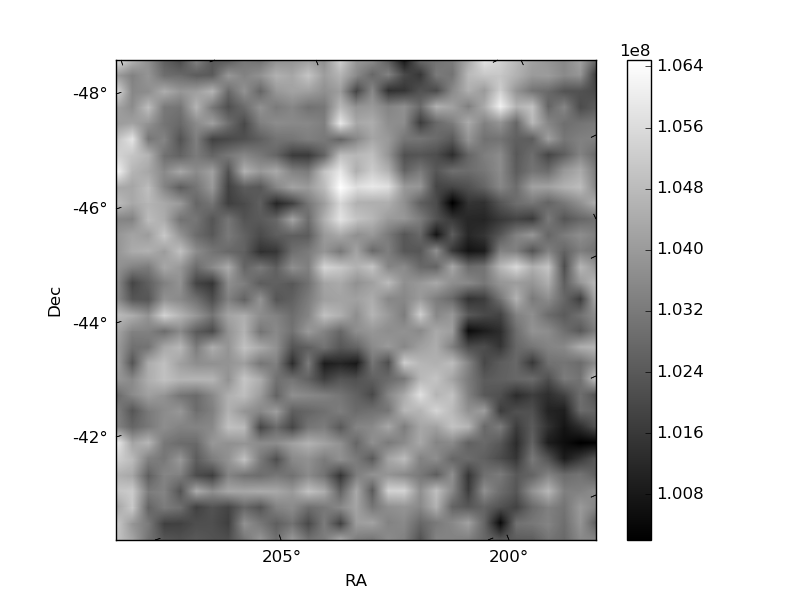
Histogram calculated using DETX and DETY for each event in the final _common_clean file
| Quadrant A | 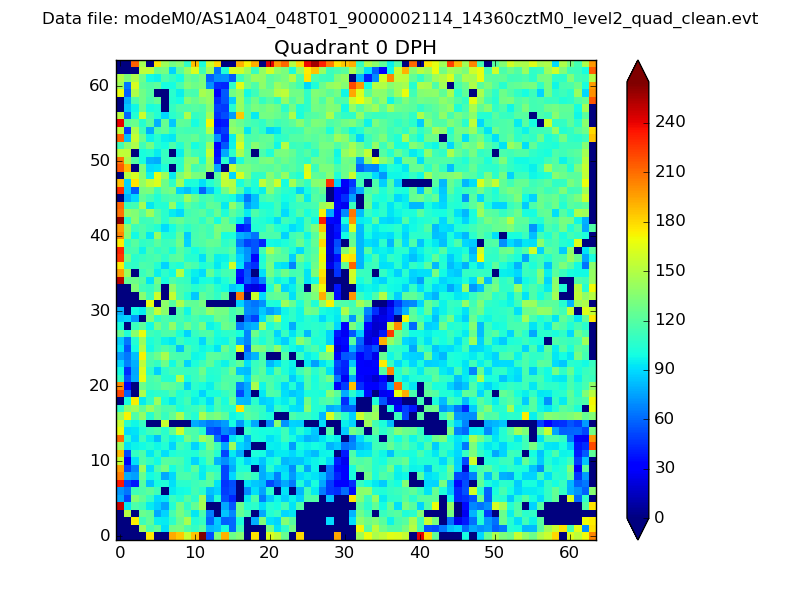 |
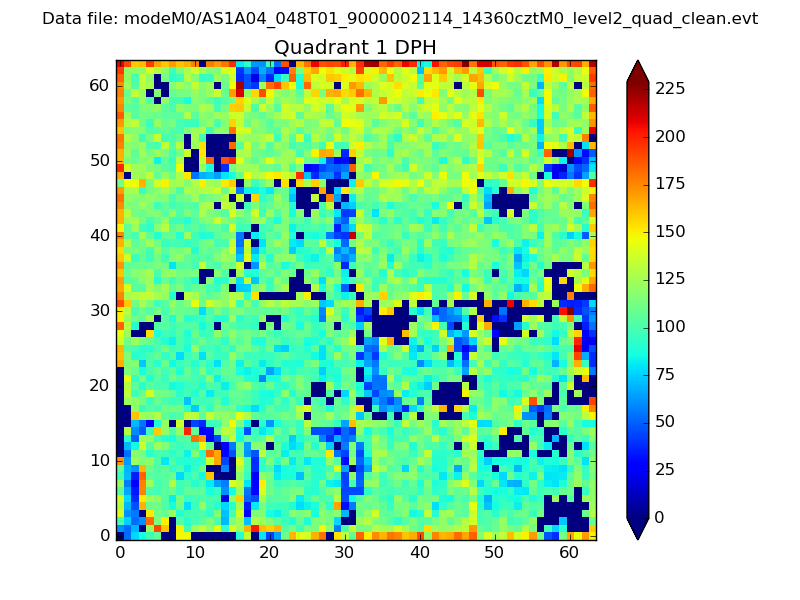 |
Quadrant B |
|---|---|---|---|
| Quadrant D | 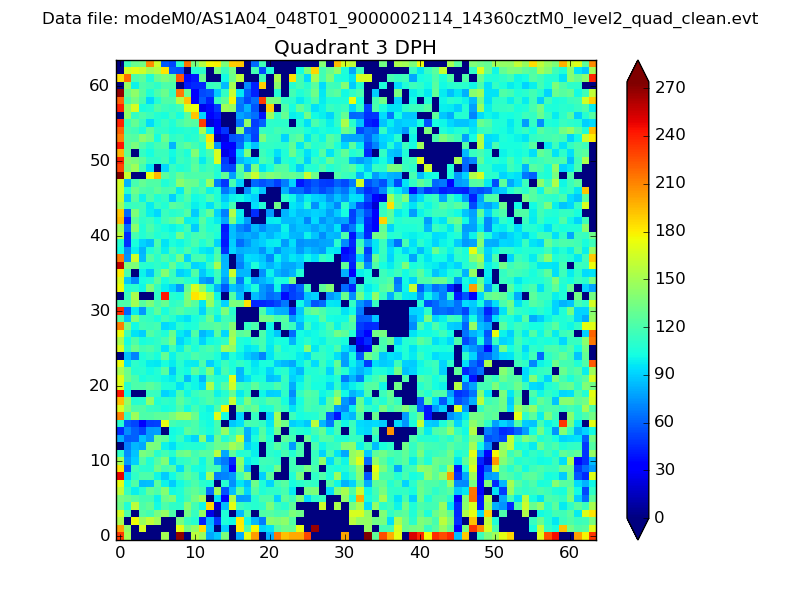 |
 |
Quadrant C |
| Plot type | Count rate plots | Images |
|---|---|---|
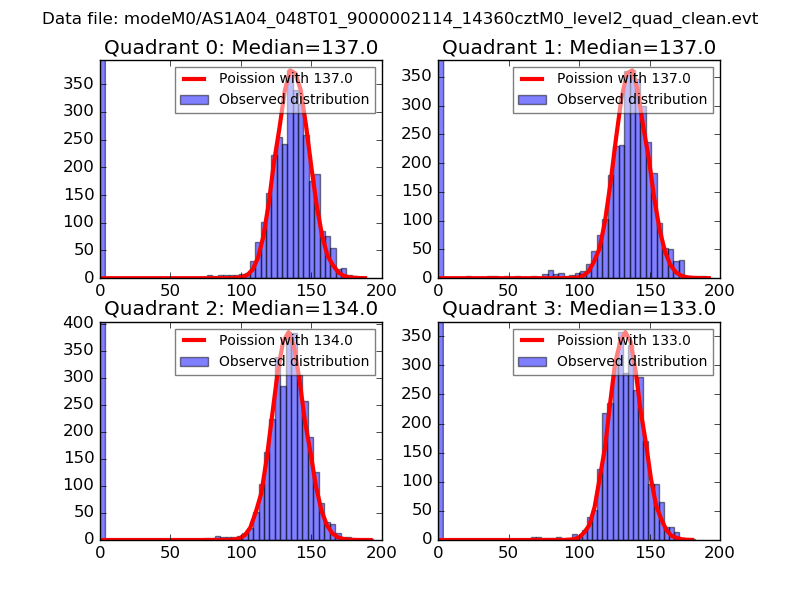
| Comparison with Poisson distribution Blue bars denote a histogram of data divided into 1 sec bins. Red curve is a Poisson curve with rate = median count rate of data. |
 |
 |
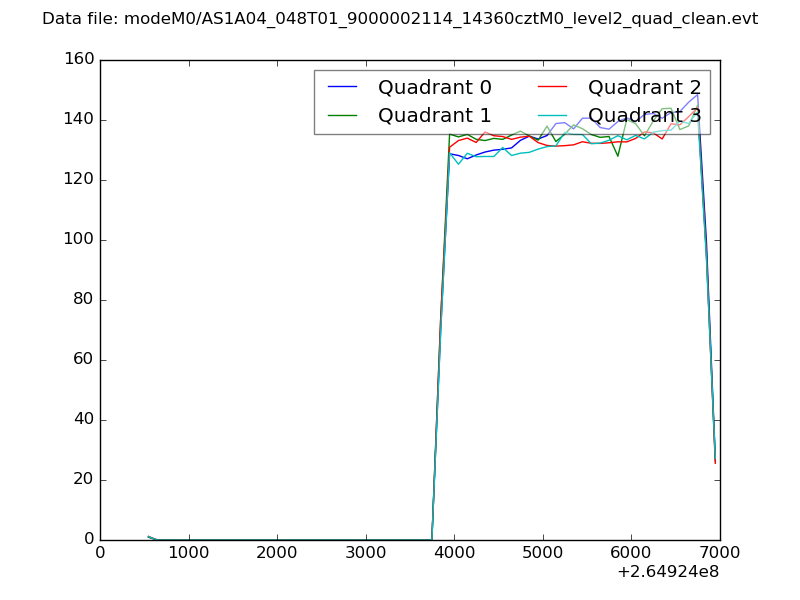
| Quadrant-wise count rates Data is divided into 100 sec bins |
 |
|
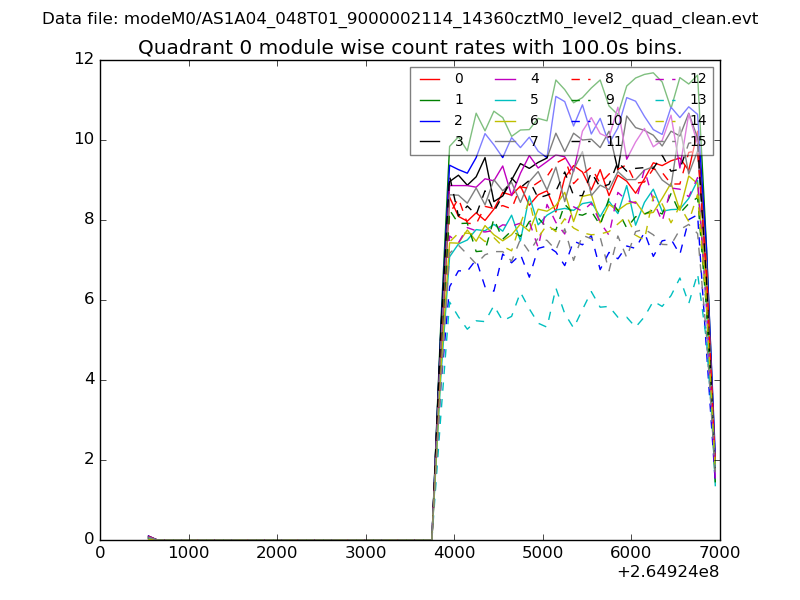
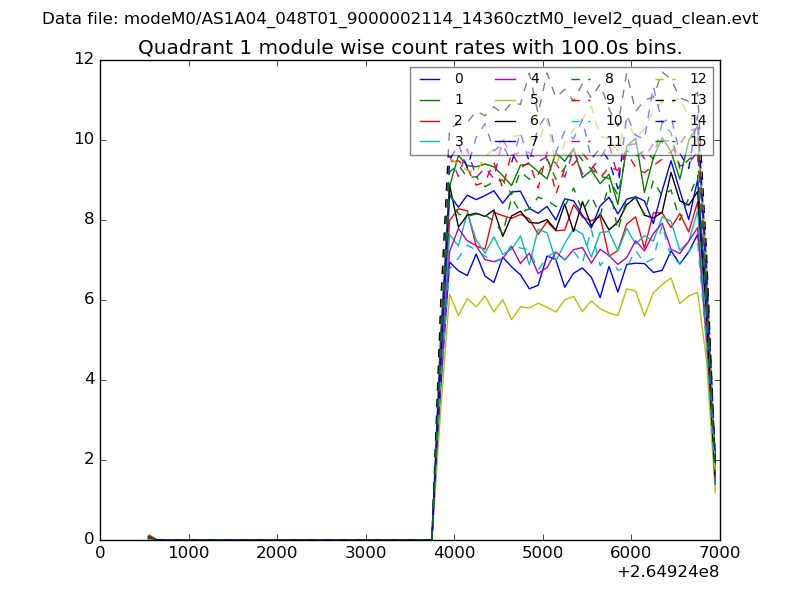
| Module-wise count rates for Quadrant A Data is divided into 100 sec bins |
 |
 |
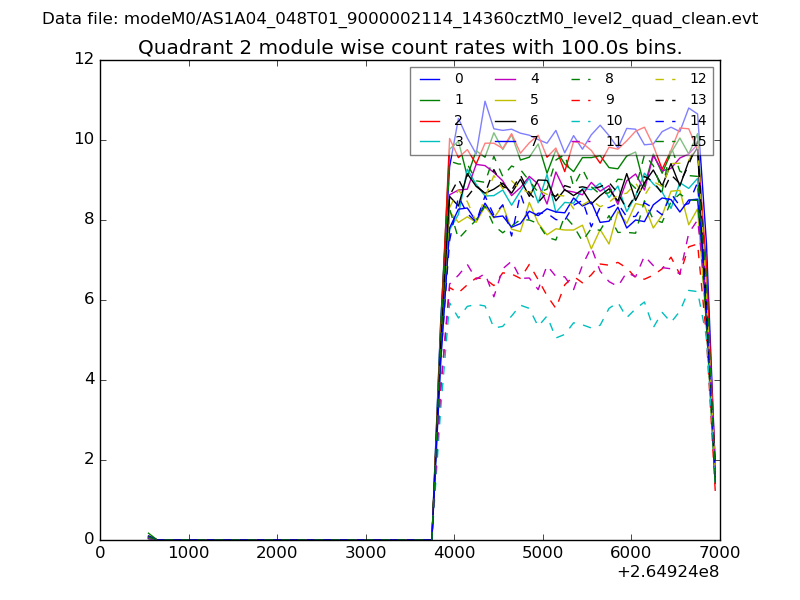
| Module-wise count rates for Quadrant B Data is divided into 100 sec bins |
 |
 |
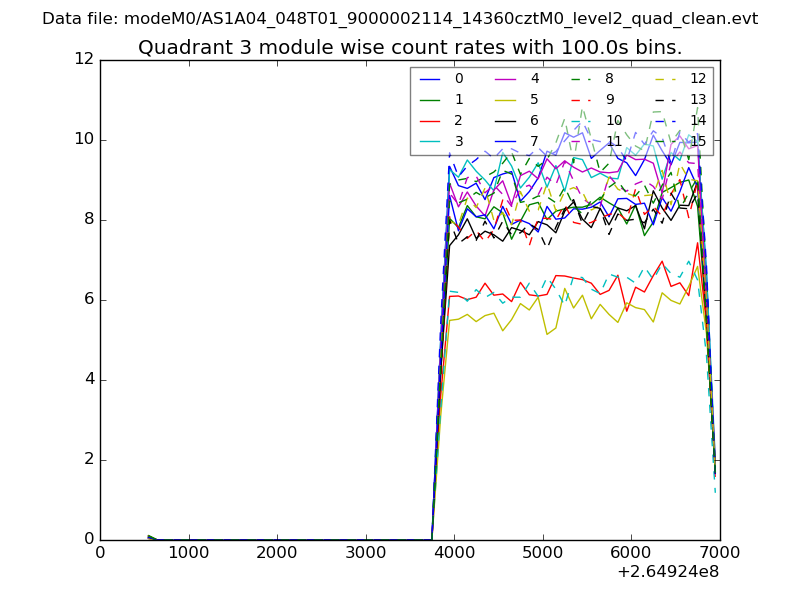
| Module-wise count rates for Quadrant C Data is divided into 100 sec bins |
 |
 |
| Module-wise count rates for Quadrant D Data is divided into 100 sec bins |
 |
 |
| Parameter | Plot |
|---|---|
| CZT HV Monitor | 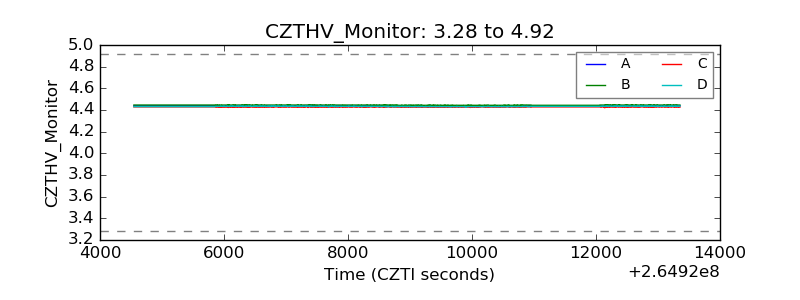 |
| D_VDD | 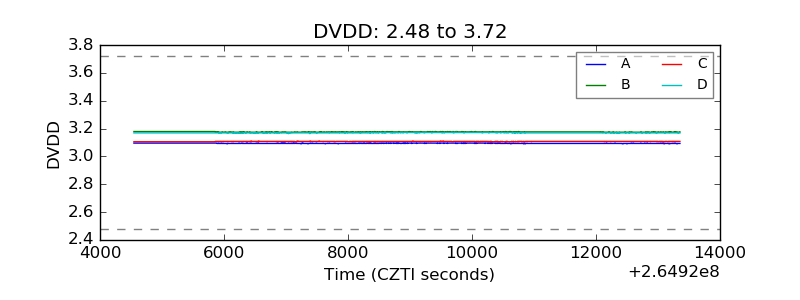 |
| Temperature 1 | 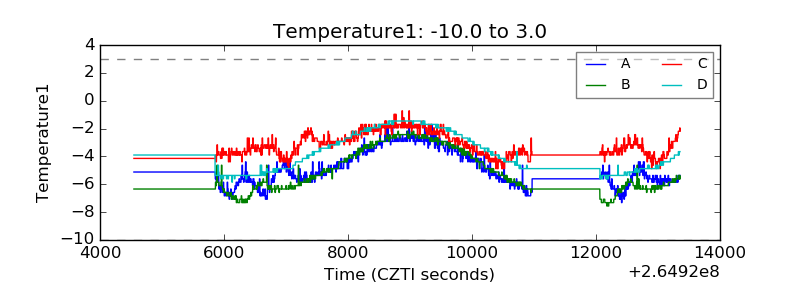 |
| Veto HV Monitor | 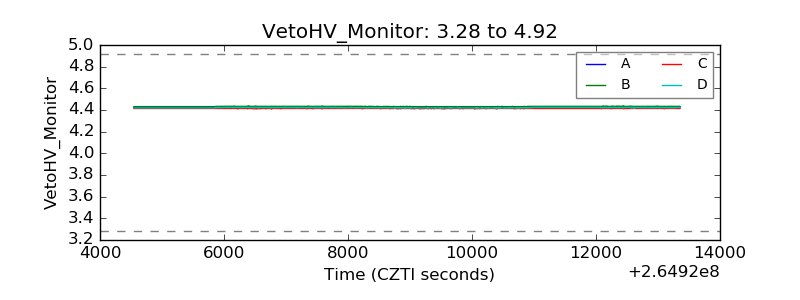 |
| Veto LLD | 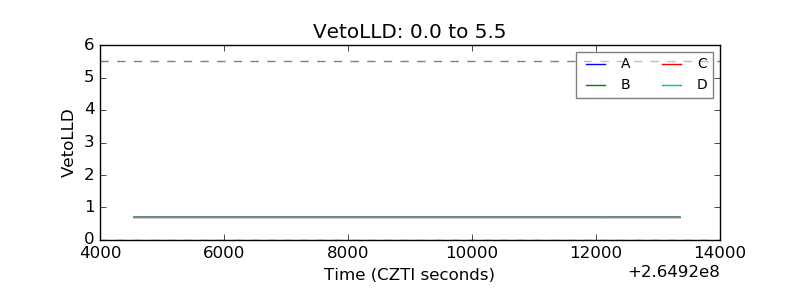 |
| Alpha Counter | 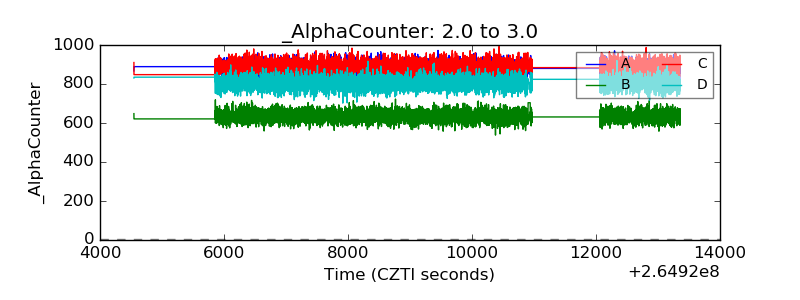 |
| _CPM_Rate | 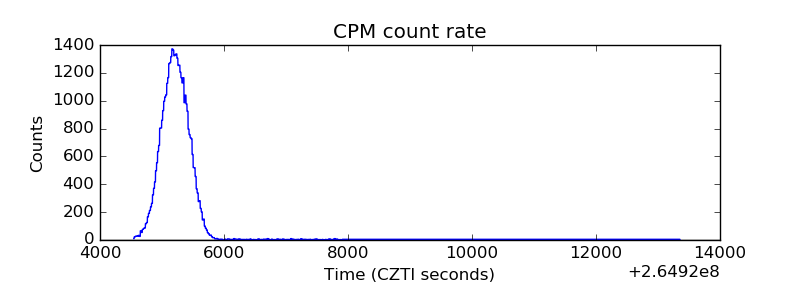 |
| CZT Counter | 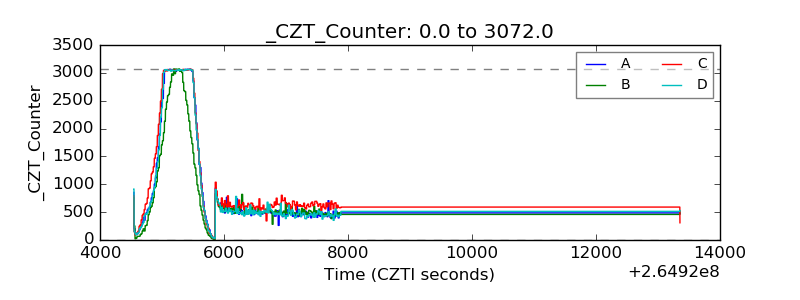 |
| +2.5 Volts monitor |  |
| +5 Volts monitor |  |
| _ROLL_ROT | 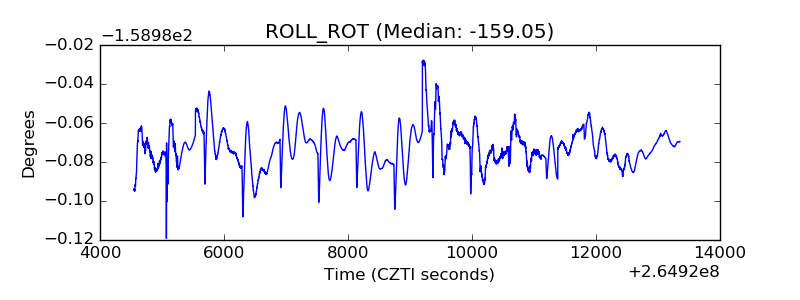 |
| _Roll_DEC | 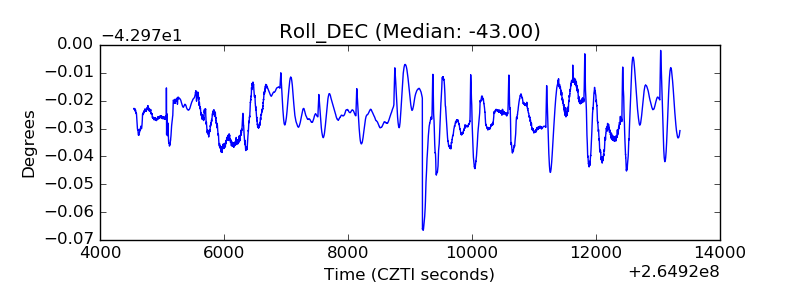 |
| _Roll_RA | 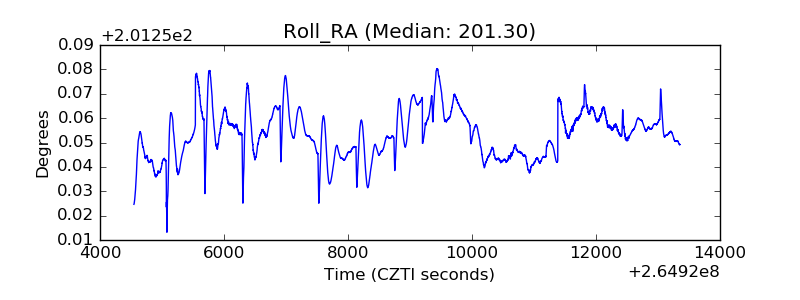 |
| Veto Counter | 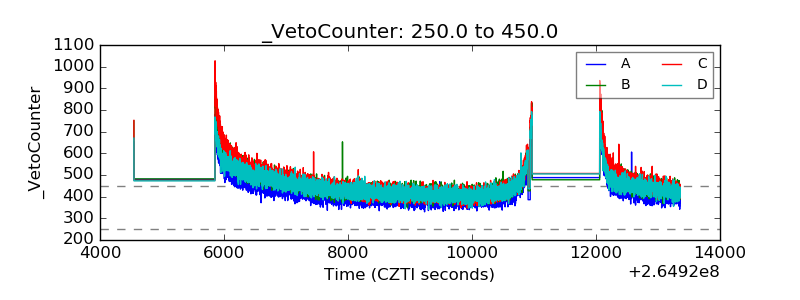 |