| Param | Original file | Final file |
|---|---|---|
| Filename | modeM0/AS1A04_048T01_9000002114_14362cztM0_level2.evt | modeM0/AS1A04_048T01_9000002114_14362cztM0_level2_quad_clean.evt |
| Size (bytes) | 640,016,640 | 99,794,880 |
| Size | 610.4 MB | 95.2 MB |
| Events in quadrant A | 3,992,413 | 626,564 |
| Events in quadrant B | 4,298,965 | 625,503 |
| Events in quadrant C | 5,075,309 | 608,170 |
| Events in quadrant D | 5,459,031 | 590,621 |
| Mode SS | |||
|---|---|---|---|
| Quadrant | BADHDUFLAG | Total packets | Discarded packets |
| A | 0 | 170 | 0 |
| B | 0 | 170 | 0 |
| C | 0 | 170 | 0 |
| D | 0 | 170 | 0 |
| Mode M0 | |||
|---|---|---|---|
| Quadrant | BADHDUFLAG | Total packets | Discarded packets |
| A | 0 | 17241 | 3 |
| B | 0 | 17995 | 2 |
| C | 0 | 20801 | 2 |
| D | 0 | 21638 | 2 |
| Mode M9 | |||
|---|---|---|---|
| Quadrant | BADHDUFLAG | Total packets | Discarded packets |
| A | 0 | 9 | 0 |
| B | 0 | 9 | 0 |
| C | 0 | 9 | 0 |
| D | 0 | 9 | 0 |
| Quadrant | Total seconds | Saturated seconds | Saturation percentage |
|---|---|---|---|
| A | 8214 | 343 | 4.175797% |
| B | 8214 | 406 | 4.942781% |
| C | 8214 | 319 | 3.883613% |
| D | 8214 | 459 | 5.588020% |
Noise dominated data is calculated using 1-second bins in cleaned event files. If a bin has >2000 counts, and if more than 50% of those come from <1% of pixels, then it is considered to be noise-dominated and hence unusable.
| Quadrant | # 1 sec bins | Bins with >0 counts | Bins with >2000 counts | High rate bins dominated by noise | Noise dominated (total time) | Noise dominated (detector-on time) | Marked lightcurve |
|---|---|---|---|---|---|---|---|
| A | 9135 | 8215 | 4 | 4 | 0.04% | 0.05% | 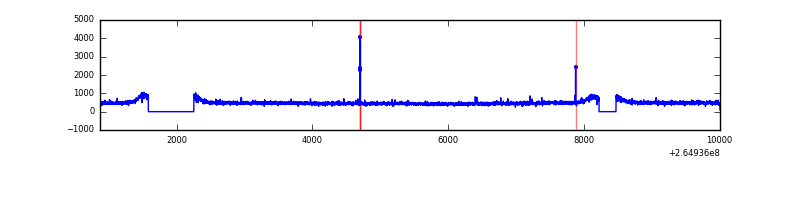 |
| B | 9135 | 8215 | 37 | 37 | 0.41% | 0.45% | 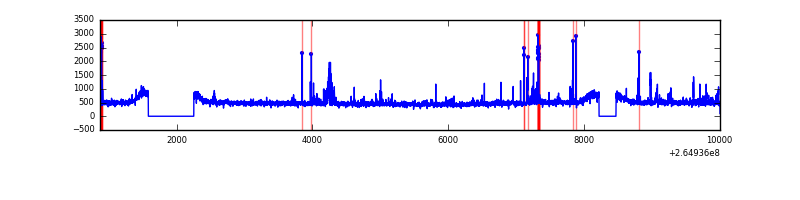 |
| C | 9135 | 8215 | 1 | 1 | 0.01% | 0.01% | 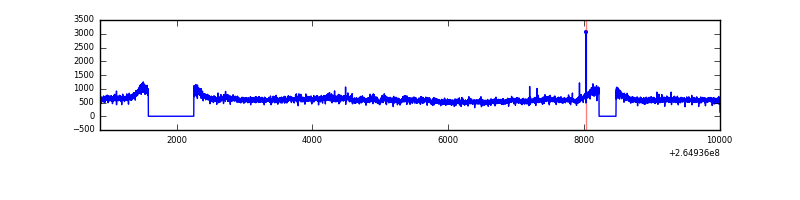 |
| D | 9135 | 8215 | 173 | 173 | 1.89% | 2.11% | 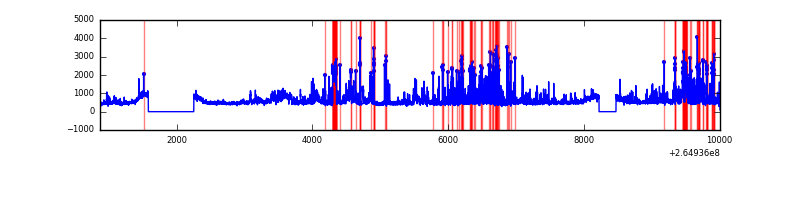 |
Top three noisy pixels from each quadrant. If the there are fewer than three noisy pixels in the level2.evt file, extra rows are filled as -1
| Pixel properties | Quadrant properties | ||||||
|---|---|---|---|---|---|---|---|
| Quadrant | DetID | PixID | Counts | Sigma | Mean | Median | Sigma |
| A | 12 | 189 | 28615 | 132.44 | 1024 | 999 | 208.5 |
| A | 15 | 69 | 9268 | 39.66 | 1024 | 999 | 208.5 |
| A | 0 | 226 | 9060 | 38.66 | 1024 | 999 | 208.5 |
| B | 0 | 229 | 191299 | 971.11 | 1020 | 992 | 196.0 |
| B | 0 | 189 | 53687 | 268.89 | 1020 | 992 | 196.0 |
| B | 15 | 201 | 25503 | 125.08 | 1020 | 992 | 196.0 |
| C | 3 | 233 | 1154695 | 4992.98 | 996 | 1001 | 231.1 |
| C | 3 | 232 | 14672 | 59.17 | 996 | 1001 | 231.1 |
| C | 3 | 234 | 11916 | 47.24 | 996 | 1001 | 231.1 |
| D | 5 | 222 | 950159 | 4021.05 | 991 | 965 | 236.1 |
| D | 1 | 52 | 412482 | 1743.3 | 991 | 965 | 236.1 |
| D | 12 | 110 | 137450 | 578.19 | 991 | 965 | 236.1 |
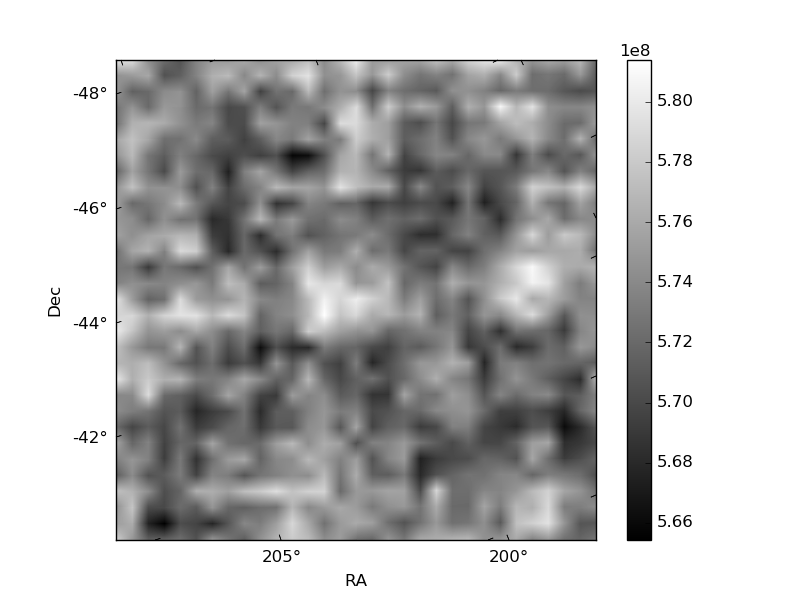
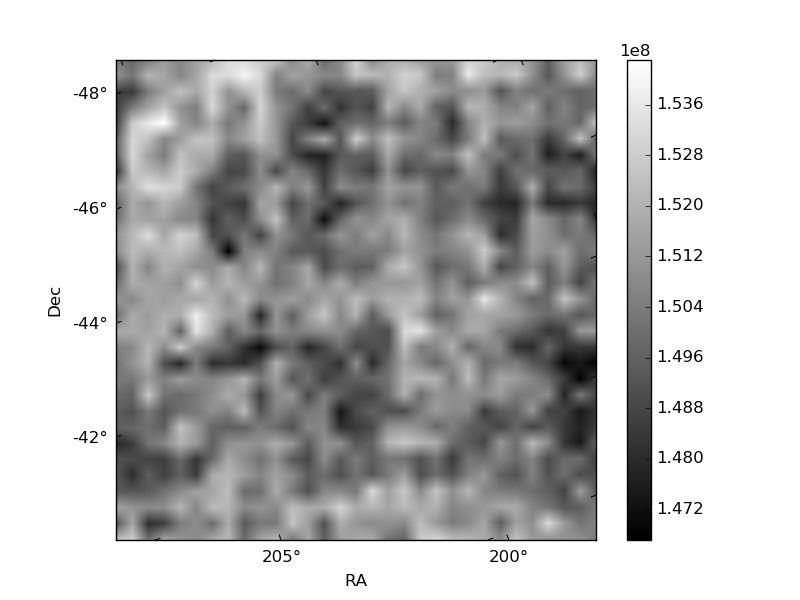
Histogram calculated using DETX and DETY for each event in the final _common_clean file
| Quadrant A | 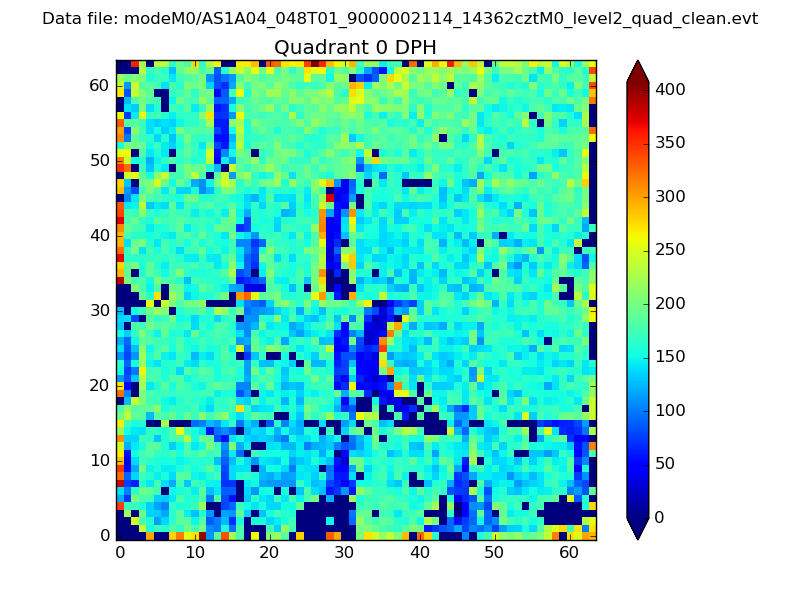 |
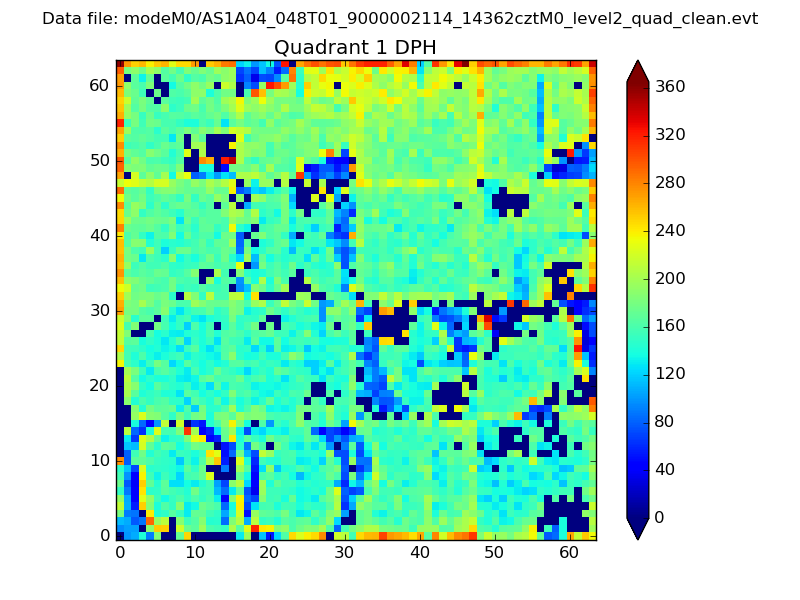 |
Quadrant B |
|---|---|---|---|
| Quadrant D |  |
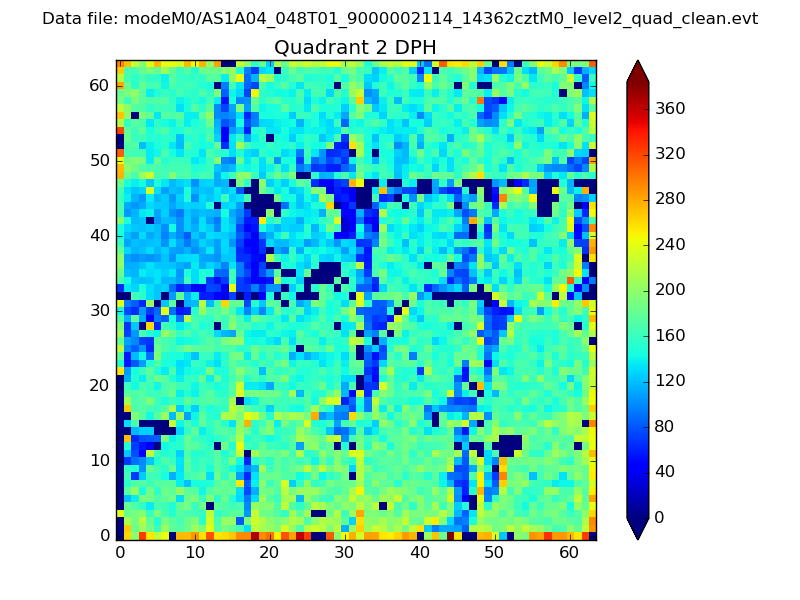 |
Quadrant C |
| Plot type | Count rate plots | Images |
|---|---|---|
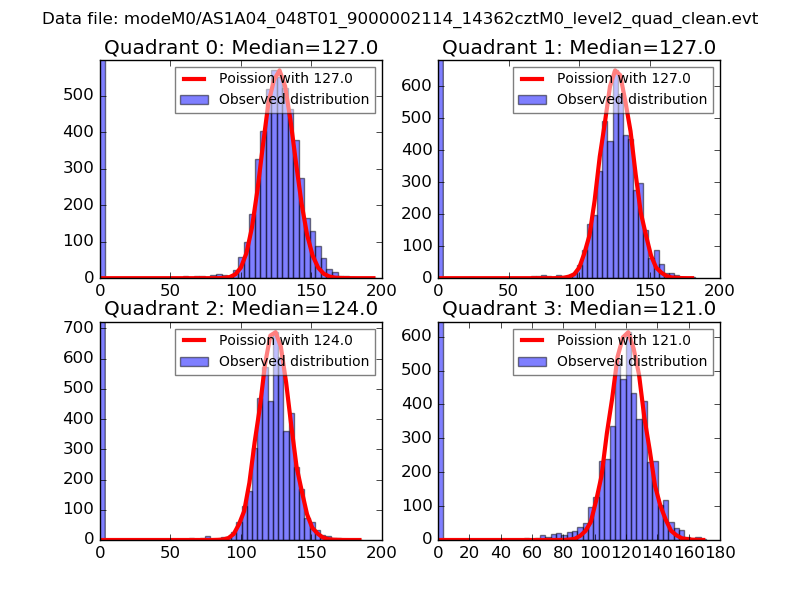
| Comparison with Poisson distribution Blue bars denote a histogram of data divided into 1 sec bins. Red curve is a Poisson curve with rate = median count rate of data. |
 |
 |
| Quadrant-wise count rates Data is divided into 100 sec bins |
 |
|
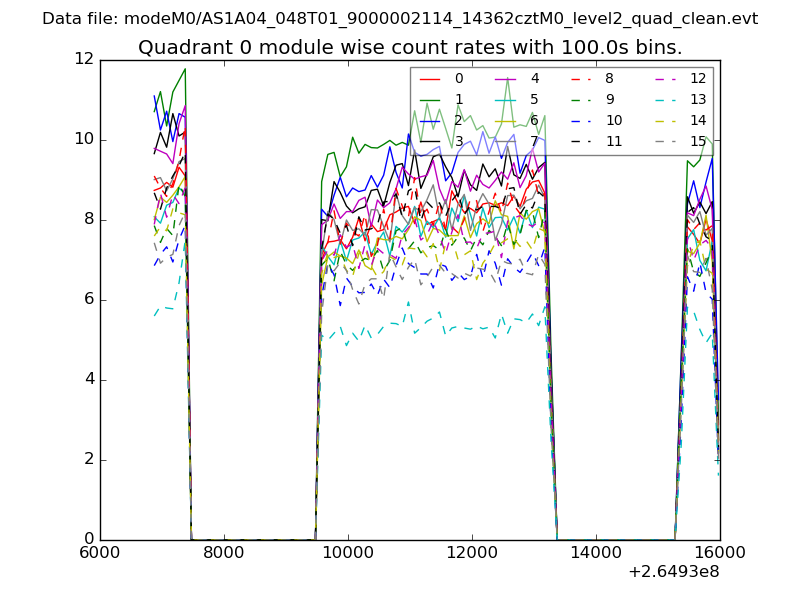
| Module-wise count rates for Quadrant A Data is divided into 100 sec bins |
 |
 |
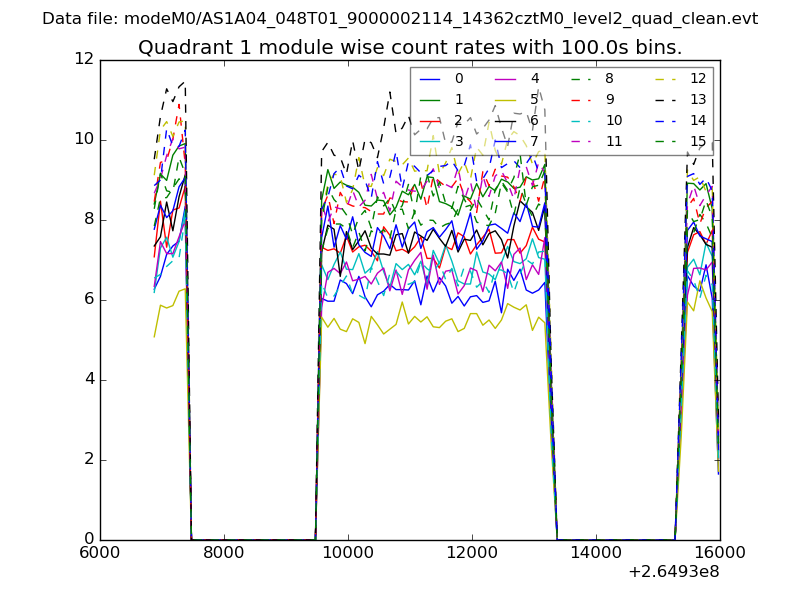
| Module-wise count rates for Quadrant B Data is divided into 100 sec bins |
 |
 |
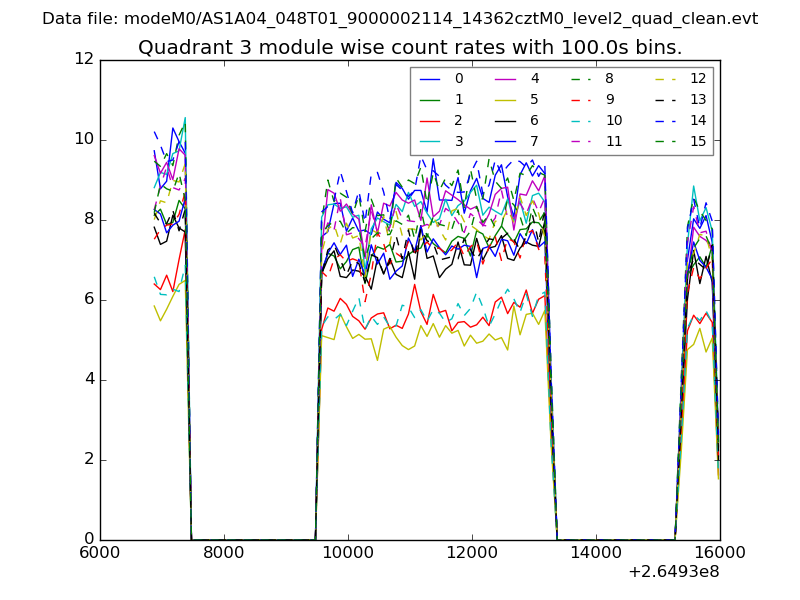
| Module-wise count rates for Quadrant C Data is divided into 100 sec bins |
 |
 |
| Module-wise count rates for Quadrant D Data is divided into 100 sec bins |
 |
 |
| Parameter | Plot |
|---|---|
| CZT HV Monitor | 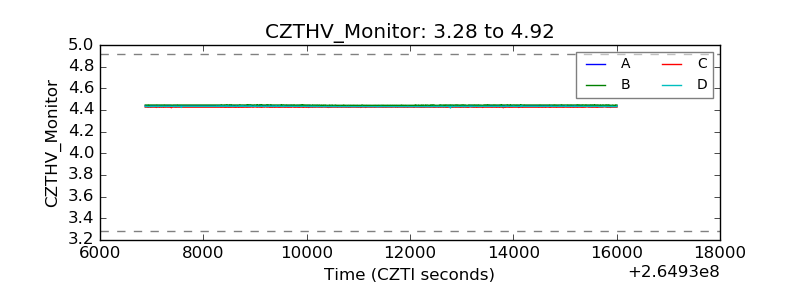 |
| D_VDD | 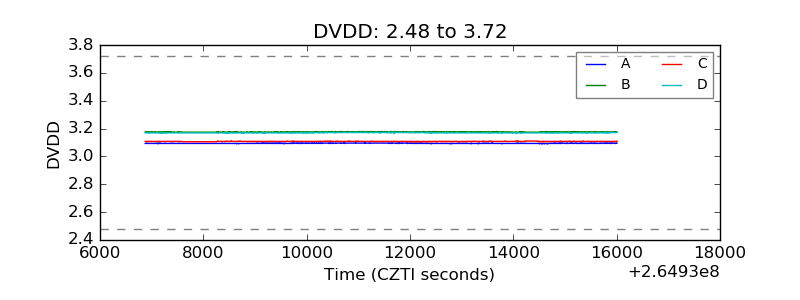 |
| Temperature 1 | 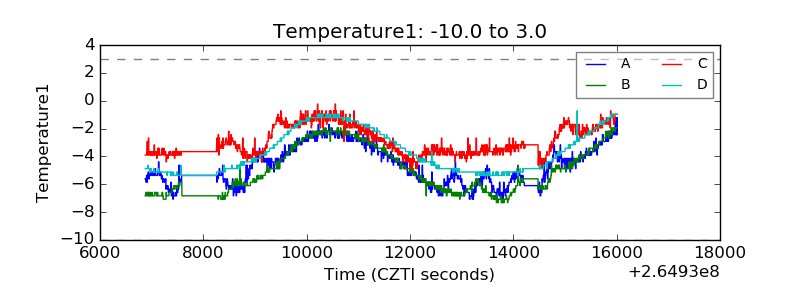 |
| Veto HV Monitor | 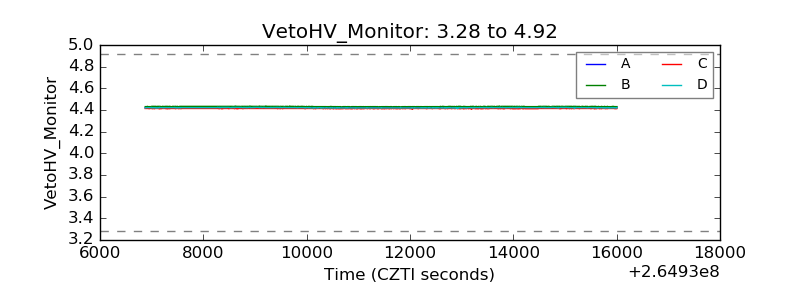 |
| Veto LLD | 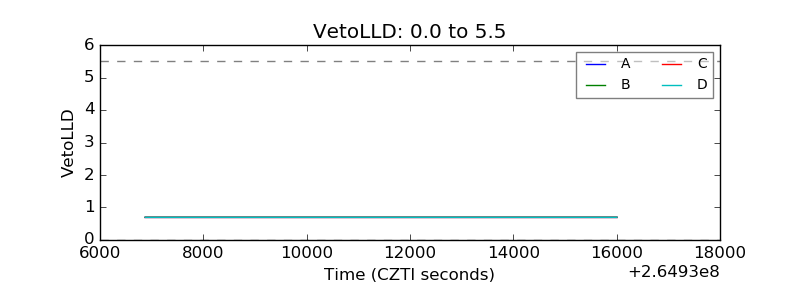 |
| Alpha Counter | 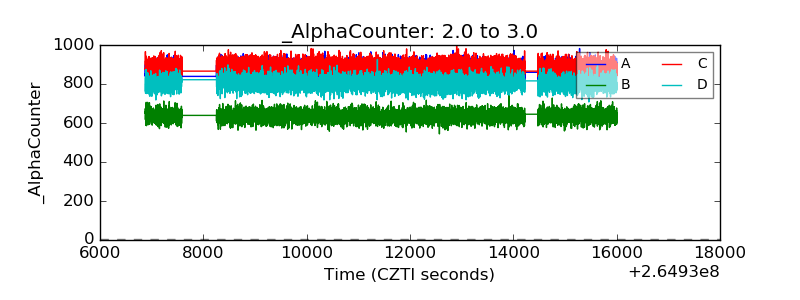 |
| _CPM_Rate | 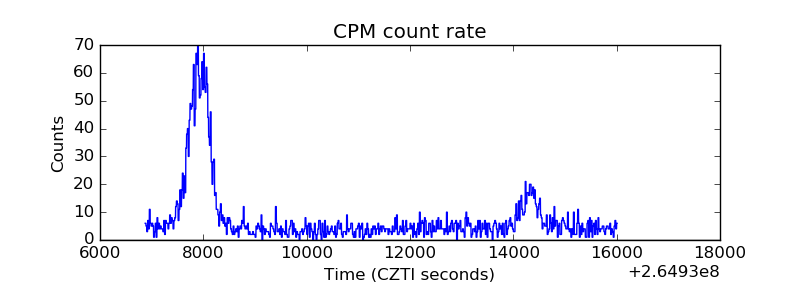 |
| CZT Counter | 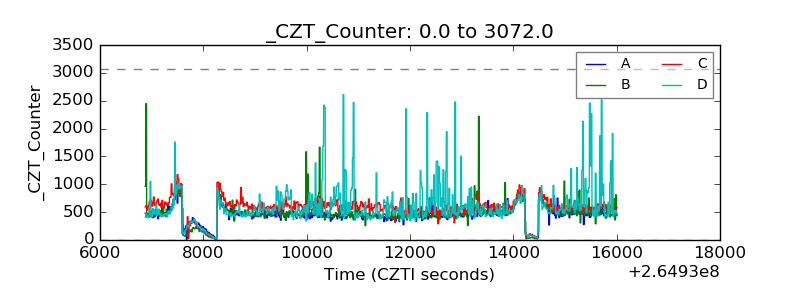 |
| +2.5 Volts monitor |  |
| +5 Volts monitor |  |
| _ROLL_ROT |  |
| _Roll_DEC | 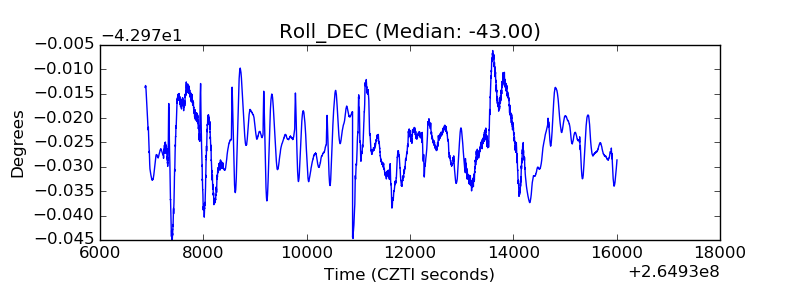 |
| _Roll_RA | 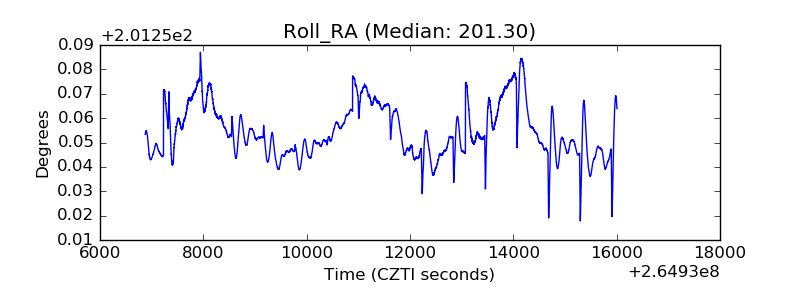 |
| Veto Counter | 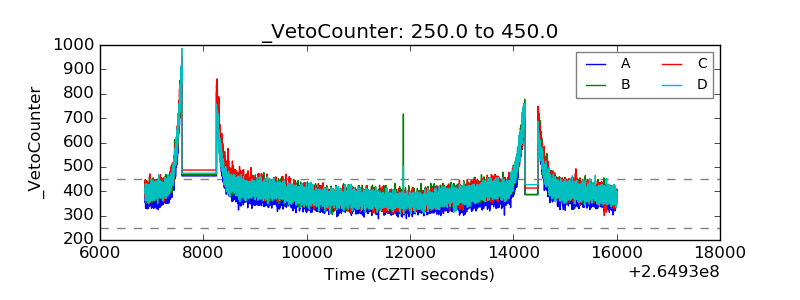 |