| Param | Original file | Final file |
|---|---|---|
| Filename | modeM0/AS1A04_048T01_9000002114_14366cztM0_level2.evt | modeM0/AS1A04_048T01_9000002114_14366cztM0_level2_quad_clean.evt |
| Size (bytes) | 168,186,240 | 38,050,560 |
| Size | 160.4 MB | 36.3 MB |
| Events in quadrant A | 1,201,256 | 254,101 |
| Events in quadrant B | 1,130,097 | 256,348 |
| Events in quadrant C | 1,144,111 | 248,620 |
| Events in quadrant D | 1,474,572 | 242,116 |
| Mode SS | |||
|---|---|---|---|
| Quadrant | BADHDUFLAG | Total packets | Discarded packets |
| A | 0 | 42 | 0 |
| B | 0 | 42 | 0 |
| C | 0 | 42 | 0 |
| D | 0 | 42 | 0 |
| Mode M0 | |||
|---|---|---|---|
| Quadrant | BADHDUFLAG | Total packets | Discarded packets |
| A | 0 | 4901 | 0 |
| B | 0 | 4689 | 0 |
| C | 0 | 4575 | 0 |
| D | 0 | 5919 | 0 |
| Quadrant | Total seconds | Saturated seconds | Saturation percentage |
|---|---|---|---|
| A | 2076 | 11 | 0.529865% |
| B | 2076 | 7 | 0.337187% |
| C | 2076 | 0 | 0.000000% |
| D | 2076 | 27 | 1.300578% |
Noise dominated data is calculated using 1-second bins in cleaned event files. If a bin has >2000 counts, and if more than 50% of those come from <1% of pixels, then it is considered to be noise-dominated and hence unusable.
| Quadrant | # 1 sec bins | Bins with >0 counts | Bins with >2000 counts | High rate bins dominated by noise | Noise dominated (total time) | Noise dominated (detector-on time) | Marked lightcurve |
|---|---|---|---|---|---|---|---|
| A | 2077 | 2077 | 5 | 5 | 0.24% | 0.24% | 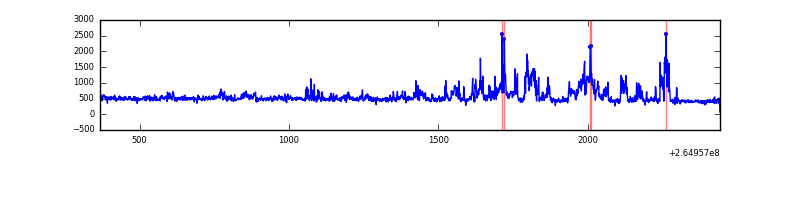 |
| B | 2077 | 2077 | 4 | 4 | 0.19% | 0.19% | 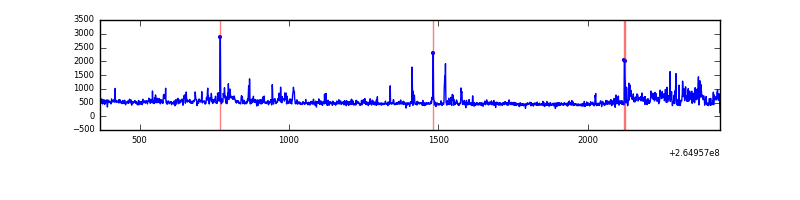 |
| C | 2077 | 2077 | 0 | 0 | 0.00% | 0.00% | 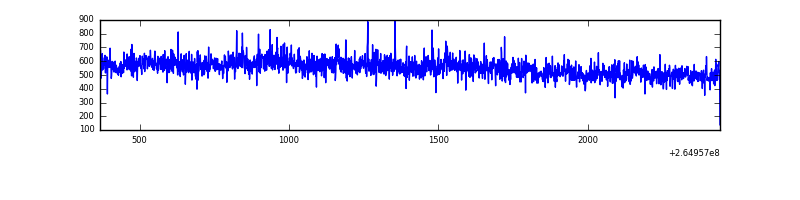 |
| D | 2077 | 2077 | 11 | 11 | 0.53% | 0.53% | 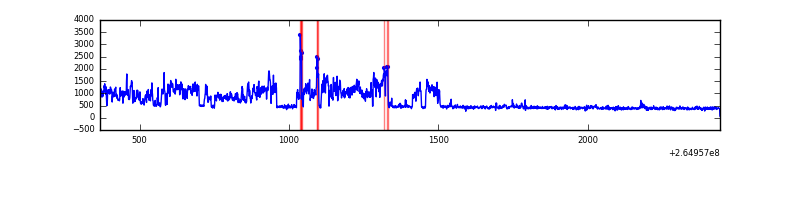 |
Top three noisy pixels from each quadrant. If the there are fewer than three noisy pixels in the level2.evt file, extra rows are filled as -1
| Pixel properties | Quadrant properties | ||||||
|---|---|---|---|---|---|---|---|
| Quadrant | DetID | PixID | Counts | Sigma | Mean | Median | Sigma |
| A | 12 | 189 | 246664 | 4812.04 | 243 | 239 | 51.2 |
| A | 15 | 69 | 10032 | 191.23 | 243 | 239 | 51.2 |
| A | 3 | 1 | 4798 | 89.03 | 243 | 239 | 51.2 |
| B | 0 | 230 | 74304 | 1527.74 | 240 | 234 | 48.5 |
| B | 0 | 229 | 49172 | 1009.38 | 240 | 234 | 48.5 |
| B | 0 | 189 | 25319 | 517.39 | 240 | 234 | 48.5 |
| C | 3 | 233 | 245035 | 4480.96 | 228 | 229 | 54.6 |
| C | 8 | 128 | 4161 | 71.97 | 228 | 229 | 54.6 |
| C | 8 | 112 | 1950 | 31.5 | 228 | 229 | 54.6 |
| D | 12 | 110 | 537712 | 8428.11 | 231 | 225 | 63.8 |
| D | 2 | 120 | 15223 | 235.18 | 231 | 225 | 63.8 |
| D | 15 | 0 | 13467 | 207.64 | 231 | 225 | 63.8 |
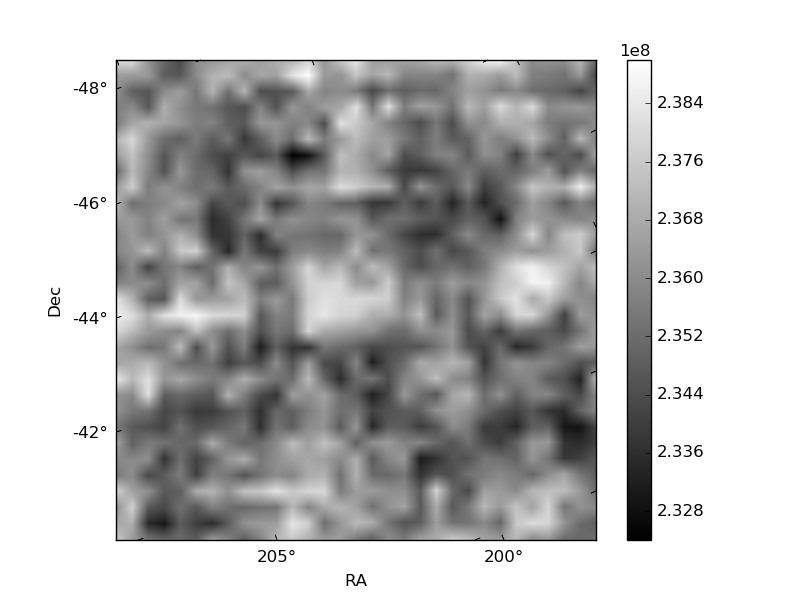
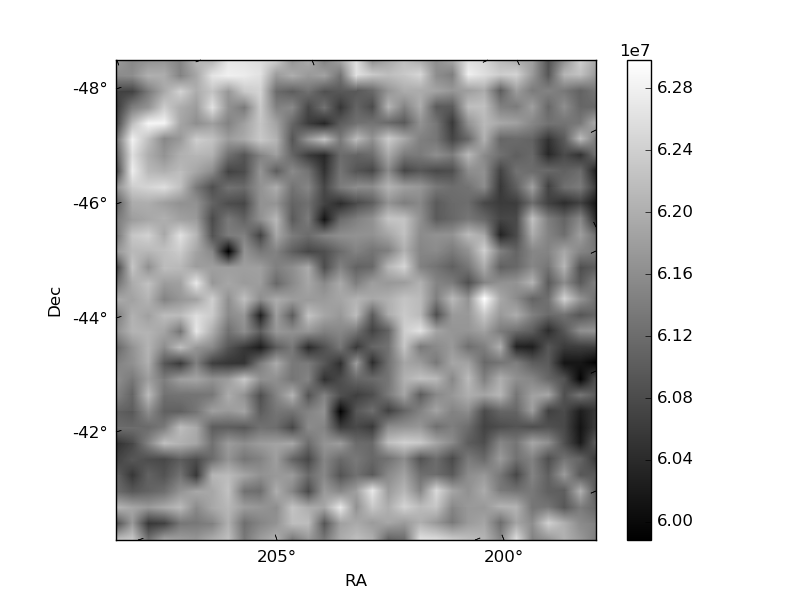
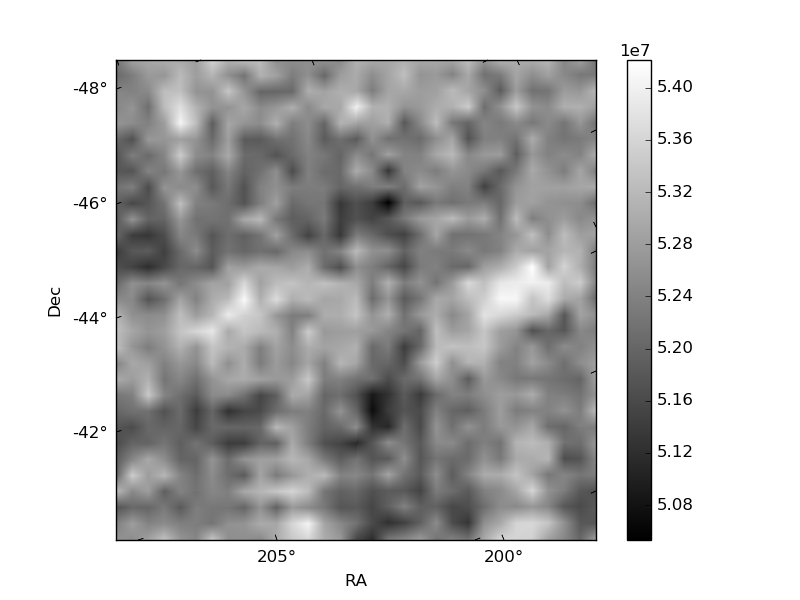
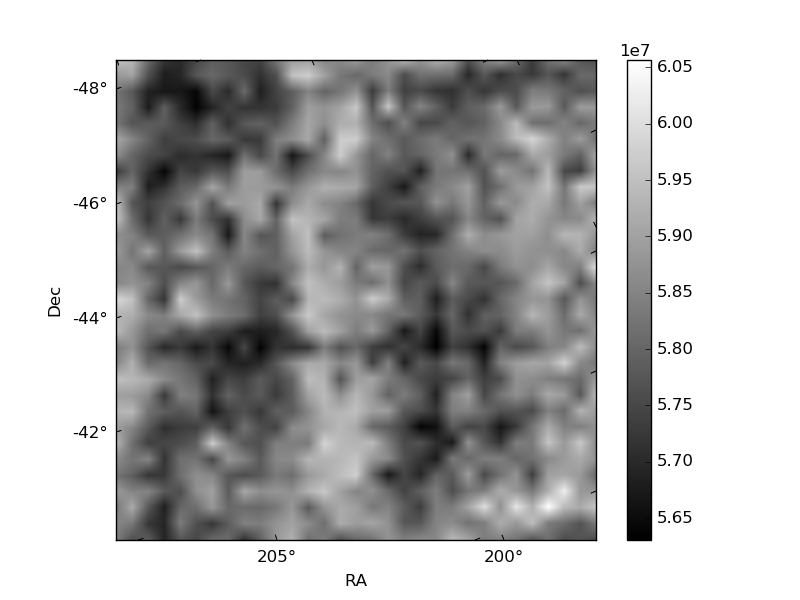
Histogram calculated using DETX and DETY for each event in the final _common_clean file
| Quadrant A | 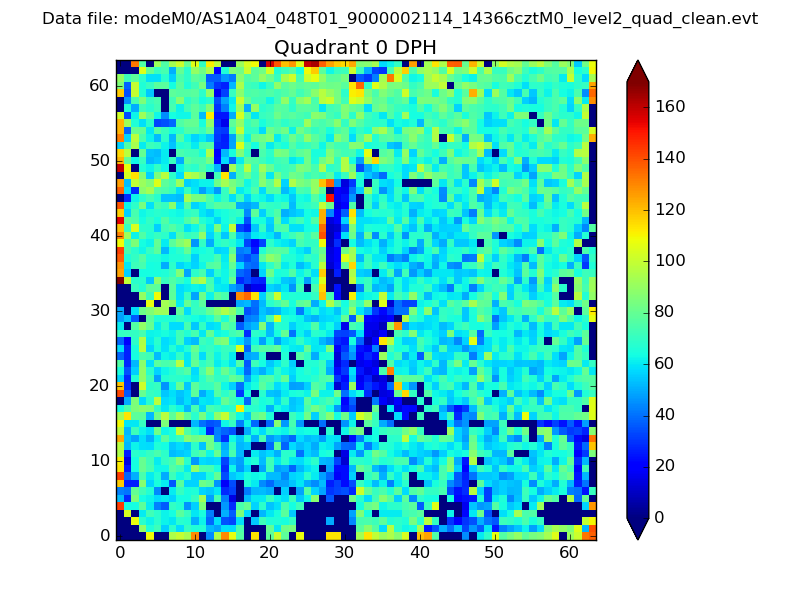 |
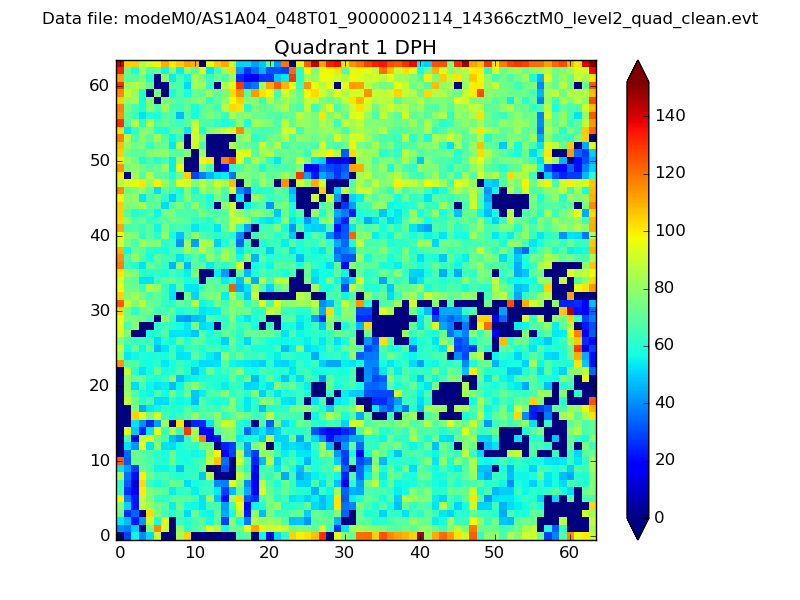 |
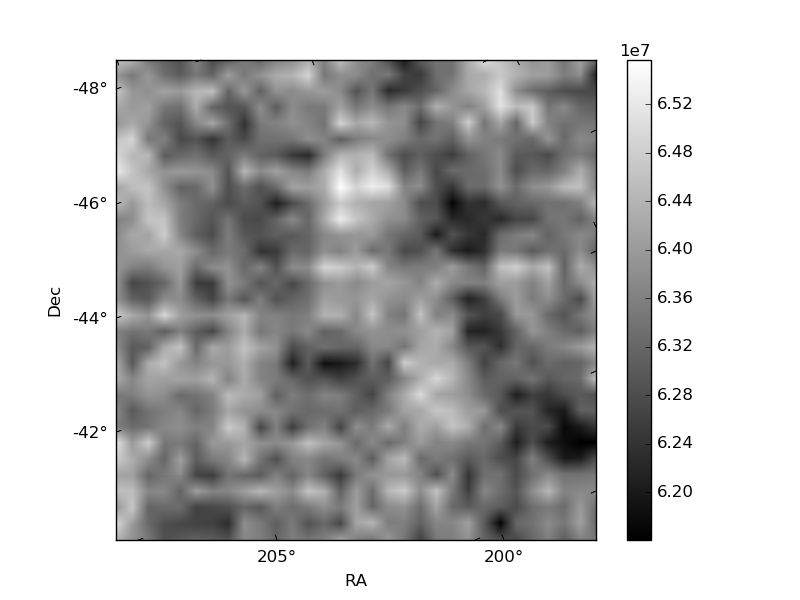
Quadrant B |
|---|---|---|---|
| Quadrant D | 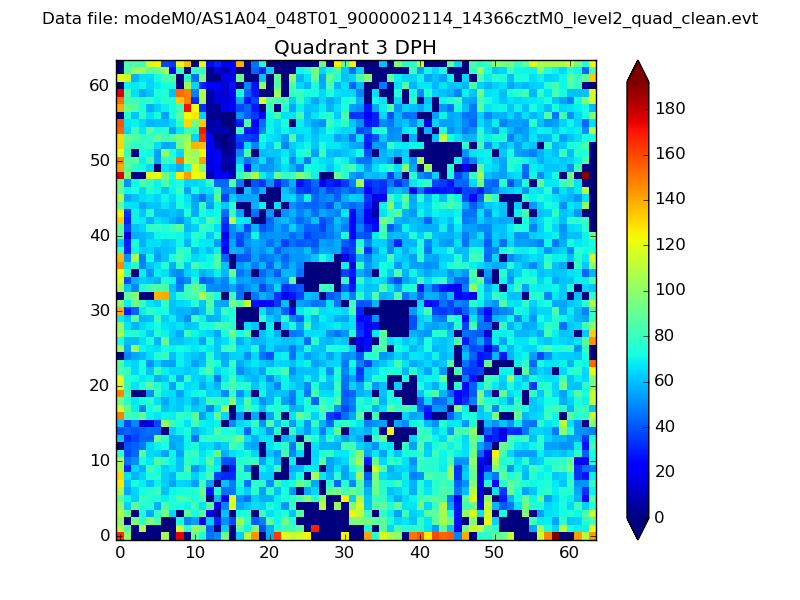 |
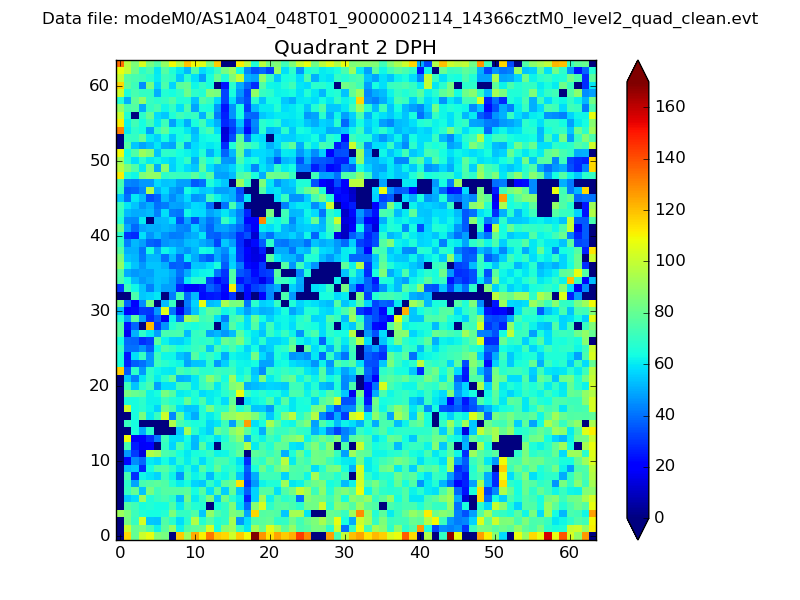 |
Quadrant C |
| Plot type | Count rate plots | Images |
|---|---|---|
| Comparison with Poisson distribution Blue bars denote a histogram of data divided into 1 sec bins. Red curve is a Poisson curve with rate = median count rate of data. |
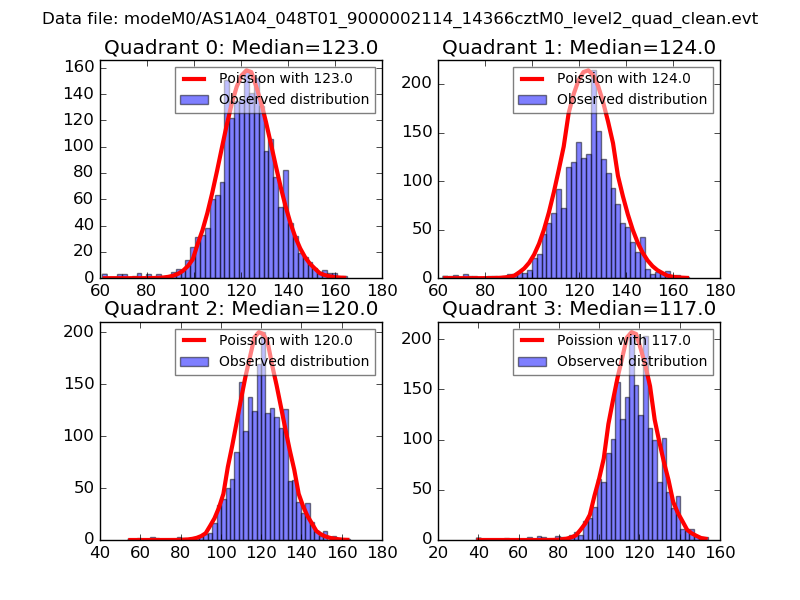 |
 |
| Quadrant-wise count rates Data is divided into 100 sec bins |
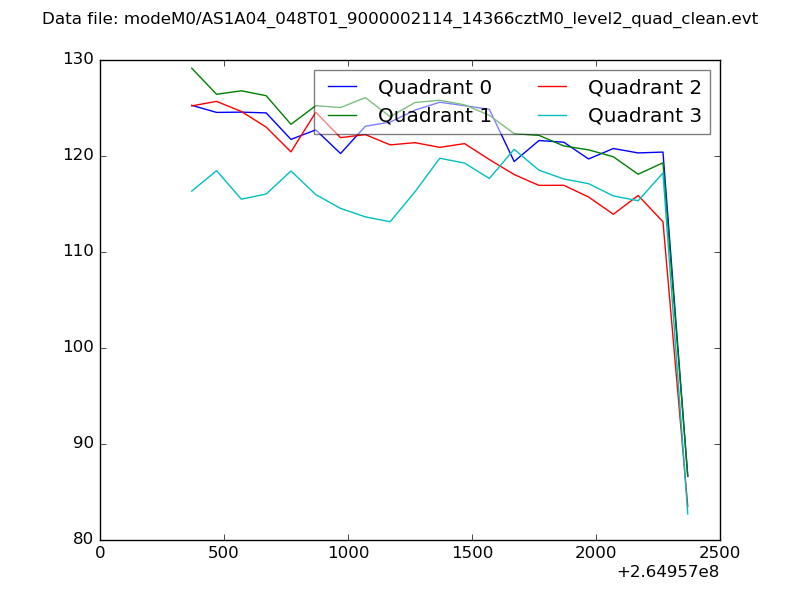 |
|
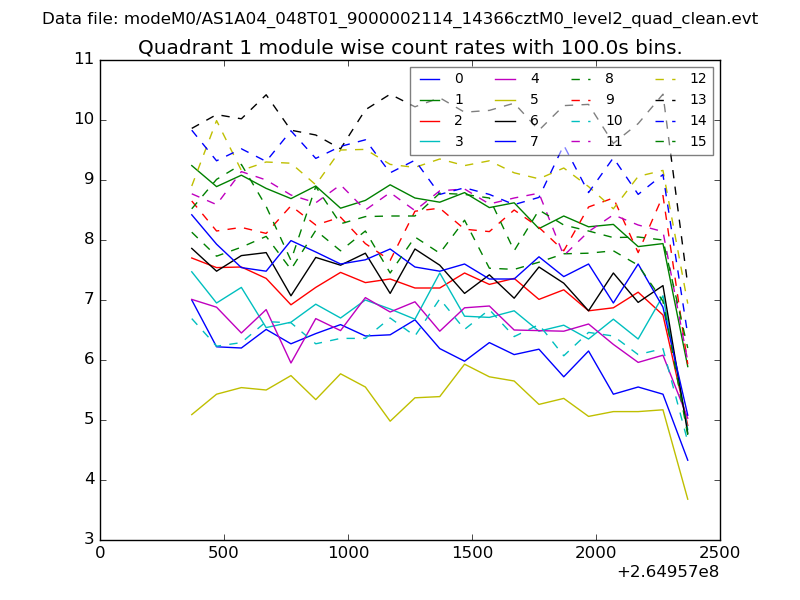
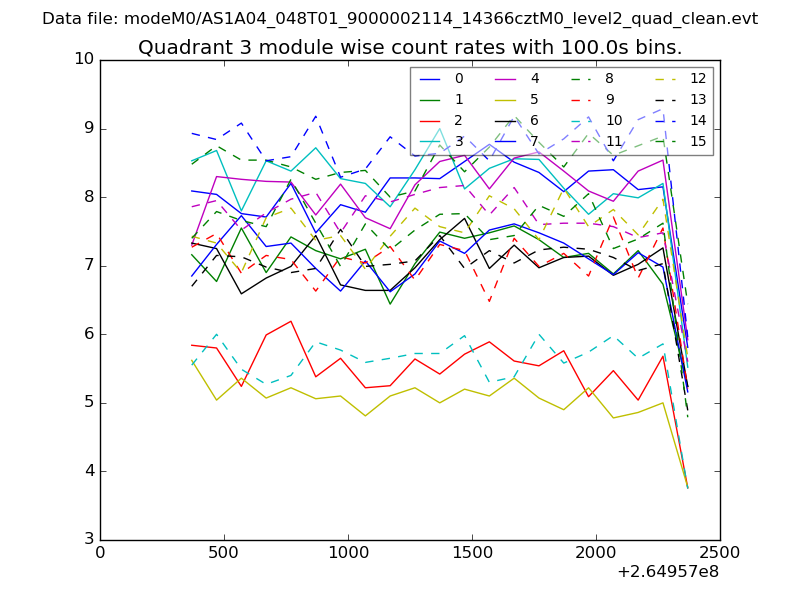
| Module-wise count rates for Quadrant A Data is divided into 100 sec bins |
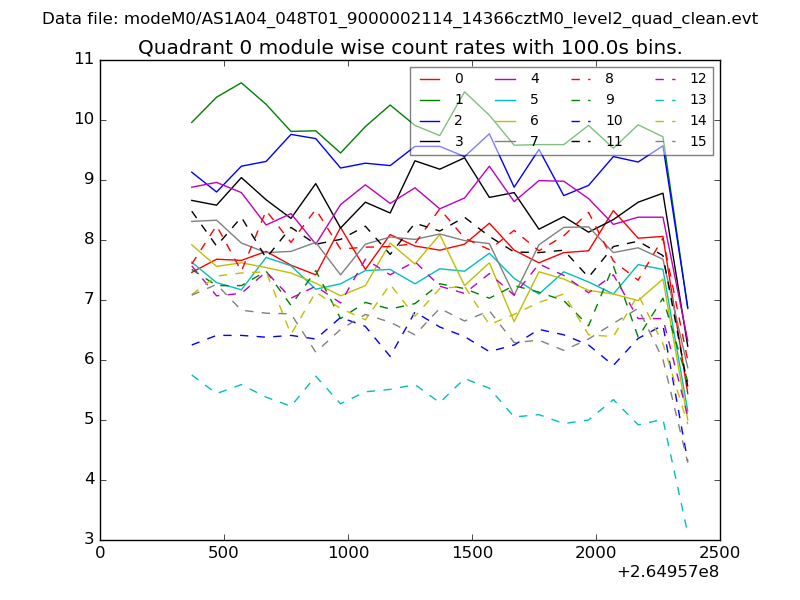 |
 |
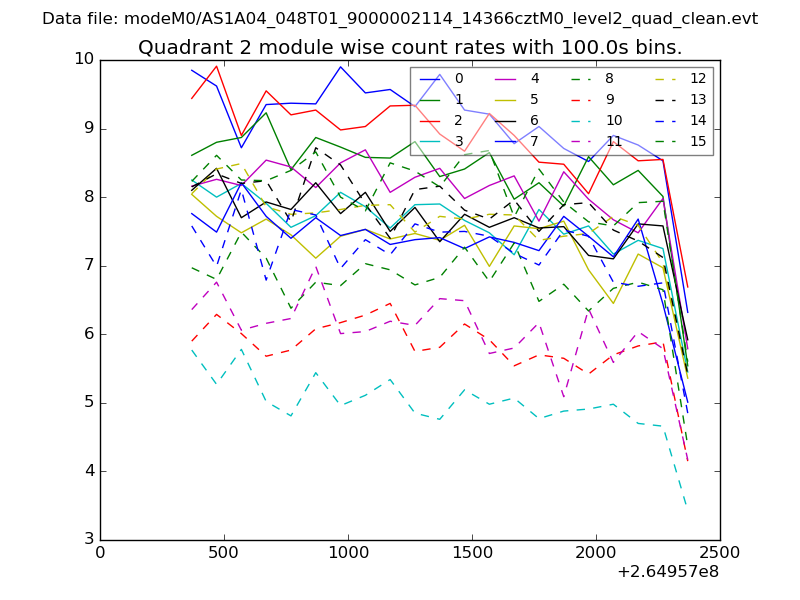
| Module-wise count rates for Quadrant B Data is divided into 100 sec bins |
 |
 |
| Module-wise count rates for Quadrant C Data is divided into 100 sec bins |
 |
 |
| Module-wise count rates for Quadrant D Data is divided into 100 sec bins |
 |
 |
| Parameter | Plot |
|---|---|
| CZT HV Monitor | 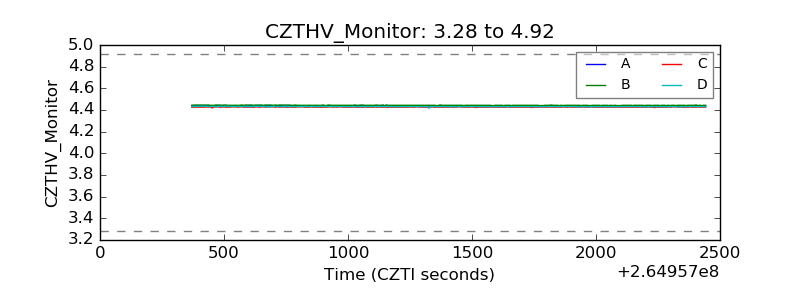 |
| D_VDD | 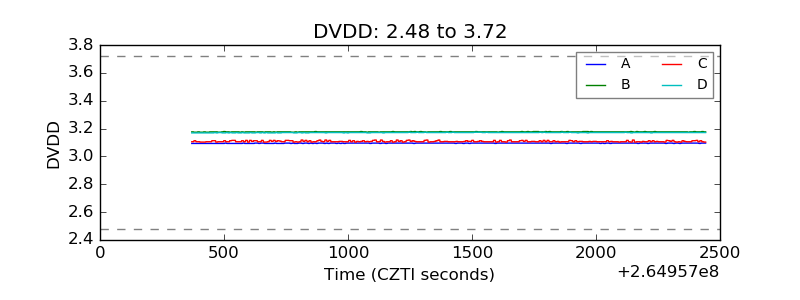 |
| Temperature 1 | 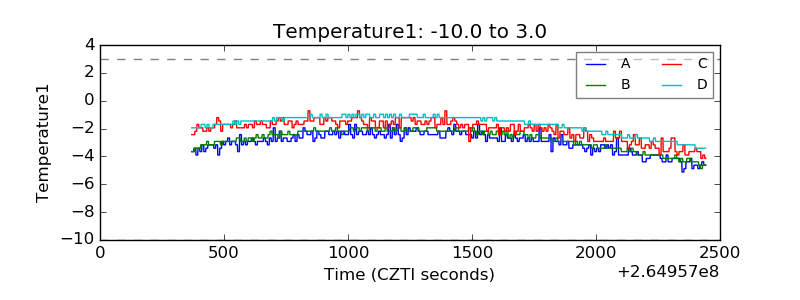 |
| Veto HV Monitor | 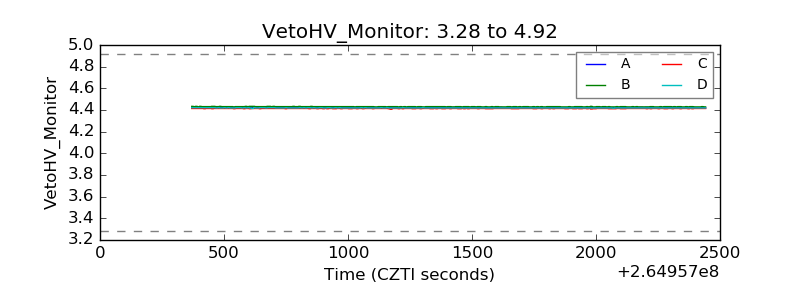 |
| Veto LLD | 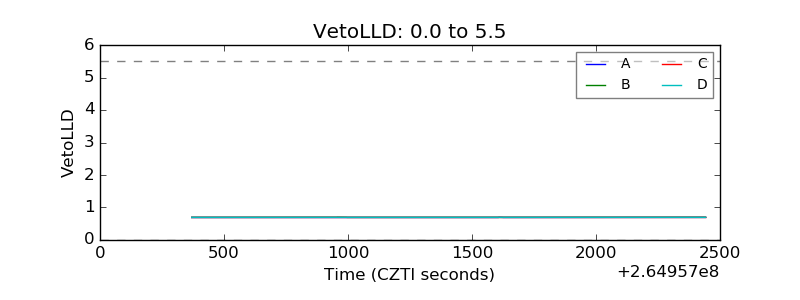 |
| Alpha Counter | 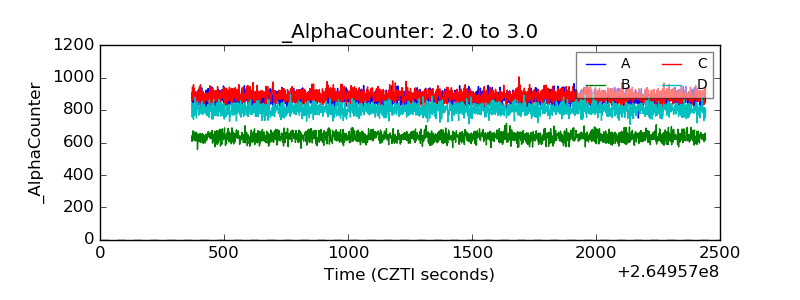 |
| _CPM_Rate | 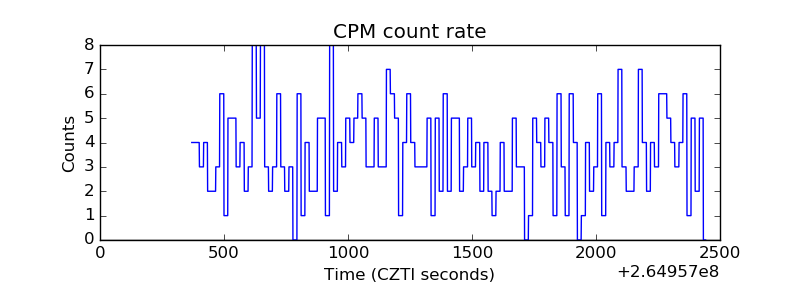 |
| CZT Counter | 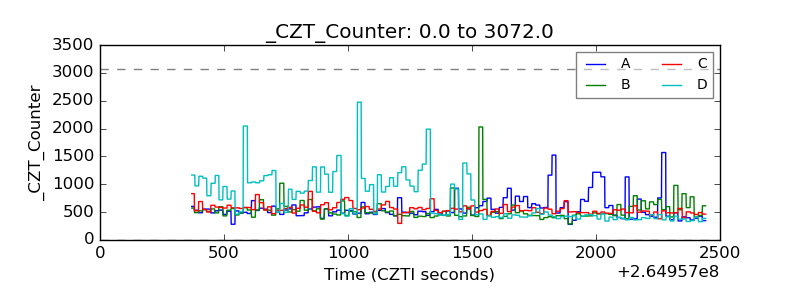 |
| +2.5 Volts monitor |  |
| +5 Volts monitor |  |
| _ROLL_ROT | 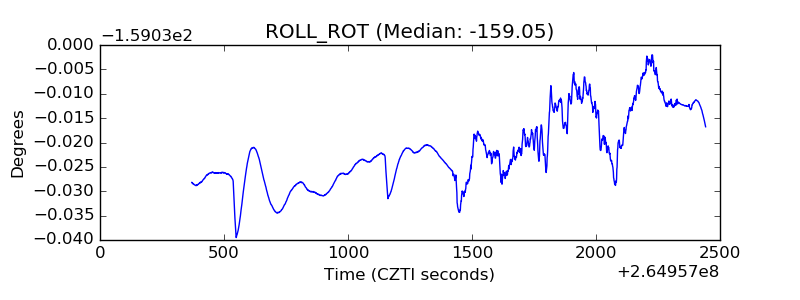 |
| _Roll_DEC | 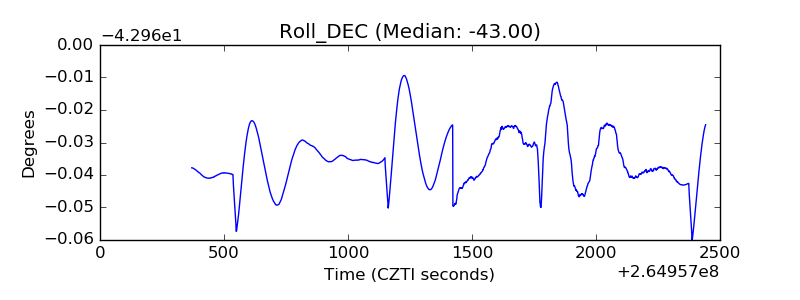 |
| _Roll_RA | 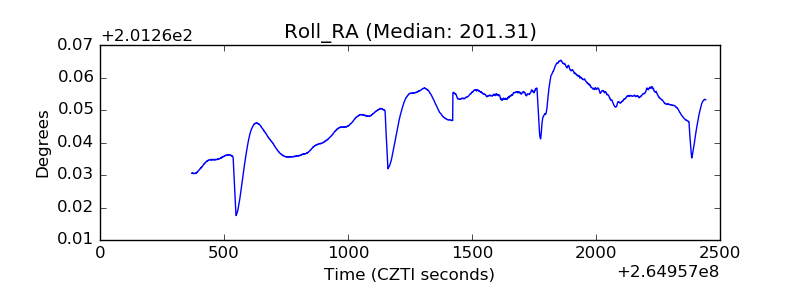 |
| Veto Counter | 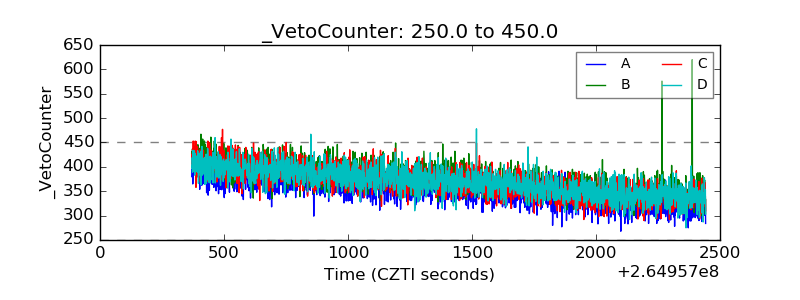 |