| Param | Original file | Final file |
|---|---|---|
| Filename | modeM0/AS1G08_028T01_9000002112cztM0_level2.fits | modeM0/AS1G08_028T01_9000002112cztM0_level2_quad_clean.evt |
| Size (bytes) | 248,742,720 | 261,961,920 |
| Size | 237.2 MB | 249.8 MB |
| Events in quadrant A | 1,519,052 | 1,620,015 |
| Events in quadrant B | 1,423,922 | 1,561,249 |
| Events in quadrant C | 1,474,356 | 1,516,621 |
| Events in quadrant D | 1,259,894 | 1,380,497 |
| Mode M9 | |||
|---|---|---|---|
| Quadrant | BADHDUFLAG | Total packets | Discarded packets |
| A | 0 | 25 | 0 |
| B | 0 | 25 | 0 |
| C | 0 | 25 | 0 |
| D | 0 | 25 | 0 |
| Mode M0 | |||
|---|---|---|---|
| Quadrant | BADHDUFLAG | Total packets | Discarded packets |
| A | 0 | 56489 | 0 |
| B | 0 | 64286 | 0 |
| C | 0 | 57849 | 0 |
| D | 0 | 75631 | 0 |
| Mode SS | |||
|---|---|---|---|
| Quadrant | BADHDUFLAG | Total packets | Discarded packets |
| A | 0 | 548 | 0 |
| B | 0 | 548 | 0 |
| C | 0 | 548 | 0 |
| D | 0 | 548 | 0 |
| Quadrant | Total seconds | Saturated seconds | Saturation percentage |
|---|---|---|---|
| A | 26980 | 316 | 1.171238% |
| B | 26980 | 1090 | 4.040030% |
| C | 26980 | 305 | 1.130467% |
| D | 26980 | 1742 | 6.456635% |
Noise dominated data is calculated using 1-second bins in cleaned event files. If a bin has >2000 counts, and if more than 50% of those come from <1% of pixels, then it is considered to be noise-dominated and hence unusable.
| Quadrant | # 1 sec bins | Bins with >0 counts | Bins with >2000 counts | High rate bins dominated by noise | Noise dominated (total time) | Noise dominated (detector-on time) | Marked lightcurve |
|---|---|---|---|---|---|---|---|
| A | 29410 | 26977 | 0 | 0 | 0.00% | 0.00% | 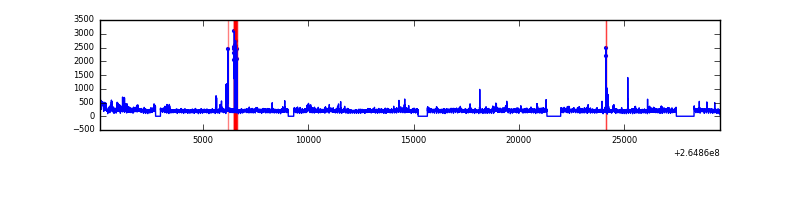 |
| B | 29410 | 26949 | 0 | 0 | 0.00% | 0.00% |  |
| C | 29410 | 26978 | 0 | 0 | 0.00% | 0.00% |  |
| D | 29410 | 26952 | 0 | 0 | 0.00% | 0.00% | 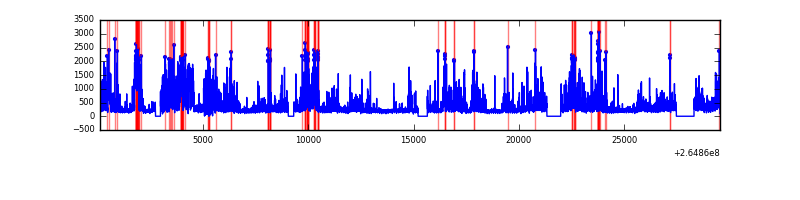 |
Top three noisy pixels from each quadrant. If the there are fewer than three noisy pixels in the level2.evt file, extra rows are filled as -1
| Pixel properties | Quadrant properties | ||||||
|---|---|---|---|---|---|---|---|
| Quadrant | DetID | PixID | Counts | Sigma | Mean | Median | Sigma |
| A | 14 | 188 | 1544 | 11.81 | 393 | 367 | 99.6 |
| A | 0 | 29 | 1479 | 11.16 | 393 | 367 | 99.6 |
| A | 14 | 204 | 1299 | 9.35 | 393 | 367 | 99.6 |
| B | 2 | 9 | 1239 | 11.49 | 374 | 355 | 77.0 |
| B | 3 | 80 | 953 | 7.77 | 374 | 355 | 77.0 |
| B | 5 | 232 | 950 | 7.73 | 374 | 355 | 77.0 |
| C | 12 | 241 | 1067 | 6.89 | 389 | 360 | 102.7 |
| C | 2 | 191 | 1032 | 6.55 | 389 | 360 | 102.7 |
| C | 9 | 233 | 1031 | 6.54 | 389 | 360 | 102.7 |
| D | 7 | 5 | 945 | 6.29 | 358 | 325 | 98.5 |
| D | 1 | 3 | 919 | 6.03 | 358 | 325 | 98.5 |
| D | 3 | 14 | 904 | 5.88 | 358 | 325 | 98.5 |
Histogram calculated using DETX and DETY for each event in the final _common_clean file
| Quadrant A | 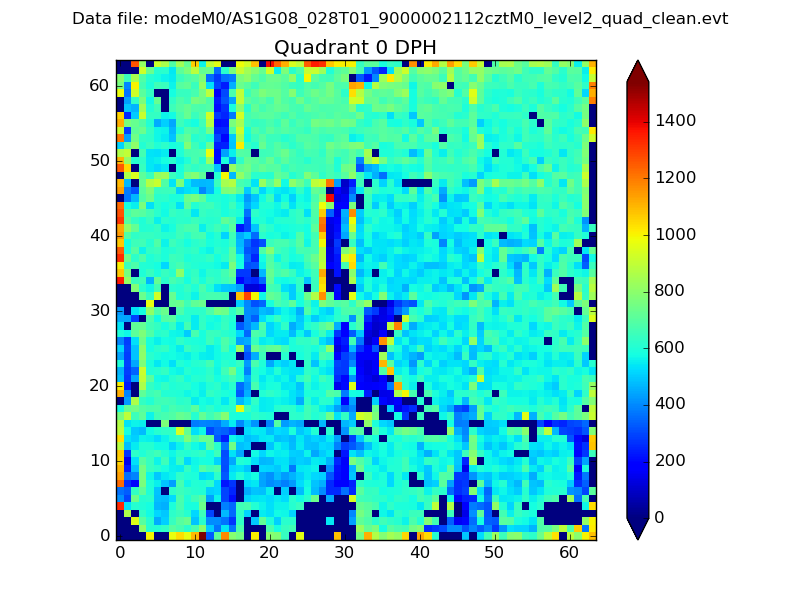 |
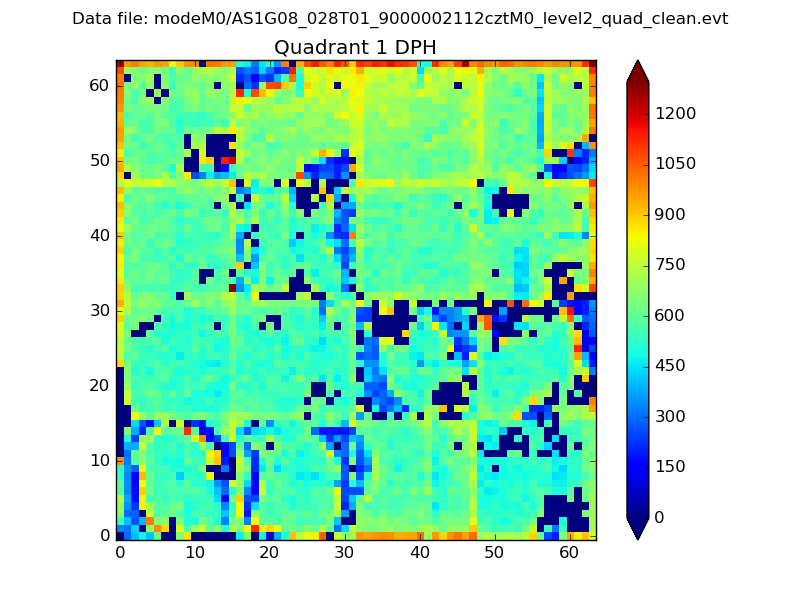 |
Quadrant B |
|---|---|---|---|
| Quadrant D |  |
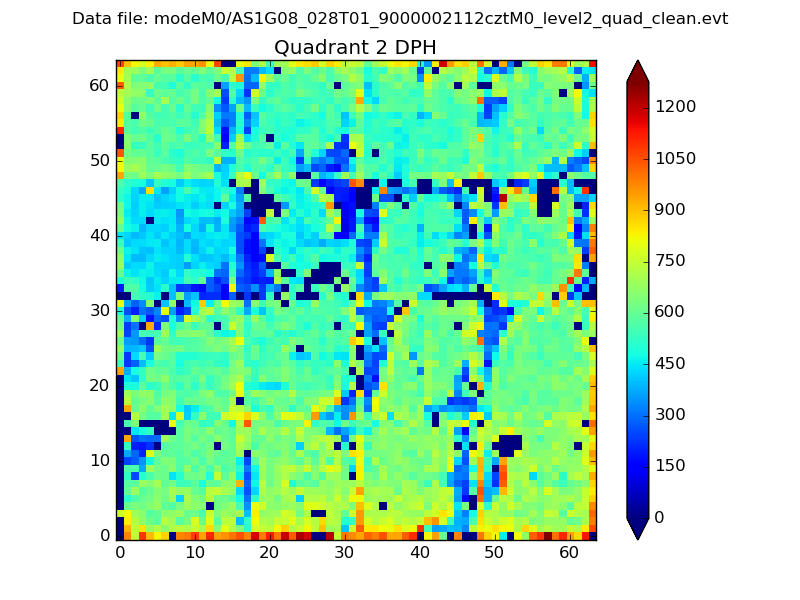 |
Quadrant C |
| Plot type | Count rate plots | Images |
|---|---|---|
| Comparison with Poisson distribution Blue bars denote a histogram of data divided into 1 sec bins. Red curve is a Poisson curve with rate = median count rate of data. |
 |
 |
| Quadrant-wise count rates Data is divided into 100 sec bins |
 |
|
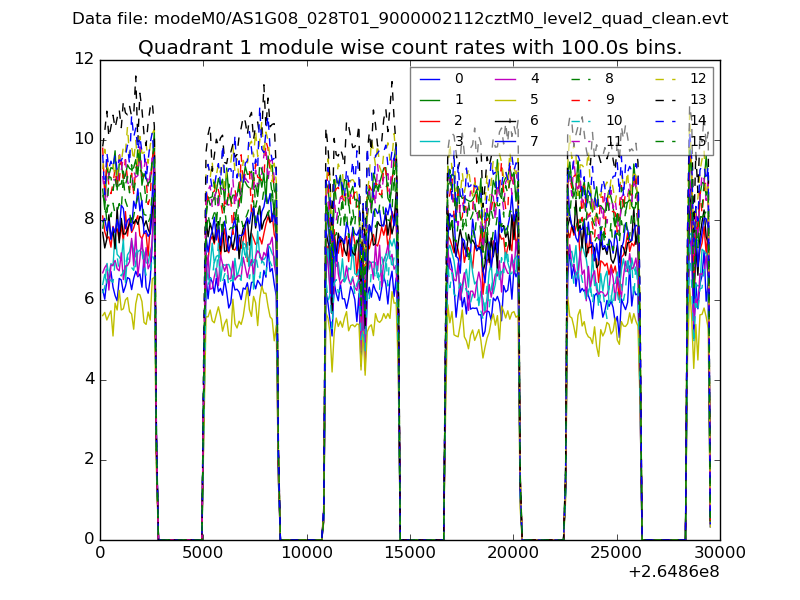
| Module-wise count rates for Quadrant A Data is divided into 100 sec bins |
 |
 |
| Module-wise count rates for Quadrant B Data is divided into 100 sec bins |
 |
 |
| Module-wise count rates for Quadrant C Data is divided into 100 sec bins |
 |
 |
| Module-wise count rates for Quadrant D Data is divided into 100 sec bins |
 |
 |
| Parameter | Plot |
|---|---|
| CZT HV Monitor |  |
| D_VDD | 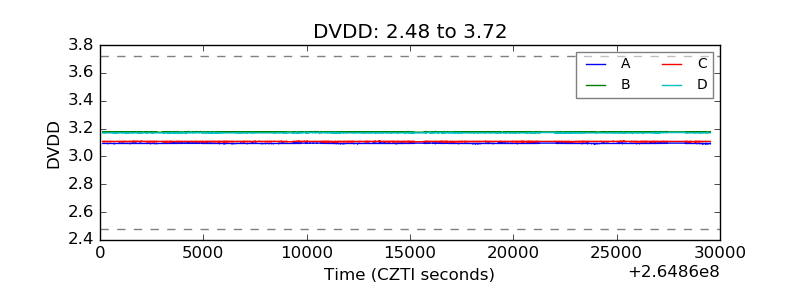 |
| Temperature 1 | 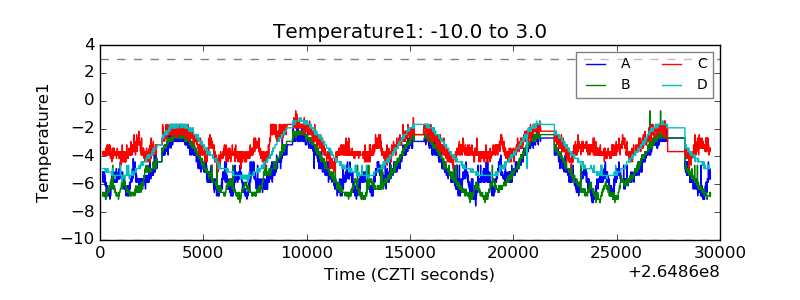 |
| Veto HV Monitor |  |
| Veto LLD |  |
| Alpha Counter |  |
| _CPM_Rate |  |
| CZT Counter |  |
| +2.5 Volts monitor | 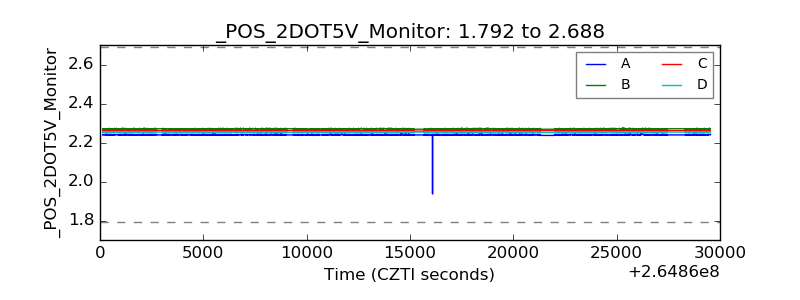 |
| +5 Volts monitor |  |
| _ROLL_ROT |  |
| _Roll_DEC |  |
| _Roll_RA |  |
| Veto Counter |  |