| Param | Original file | Final file |
|---|---|---|
| Filename | modeM0/AS1G08_028T01_9000002112_14348cztM0_level2.evt | modeM0/AS1G08_028T01_9000002112_14348cztM0_level2_quad_clean.evt |
| Size (bytes) | 371,687,040 | 54,480,960 |
| Size | 354.5 MB | 52.0 MB |
| Events in quadrant A | 2,188,035 | 345,992 |
| Events in quadrant B | 2,138,112 | 346,347 |
| Events in quadrant C | 2,231,920 | 338,953 |
| Events in quadrant D | 4,415,177 | 324,917 |
| Mode M9 | |||
|---|---|---|---|
| Quadrant | BADHDUFLAG | Total packets | Discarded packets |
| A | 0 | 3 | 0 |
| B | 0 | 3 | 0 |
| C | 0 | 3 | 0 |
| D | 0 | 3 | 0 |
| Mode M0 | |||
|---|---|---|---|
| Quadrant | BADHDUFLAG | Total packets | Discarded packets |
| A | 0 | 9226 | 1 |
| B | 0 | 8985 | 0 |
| C | 0 | 8943 | 0 |
| D | 0 | 16018 | 0 |
| Mode SS | |||
|---|---|---|---|
| Quadrant | BADHDUFLAG | Total packets | Discarded packets |
| A | 0 | 84 | 0 |
| B | 0 | 84 | 0 |
| C | 0 | 84 | 0 |
| D | 0 | 84 | 0 |
| Quadrant | Total seconds | Saturated seconds | Saturation percentage |
|---|---|---|---|
| A | 4164 | 91 | 2.185399% |
| B | 4164 | 114 | 2.737752% |
| C | 4164 | 91 | 2.185399% |
| D | 4164 | 745 | 17.891451% |
Noise dominated data is calculated using 1-second bins in cleaned event files. If a bin has >2000 counts, and if more than 50% of those come from <1% of pixels, then it is considered to be noise-dominated and hence unusable.
| Quadrant | # 1 sec bins | Bins with >0 counts | Bins with >2000 counts | High rate bins dominated by noise | Noise dominated (total time) | Noise dominated (detector-on time) | Marked lightcurve |
|---|---|---|---|---|---|---|---|
| A | 4400 | 4165 | 0 | 0 | 0.00% | 0.00% | 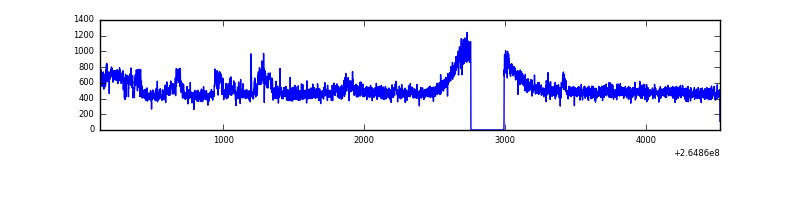 |
| B | 4400 | 4165 | 2 | 2 | 0.05% | 0.05% | 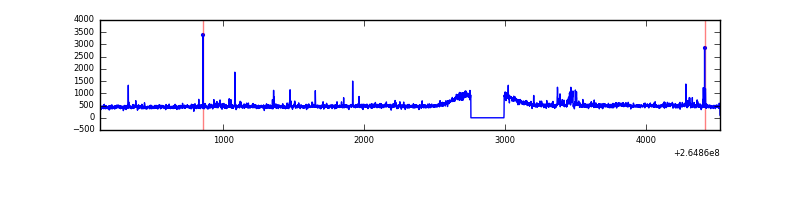 |
| C | 4400 | 4165 | 4 | 4 | 0.09% | 0.10% | 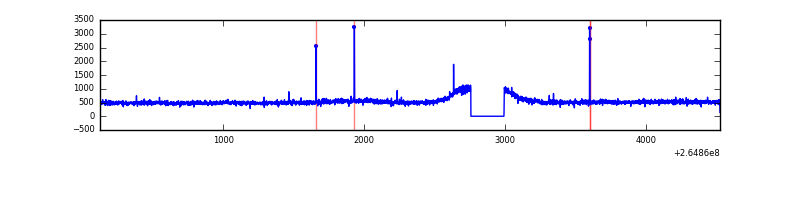 |
| D | 4400 | 4165 | 553 | 553 | 12.57% | 13.28% | 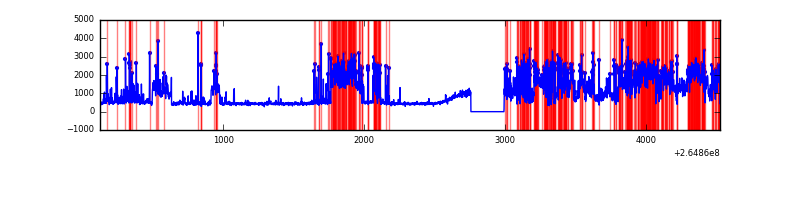 |
Top three noisy pixels from each quadrant. If the there are fewer than three noisy pixels in the level2.evt file, extra rows are filled as -1
| Pixel properties | Quadrant properties | ||||||
|---|---|---|---|---|---|---|---|
| Quadrant | DetID | PixID | Counts | Sigma | Mean | Median | Sigma |
| A | 12 | 189 | 146125 | 1342.02 | 525 | 513 | 108.5 |
| A | 8 | 15 | 20639 | 185.49 | 525 | 513 | 108.5 |
| A | 0 | 226 | 4573 | 37.42 | 525 | 513 | 108.5 |
| B | 0 | 229 | 49204 | 469.79 | 521 | 508 | 103.7 |
| B | 0 | 189 | 24874 | 235.07 | 521 | 508 | 103.7 |
| B | 0 | 214 | 15849 | 148.0 | 521 | 508 | 103.7 |
| C | 3 | 233 | 232618 | 1921.72 | 508 | 511 | 120.8 |
| C | 14 | 234 | 15383 | 123.13 | 508 | 511 | 120.8 |
| C | 6 | 96 | 4754 | 35.13 | 508 | 511 | 120.8 |
| D | 13 | 122 | 1739345 | 14975.34 | 482 | 471 | 116.1 |
| D | 12 | 110 | 498356 | 4287.83 | 482 | 471 | 116.1 |
| D | 2 | 120 | 147362 | 1265.04 | 482 | 471 | 116.1 |
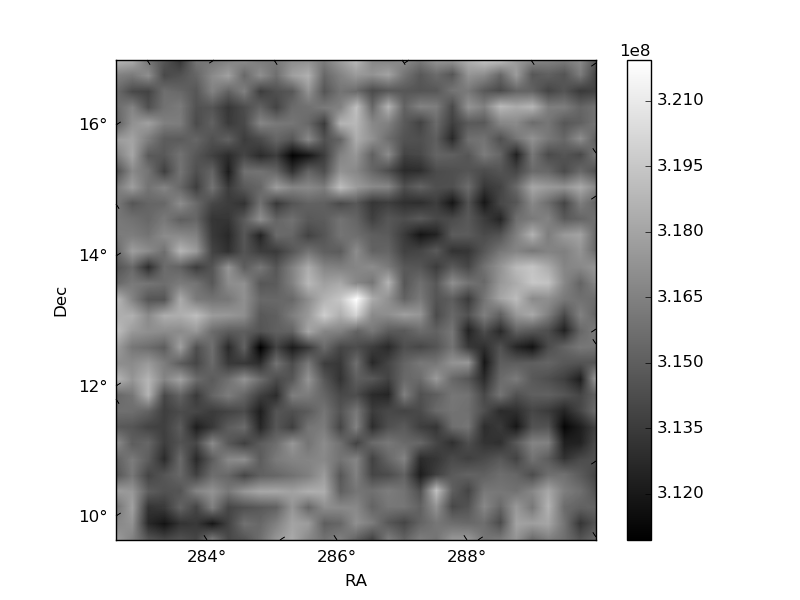
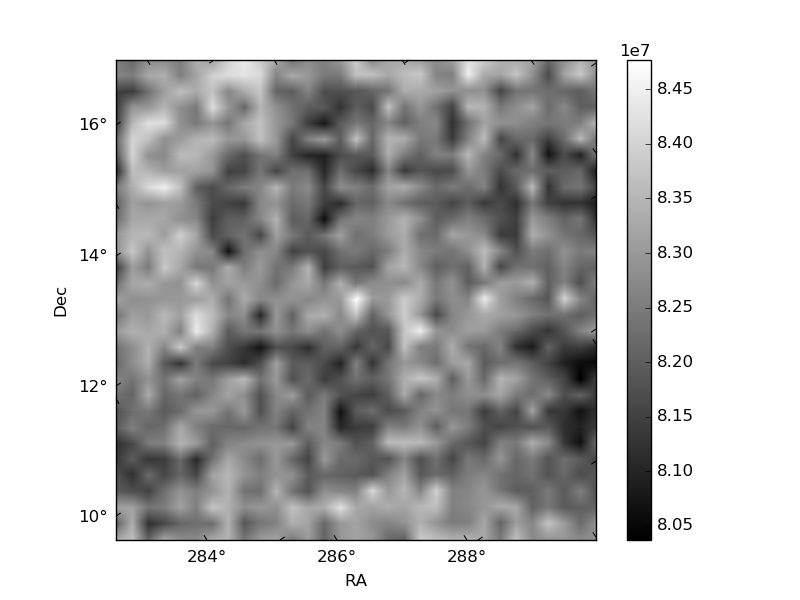
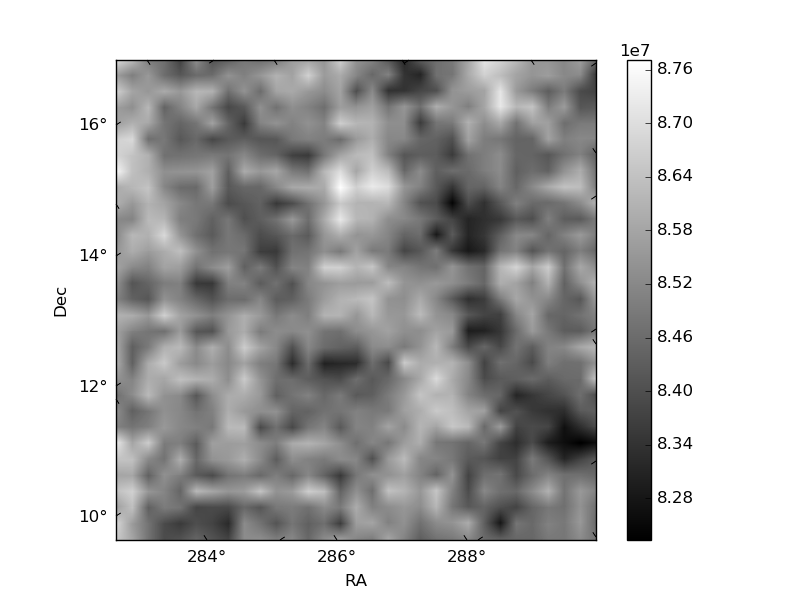
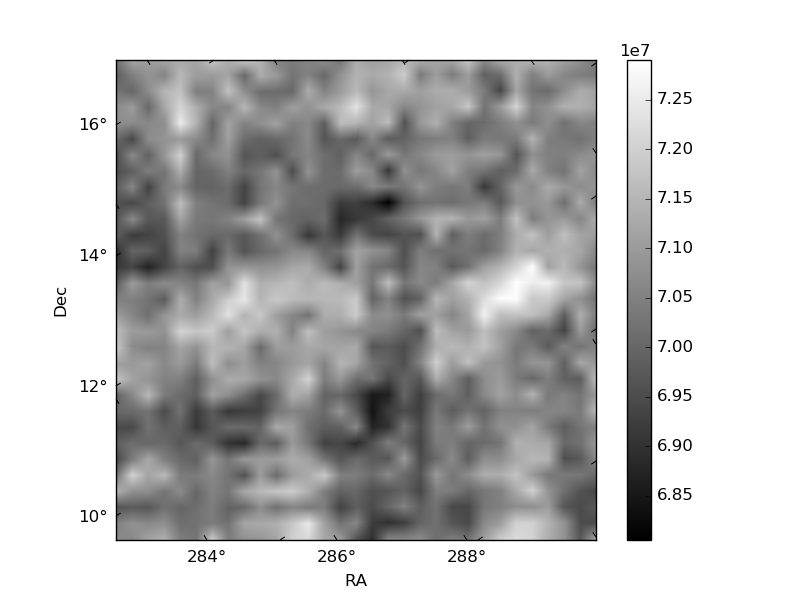
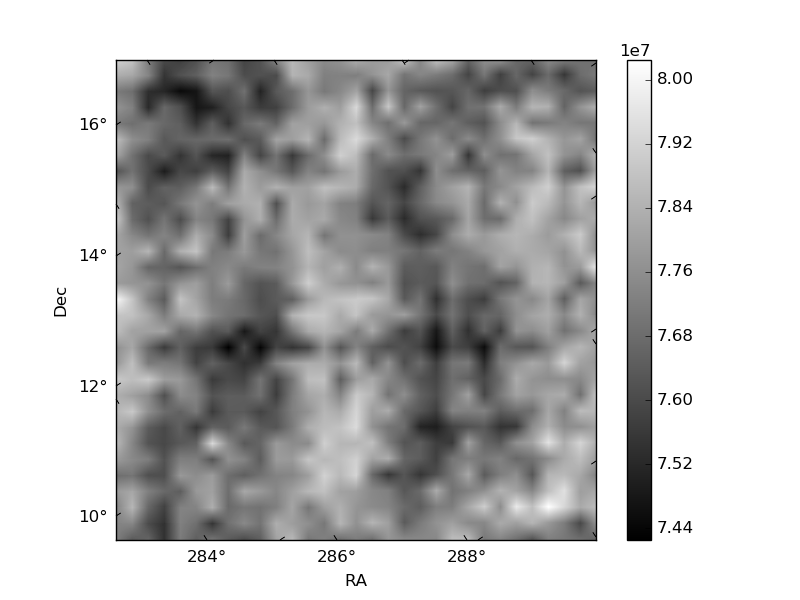
Histogram calculated using DETX and DETY for each event in the final _common_clean file
| Quadrant A | 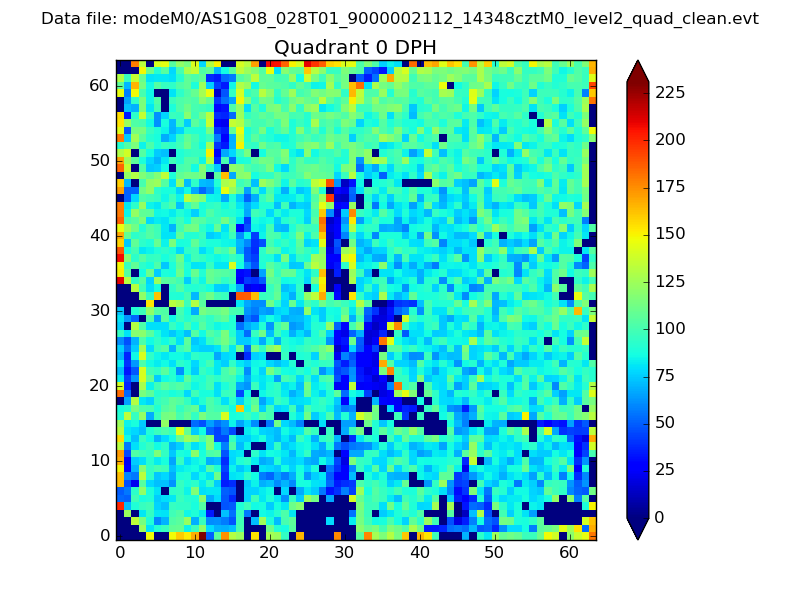 |
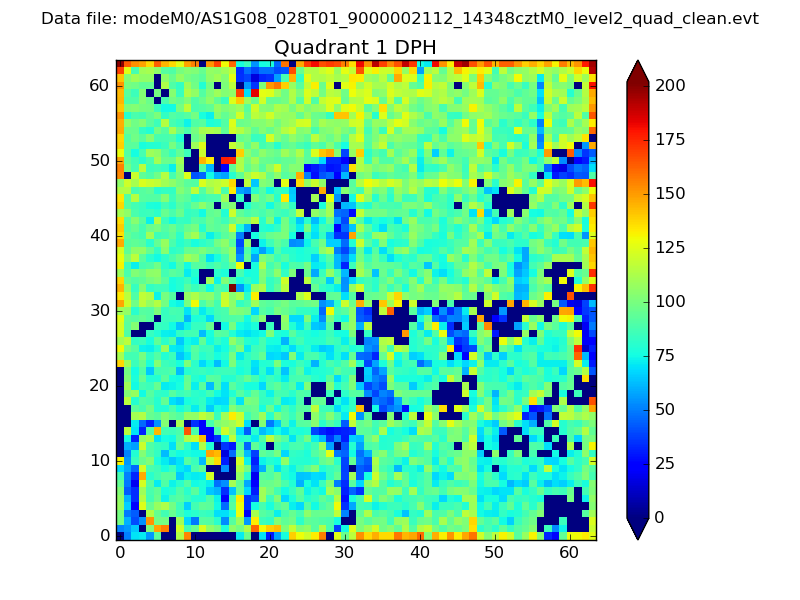 |
Quadrant B |
|---|---|---|---|
| Quadrant D |  |
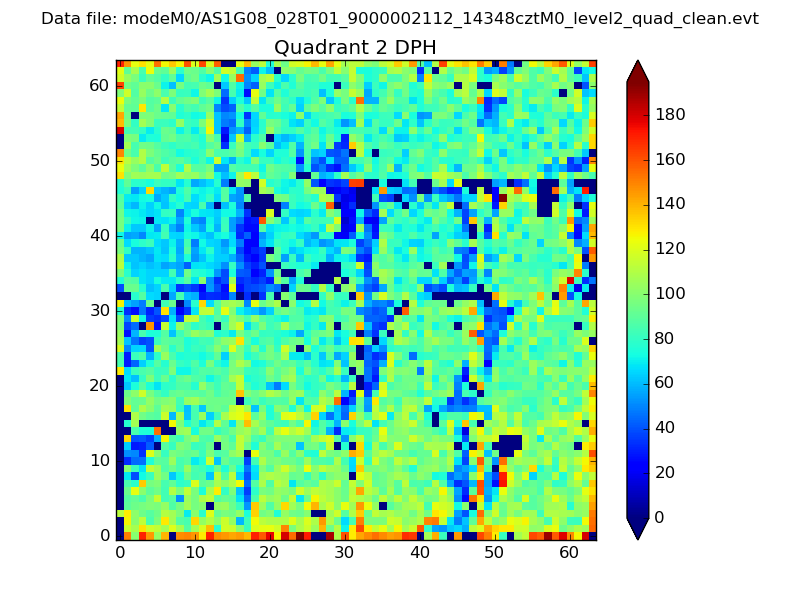 |
Quadrant C |
| Plot type | Count rate plots | Images |
|---|---|---|
| Comparison with Poisson distribution Blue bars denote a histogram of data divided into 1 sec bins. Red curve is a Poisson curve with rate = median count rate of data. |
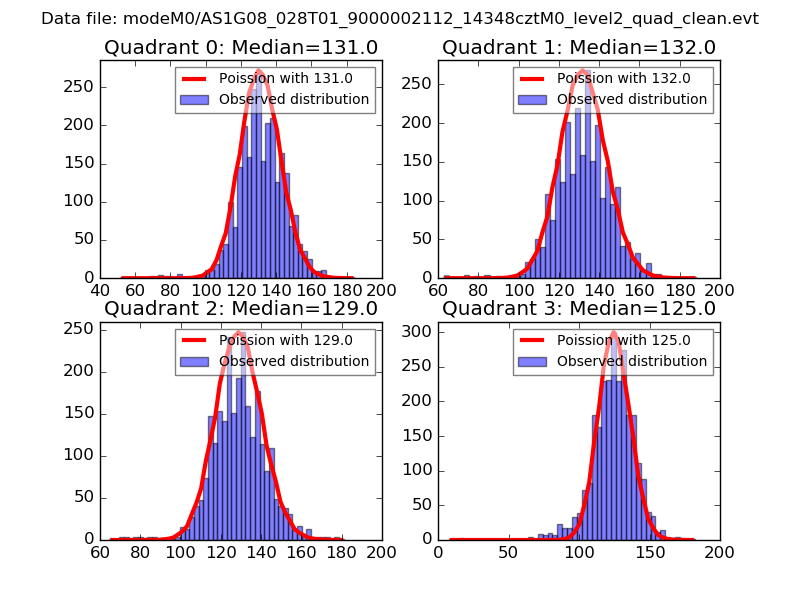 |
 |
| Quadrant-wise count rates Data is divided into 100 sec bins |
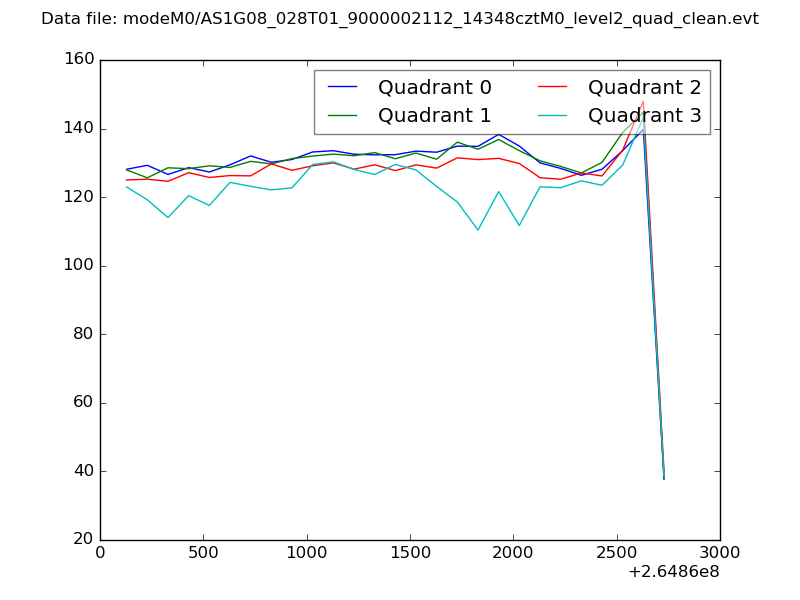 |
|
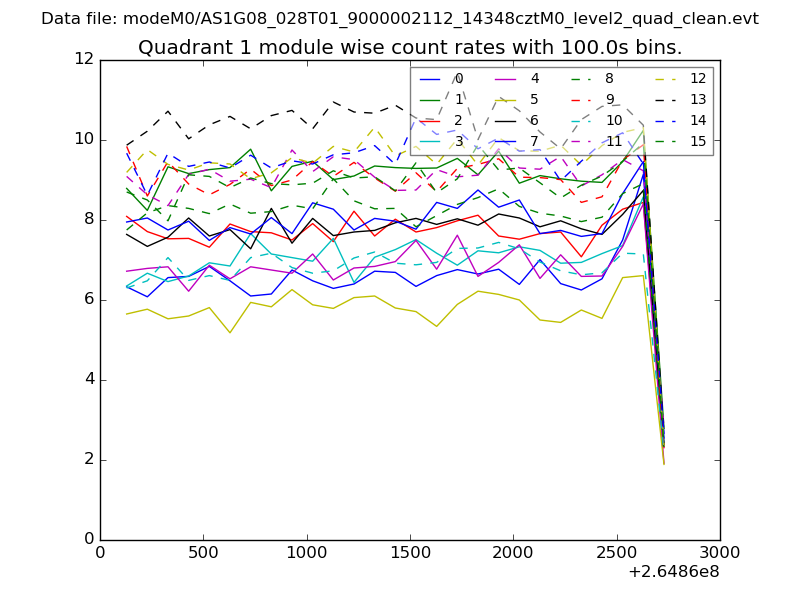
| Module-wise count rates for Quadrant A Data is divided into 100 sec bins |
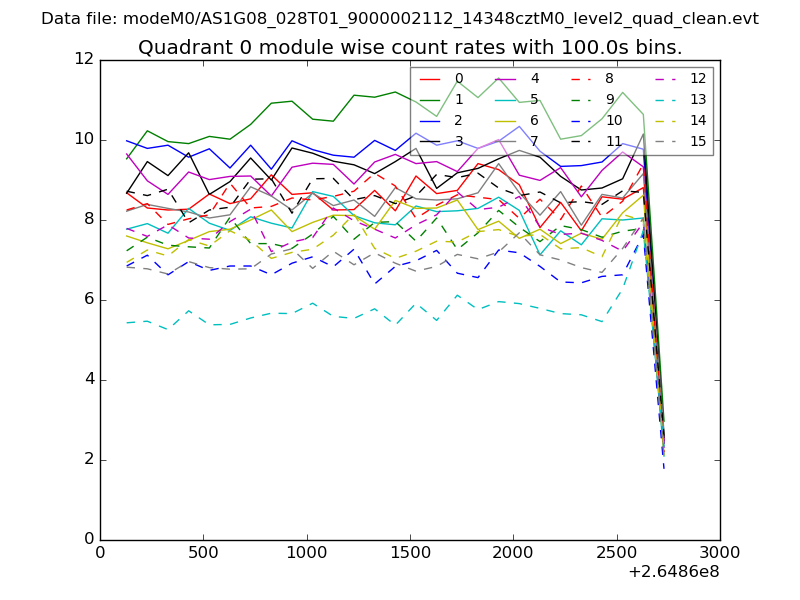 |
 |
| Module-wise count rates for Quadrant B Data is divided into 100 sec bins |
 |
 |
| Module-wise count rates for Quadrant C Data is divided into 100 sec bins |
 |
 |
| Module-wise count rates for Quadrant D Data is divided into 100 sec bins |
 |
 |
| Parameter | Plot |
|---|---|
| CZT HV Monitor | 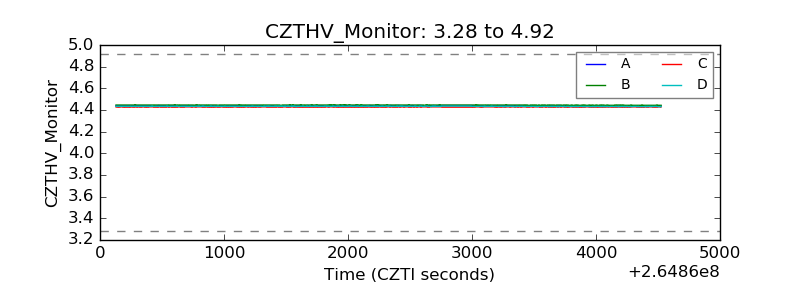 |
| D_VDD | 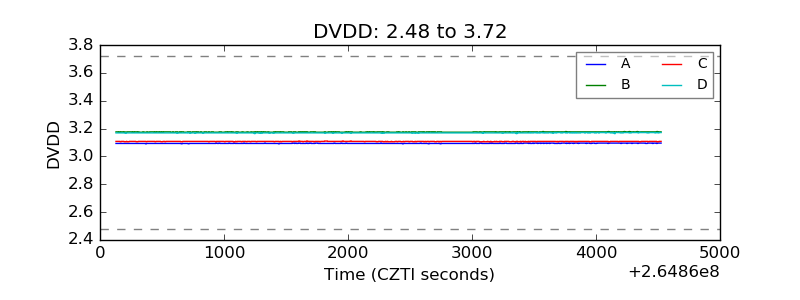 |
| Temperature 1 | 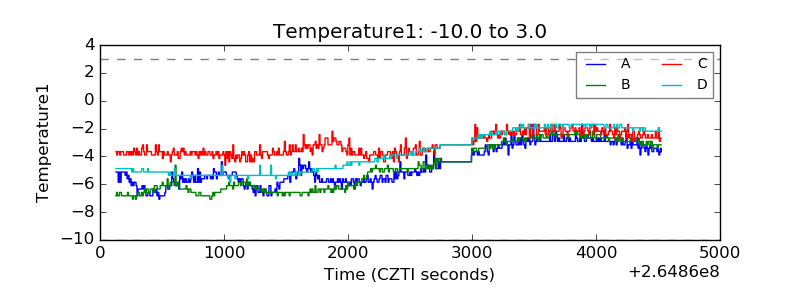 |
| Veto HV Monitor | 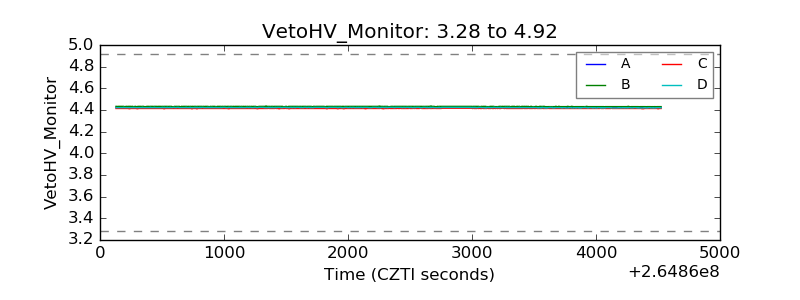 |
| Veto LLD | 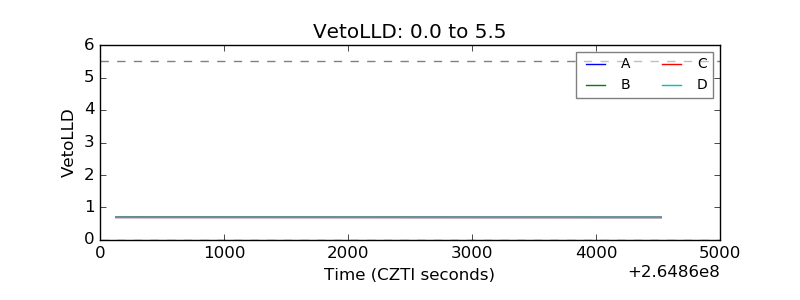 |
| Alpha Counter | 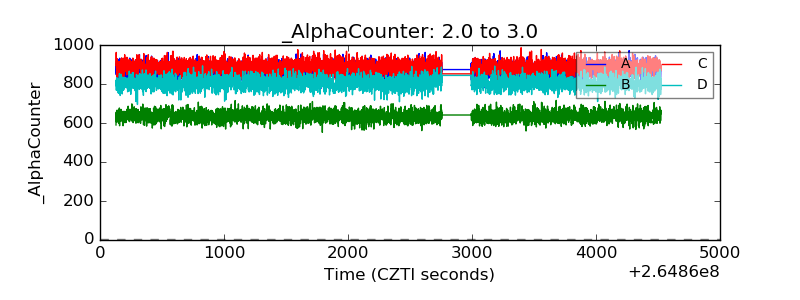 |
| _CPM_Rate | 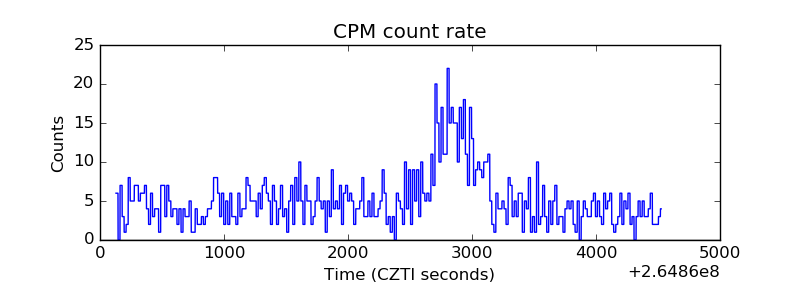 |
| CZT Counter | 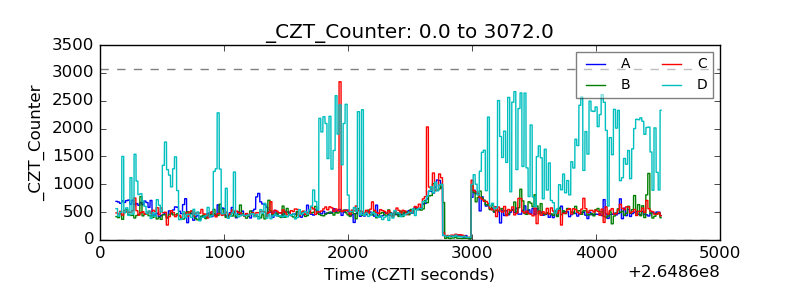 |
| +2.5 Volts monitor |  |
| +5 Volts monitor |  |
| _ROLL_ROT | 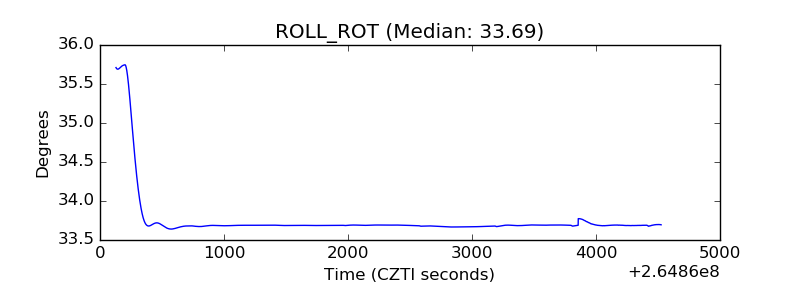 |
| _Roll_DEC | 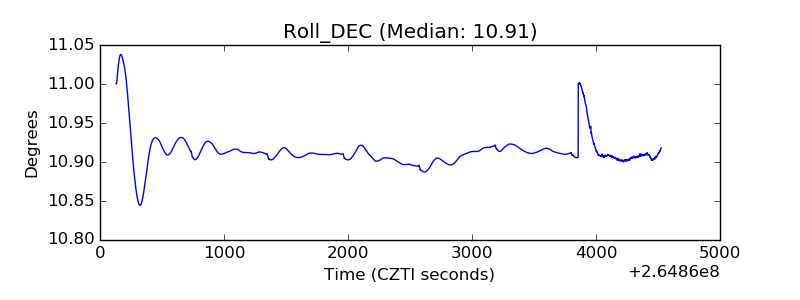 |
| _Roll_RA | 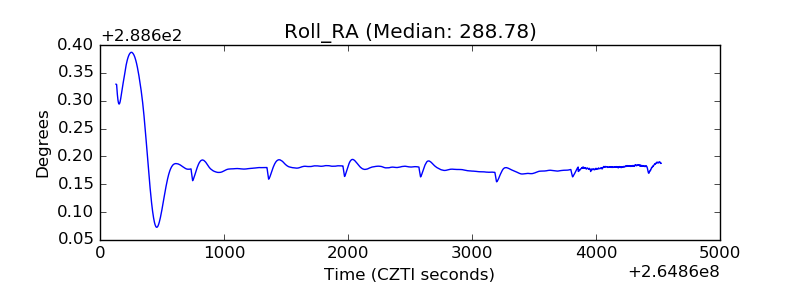 |
| Veto Counter | 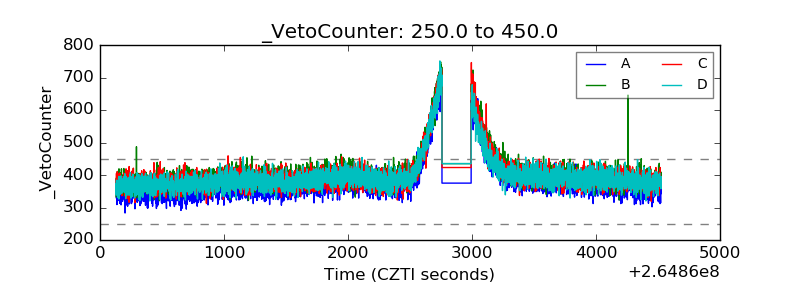 |