| Param | Original file | Final file |
|---|---|---|
| Filename | modeM0/AS1G08_028T01_9000002112_14353cztM0_level2.evt | modeM0/AS1G08_028T01_9000002112_14353cztM0_level2_quad_clean.evt |
| Size (bytes) | 1,397,214,720 | 234,095,040 |
| Size | 1.3 GB | 223.3 MB |
| Events in quadrant A | 8,666,763 | 1,488,887 |
| Events in quadrant B | 11,447,838 | 1,455,901 |
| Events in quadrant C | 9,665,697 | 1,459,979 |
| Events in quadrant D | 11,299,737 | 1,425,031 |
| Mode M9 | |||
|---|---|---|---|
| Quadrant | BADHDUFLAG | Total packets | Discarded packets |
| A | 0 | 19 | 0 |
| B | 0 | 19 | 0 |
| C | 0 | 19 | 0 |
| D | 0 | 20 | 0 |
| Mode M0 | |||
|---|---|---|---|
| Quadrant | BADHDUFLAG | Total packets | Discarded packets |
| A | 0 | 37564 | 4 |
| B | 0 | 45943 | 4 |
| C | 0 | 39541 | 4 |
| D | 0 | 46235 | 4 |
| Mode SS | |||
|---|---|---|---|
| Quadrant | BADHDUFLAG | Total packets | Discarded packets |
| A | 0 | 372 | 0 |
| B | 0 | 372 | 0 |
| C | 0 | 372 | 0 |
| D | 0 | 372 | 0 |
| Quadrant | Total seconds | Saturated seconds | Saturation percentage |
|---|---|---|---|
| A | 18288 | 127 | 0.694444% |
| B | 18288 | 894 | 4.888451% |
| C | 18288 | 143 | 0.781934% |
| D | 18288 | 454 | 2.482502% |
Noise dominated data is calculated using 1-second bins in cleaned event files. If a bin has >2000 counts, and if more than 50% of those come from <1% of pixels, then it is considered to be noise-dominated and hence unusable.
| Quadrant | # 1 sec bins | Bins with >0 counts | Bins with >2000 counts | High rate bins dominated by noise | Noise dominated (total time) | Noise dominated (detector-on time) | Marked lightcurve |
|---|---|---|---|---|---|---|---|
| A | 20224 | 18291 | 4 | 4 | 0.02% | 0.02% | 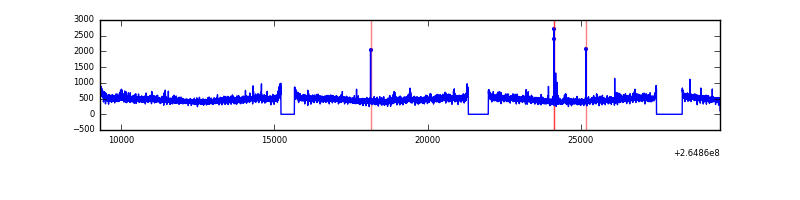 |
| B | 20224 | 18289 | 519 | 519 | 2.57% | 2.84% | 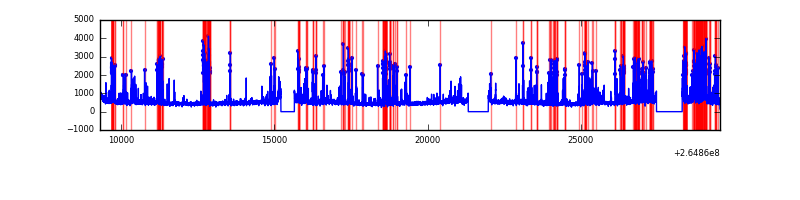 |
| C | 20224 | 18291 | 15 | 15 | 0.07% | 0.08% | 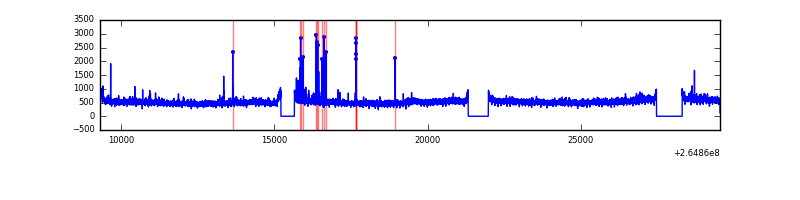 |
| D | 20224 | 18290 | 289 | 289 | 1.43% | 1.58% | 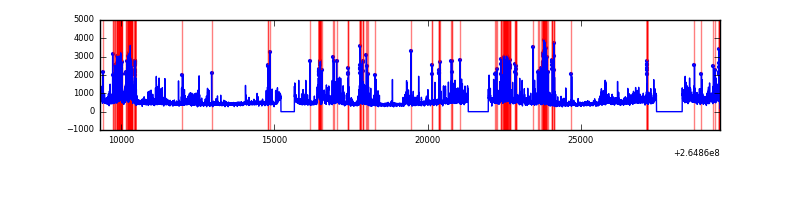 |
Top three noisy pixels from each quadrant. If the there are fewer than three noisy pixels in the level2.evt file, extra rows are filled as -1
| Pixel properties | Quadrant properties | ||||||
|---|---|---|---|---|---|---|---|
| Quadrant | DetID | PixID | Counts | Sigma | Mean | Median | Sigma |
| A | 12 | 189 | 150335 | 333.26 | 2194 | 2144 | 444.7 |
| A | 4 | 2 | 32062 | 67.28 | 2194 | 2144 | 444.7 |
| A | 8 | 15 | 29276 | 61.02 | 2194 | 2144 | 444.7 |
| B | 10 | 16 | 1708918 | 4132.01 | 2146 | 2094 | 413.1 |
| B | 0 | 229 | 571971 | 1379.6 | 2146 | 2094 | 413.1 |
| B | 0 | 85 | 294528 | 707.95 | 2146 | 2094 | 413.1 |
| C | 3 | 233 | 1215747 | 2474.75 | 2124 | 2135 | 490.4 |
| C | 6 | 96 | 156009 | 313.77 | 2124 | 2135 | 490.4 |
| C | 13 | 61 | 14853 | 25.93 | 2124 | 2135 | 490.4 |
| D | 5 | 222 | 1388850 | 2767.56 | 2109 | 2057 | 501.1 |
| D | 2 | 120 | 718568 | 1429.91 | 2109 | 2057 | 501.1 |
| D | 10 | 199 | 338195 | 670.82 | 2109 | 2057 | 501.1 |
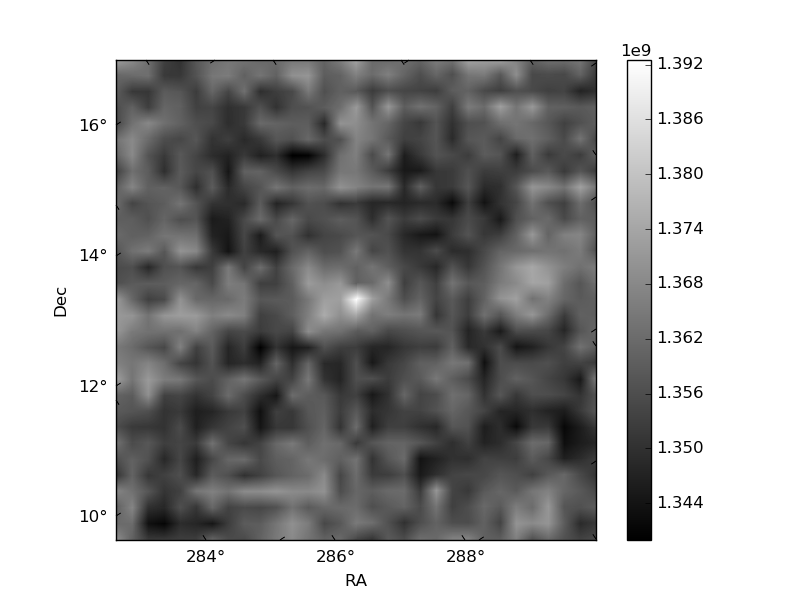
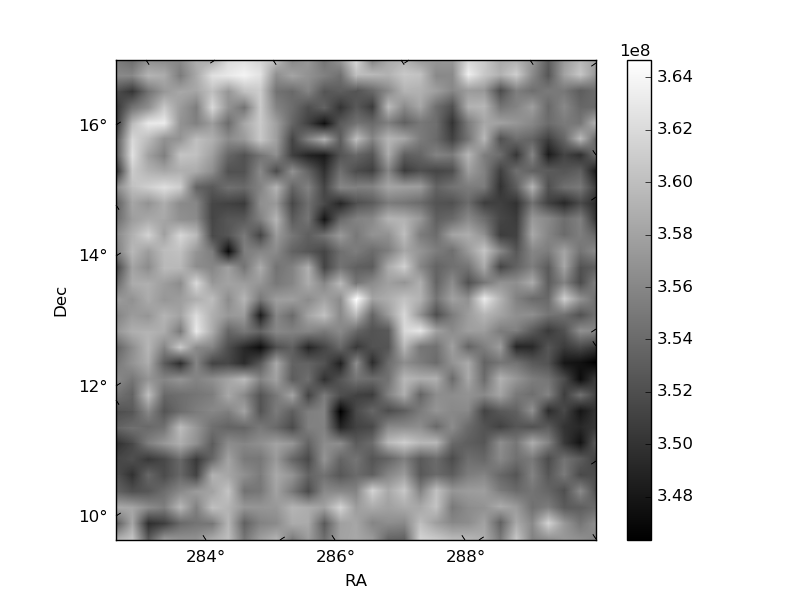
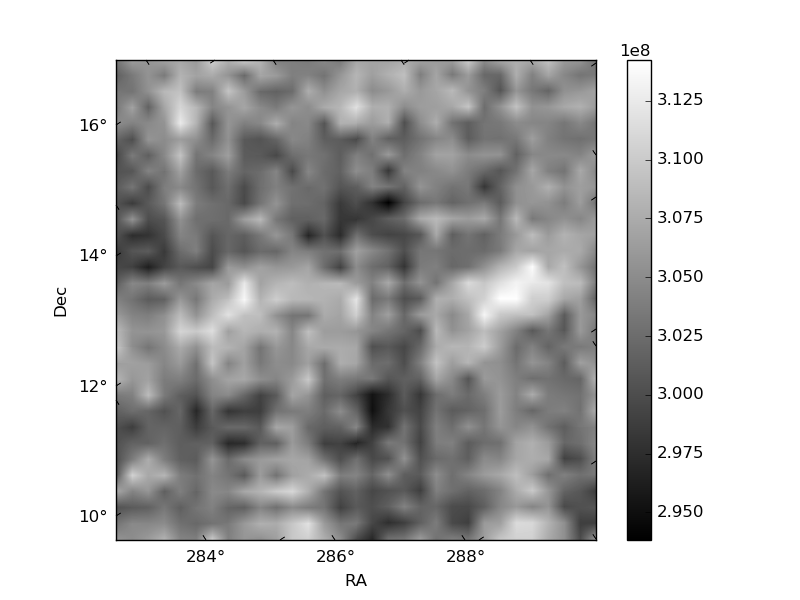
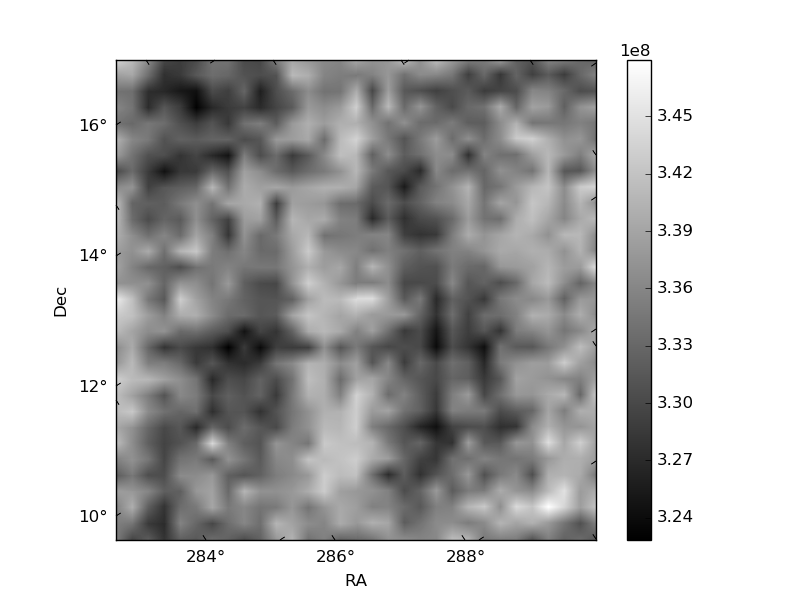
Histogram calculated using DETX and DETY for each event in the final _common_clean file
| Quadrant A | 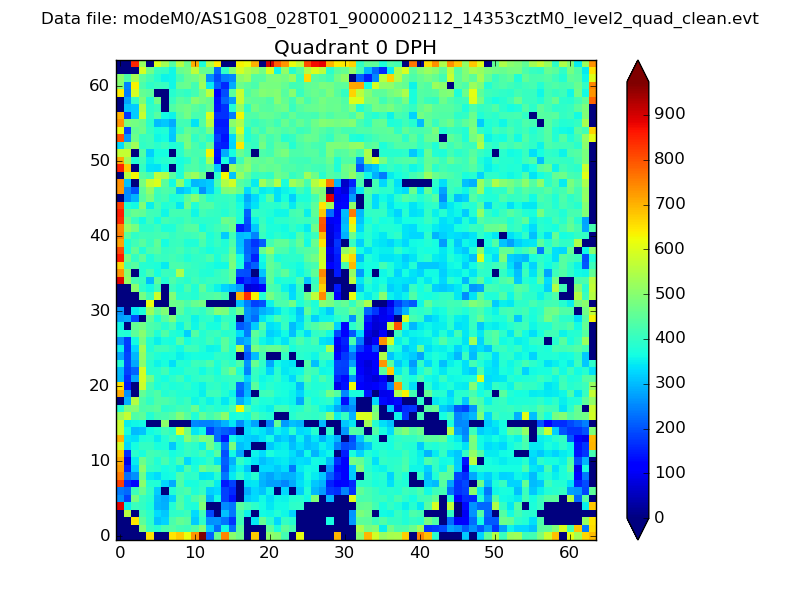 |
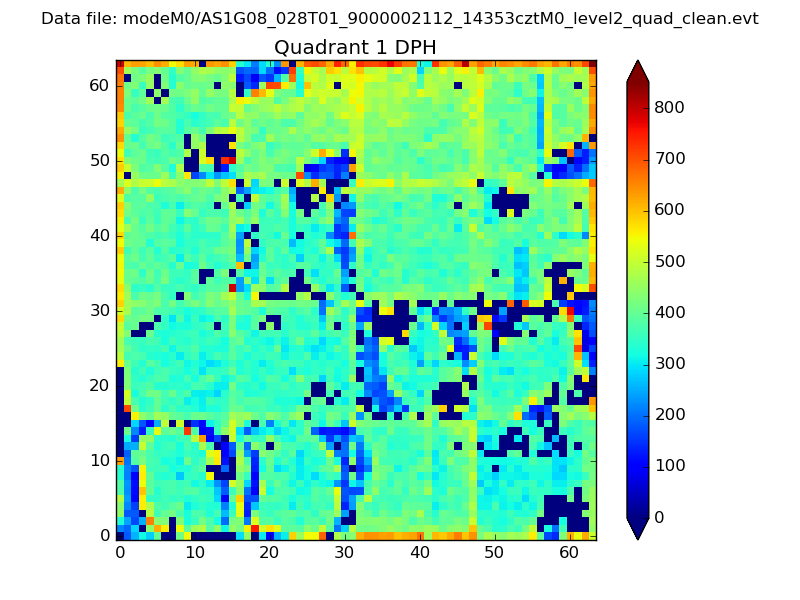 |
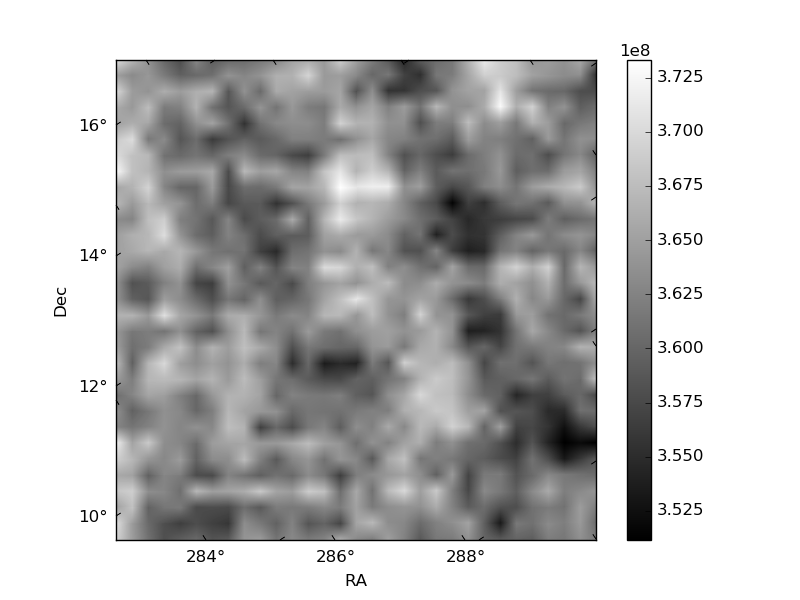
Quadrant B |
|---|---|---|---|
| Quadrant D | 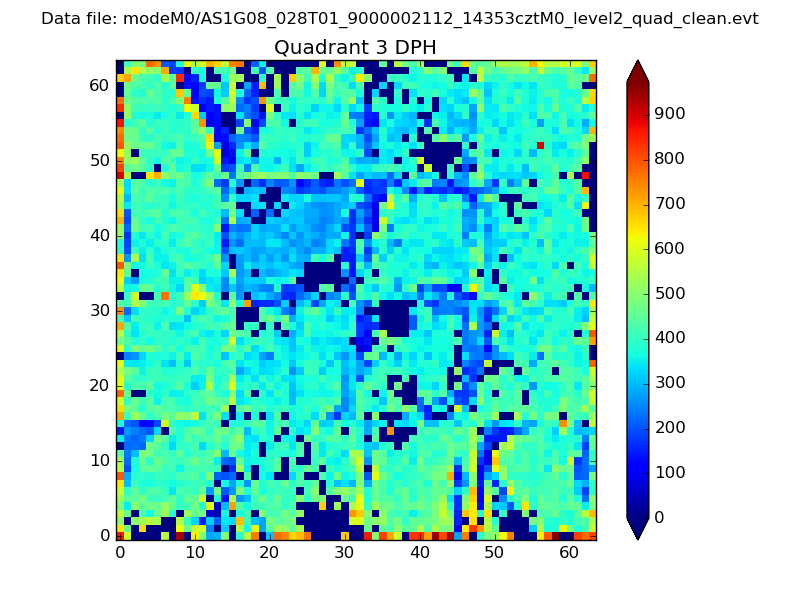 |
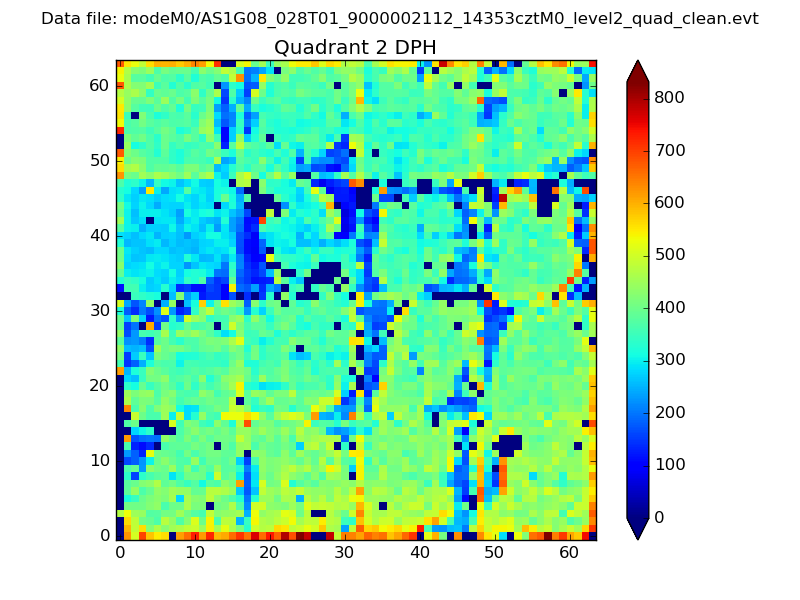 |
Quadrant C |
| Plot type | Count rate plots | Images |
|---|---|---|
| Comparison with Poisson distribution Blue bars denote a histogram of data divided into 1 sec bins. Red curve is a Poisson curve with rate = median count rate of data. |
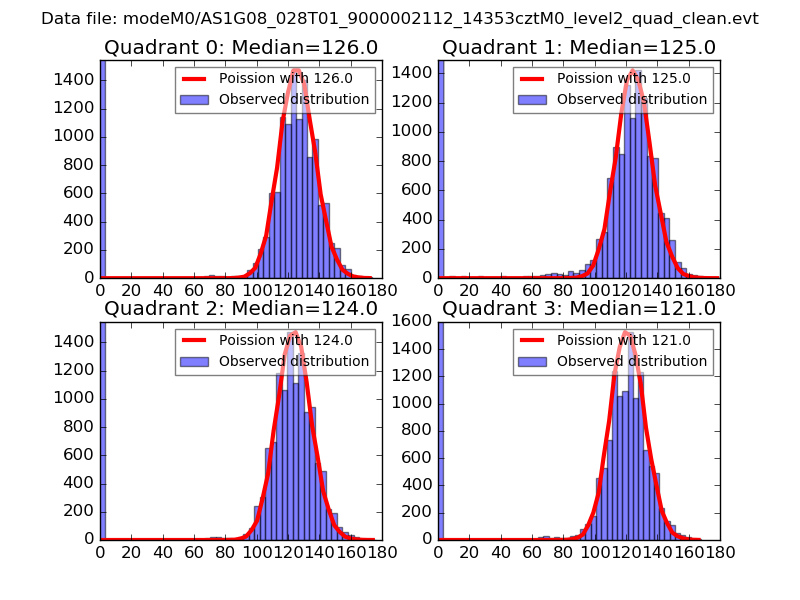 |
 |
| Quadrant-wise count rates Data is divided into 100 sec bins |
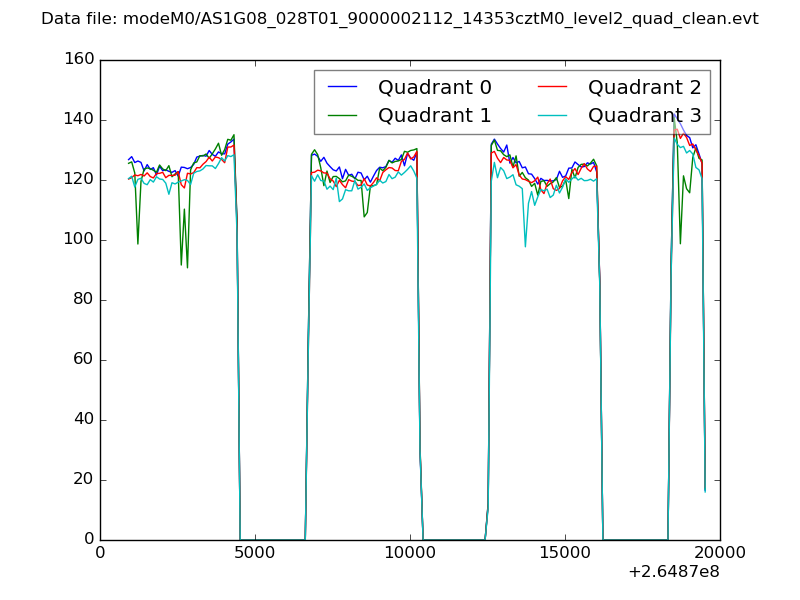 |
|
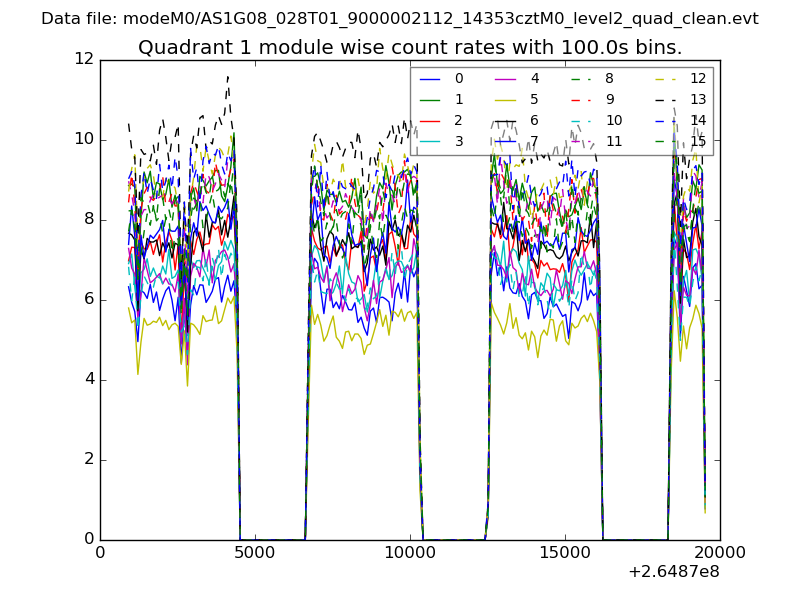
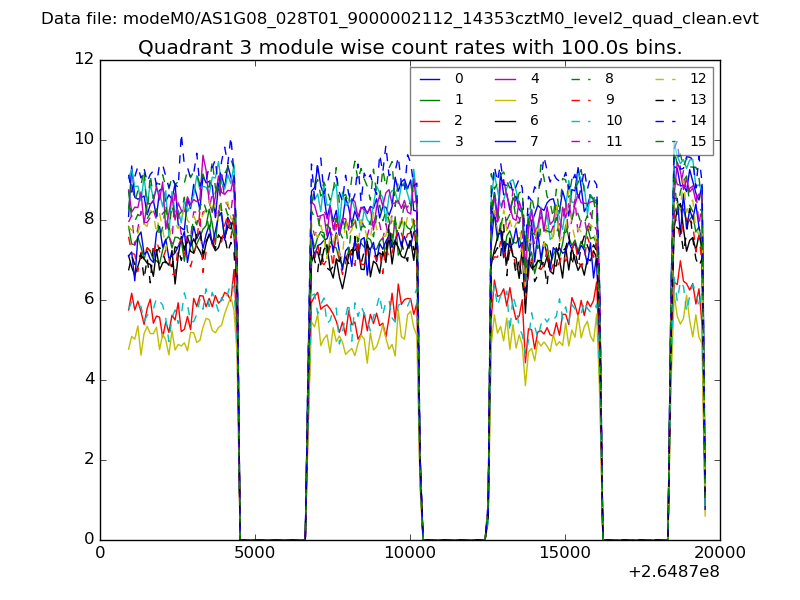
| Module-wise count rates for Quadrant A Data is divided into 100 sec bins |
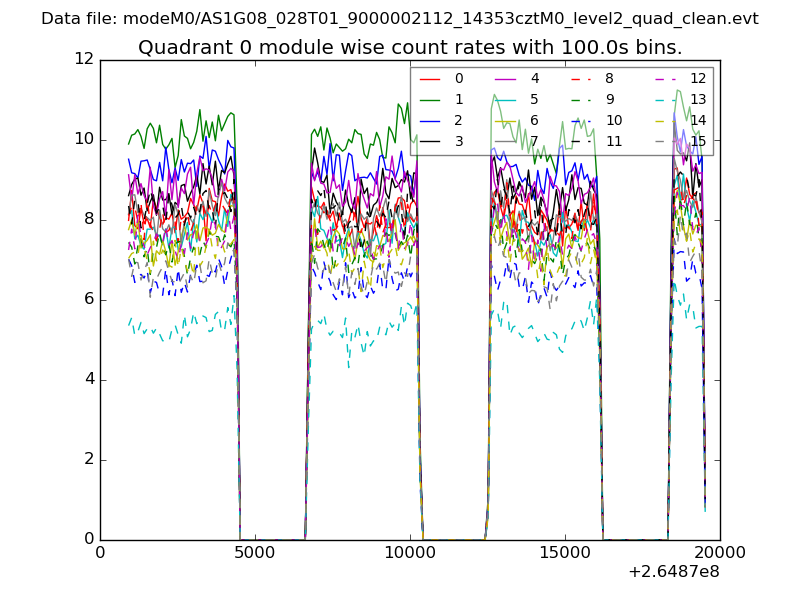 |
 |
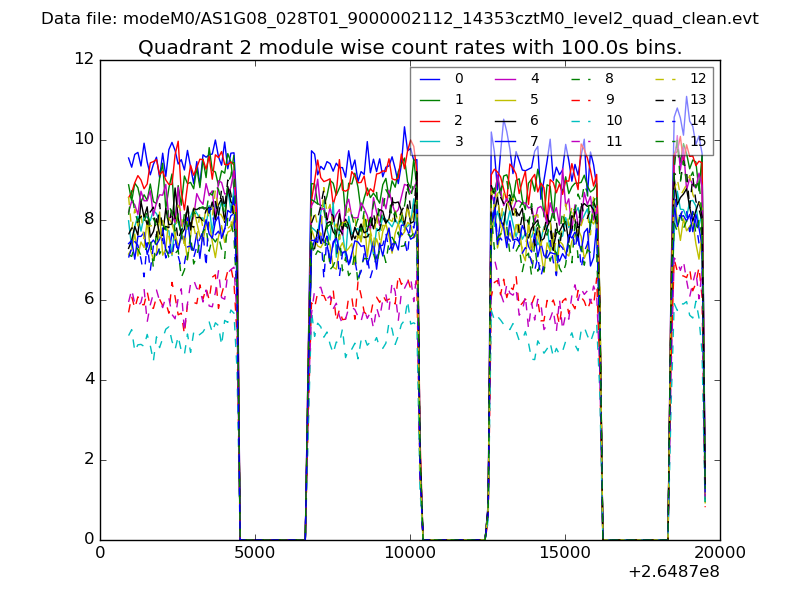
| Module-wise count rates for Quadrant B Data is divided into 100 sec bins |
 |
 |
| Module-wise count rates for Quadrant C Data is divided into 100 sec bins |
 |
 |
| Module-wise count rates for Quadrant D Data is divided into 100 sec bins |
 |
 |
| Parameter | Plot |
|---|---|
| CZT HV Monitor | 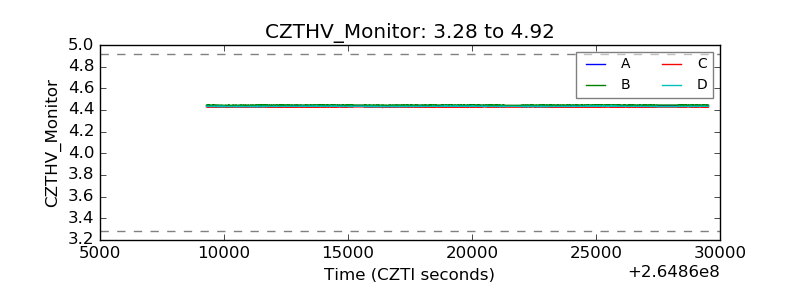 |
| D_VDD | 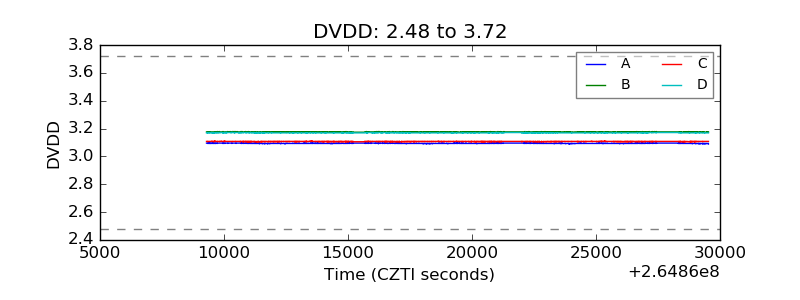 |
| Temperature 1 | 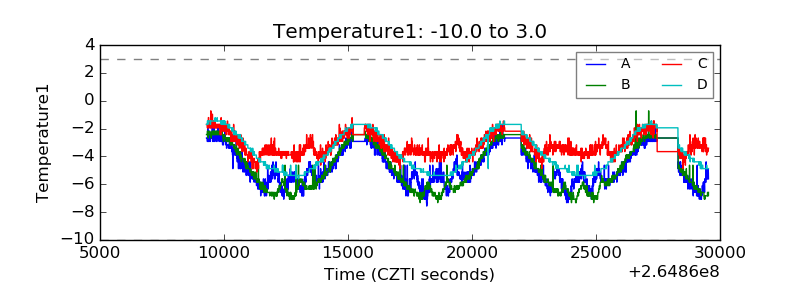 |
| Veto HV Monitor | 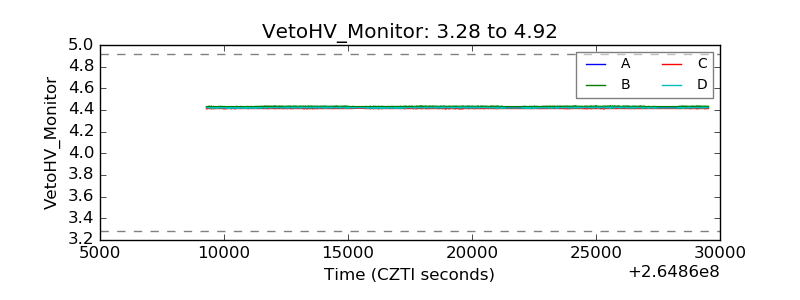 |
| Veto LLD | 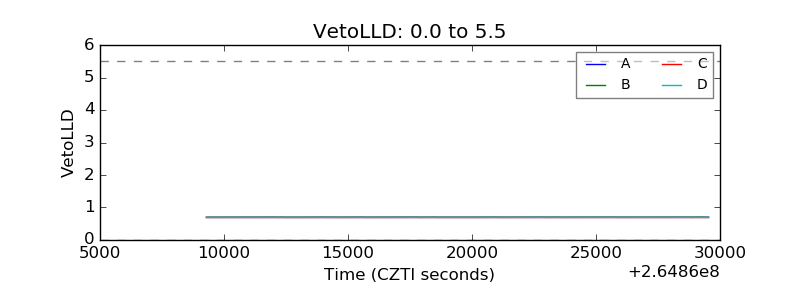 |
| Alpha Counter |  |
| _CPM_Rate | 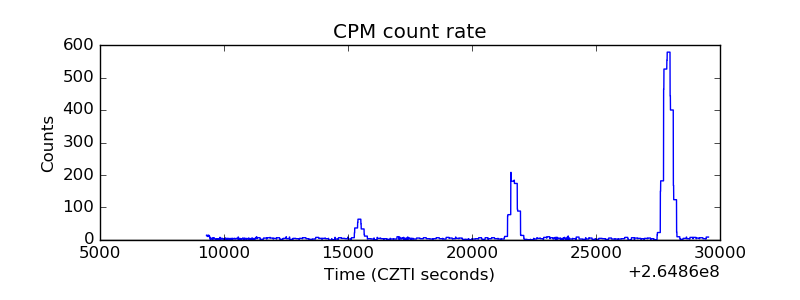 |
| CZT Counter | 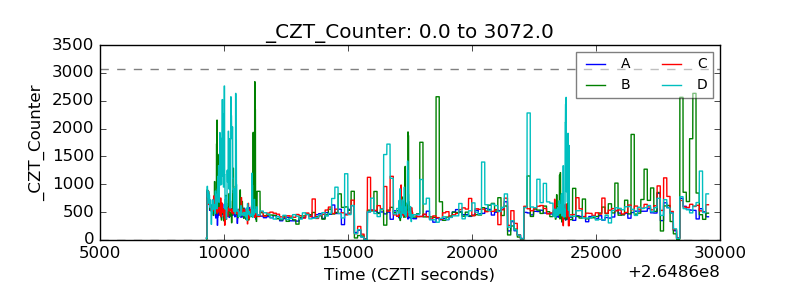 |
| +2.5 Volts monitor | 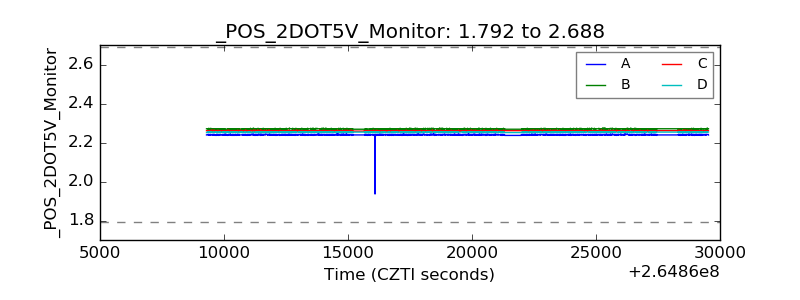 |
| +5 Volts monitor |  |
| _ROLL_ROT | 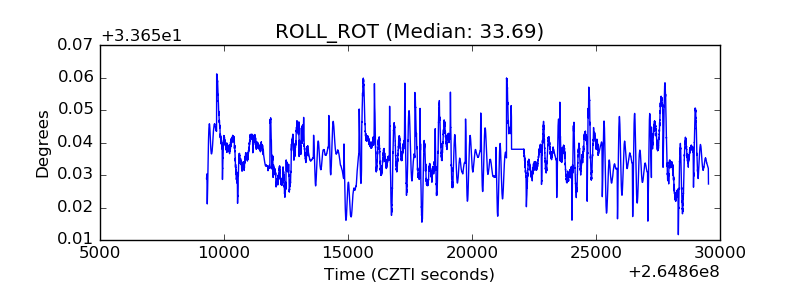 |
| _Roll_DEC | 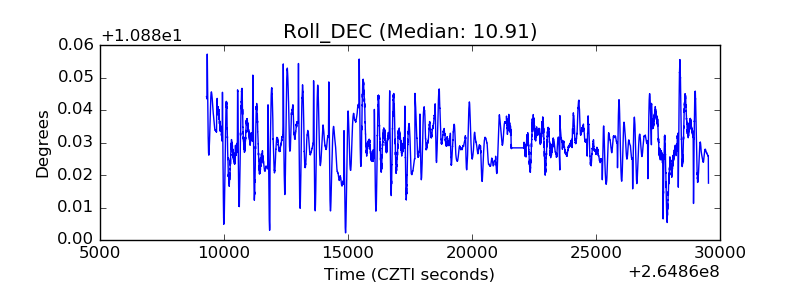 |
| _Roll_RA | 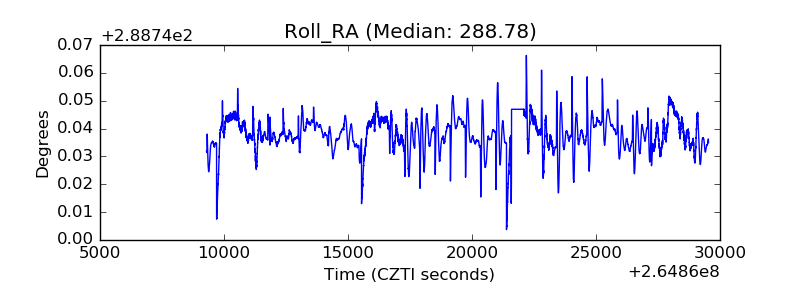 |
| Veto Counter | 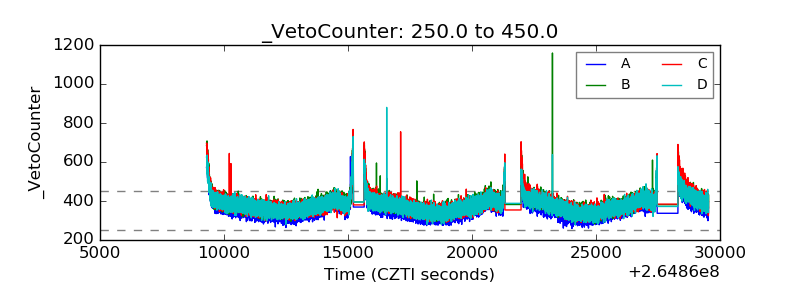 |