| Param | Original file | Final file |
|---|---|---|
| Filename | modeM0/AS1G08_028T01_9000002112_14357cztM0_level2.evt | modeM0/AS1G08_028T01_9000002112_14357cztM0_level2_quad_clean.evt |
| Size (bytes) | 676,440,000 | 110,226,240 |
| Size | 645.1 MB | 105.1 MB |
| Events in quadrant A | 4,100,529 | 701,664 |
| Events in quadrant B | 5,618,368 | 684,577 |
| Events in quadrant C | 4,690,542 | 690,485 |
| Events in quadrant D | 5,497,336 | 667,256 |
| Mode M9 | |||
|---|---|---|---|
| Quadrant | BADHDUFLAG | Total packets | Discarded packets |
| A | 0 | 15 | 0 |
| B | 0 | 15 | 0 |
| C | 0 | 15 | 0 |
| D | 0 | 15 | 0 |
| Mode M0 | |||
|---|---|---|---|
| Quadrant | BADHDUFLAG | Total packets | Discarded packets |
| A | 0 | 17548 | 2 |
| B | 0 | 22247 | 2 |
| C | 0 | 19018 | 2 |
| D | 0 | 22196 | 2 |
| Mode SS | |||
|---|---|---|---|
| Quadrant | BADHDUFLAG | Total packets | Discarded packets |
| A | 0 | 176 | 0 |
| B | 0 | 176 | 0 |
| C | 0 | 176 | 0 |
| D | 0 | 176 | 0 |
| Quadrant | Total seconds | Saturated seconds | Saturation percentage |
|---|---|---|---|
| A | 8553 | 37 | 0.432597% |
| B | 8553 | 457 | 5.343154% |
| C | 8553 | 36 | 0.420905% |
| D | 8553 | 190 | 2.221443% |
Noise dominated data is calculated using 1-second bins in cleaned event files. If a bin has >2000 counts, and if more than 50% of those come from <1% of pixels, then it is considered to be noise-dominated and hence unusable.
| Quadrant | # 1 sec bins | Bins with >0 counts | Bins with >2000 counts | High rate bins dominated by noise | Noise dominated (total time) | Noise dominated (detector-on time) | Marked lightcurve |
|---|---|---|---|---|---|---|---|
| A | 10049 | 8556 | 3 | 3 | 0.03% | 0.04% | 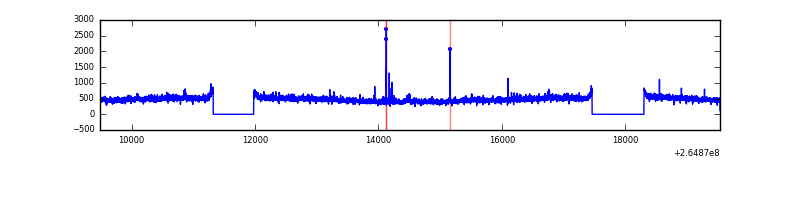 |
| B | 10049 | 8554 | 273 | 273 | 2.72% | 3.19% | 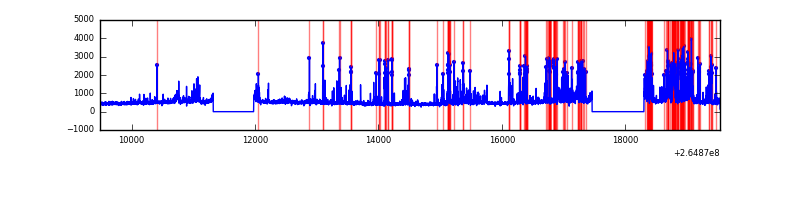 |
| C | 10049 | 8556 | 0 | 0 | 0.00% | 0.00% |  |
| D | 10049 | 8555 | 135 | 135 | 1.34% | 1.58% | 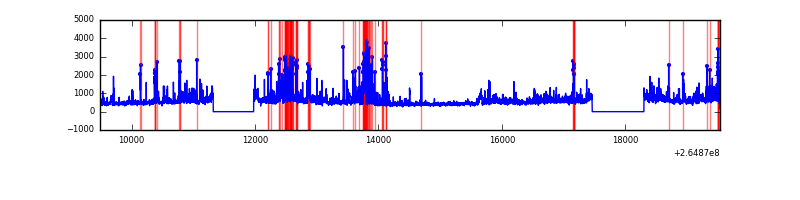 |
Top three noisy pixels from each quadrant. If the there are fewer than three noisy pixels in the level2.evt file, extra rows are filled as -1
| Pixel properties | Quadrant properties | ||||||
|---|---|---|---|---|---|---|---|
| Quadrant | DetID | PixID | Counts | Sigma | Mean | Median | Sigma |
| A | 12 | 189 | 63356 | 292.85 | 1041 | 1018 | 212.9 |
| A | 4 | 2 | 16677 | 73.56 | 1041 | 1018 | 212.9 |
| A | 8 | 15 | 9700 | 40.79 | 1041 | 1018 | 212.9 |
| B | 10 | 16 | 1001586 | 5113.87 | 1014 | 987 | 195.7 |
| B | 0 | 85 | 285921 | 1456.24 | 1014 | 987 | 195.7 |
| B | 0 | 189 | 153278 | 778.33 | 1014 | 987 | 195.7 |
| C | 3 | 233 | 754330 | 3231.67 | 1006 | 1012 | 233.1 |
| C | 13 | 61 | 7139 | 26.28 | 1006 | 1012 | 233.1 |
| C | 3 | 232 | 4749 | 16.03 | 1006 | 1012 | 233.1 |
| D | 5 | 222 | 850653 | 3566.34 | 998 | 971 | 238.3 |
| D | 2 | 120 | 209538 | 875.41 | 998 | 971 | 238.3 |
| D | 1 | 52 | 149691 | 624.22 | 998 | 971 | 238.3 |
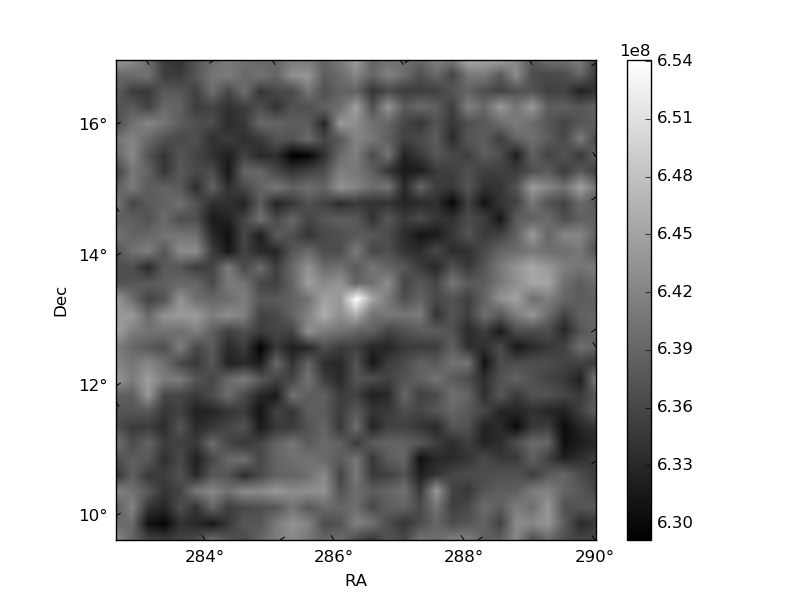
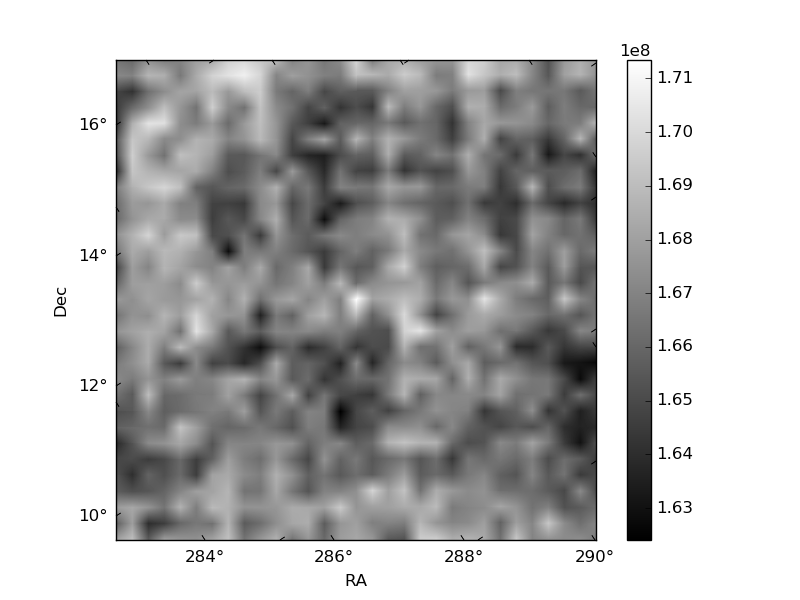
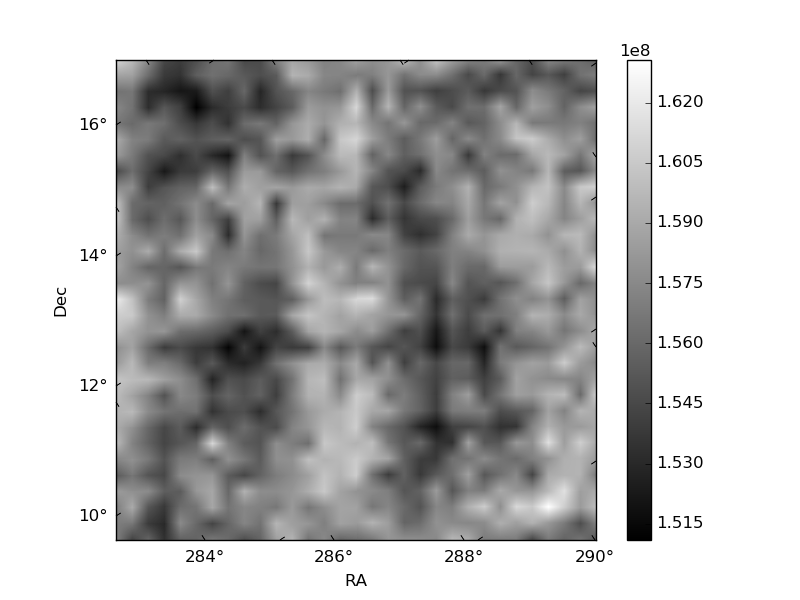
Histogram calculated using DETX and DETY for each event in the final _common_clean file
| Quadrant A |  |
 |
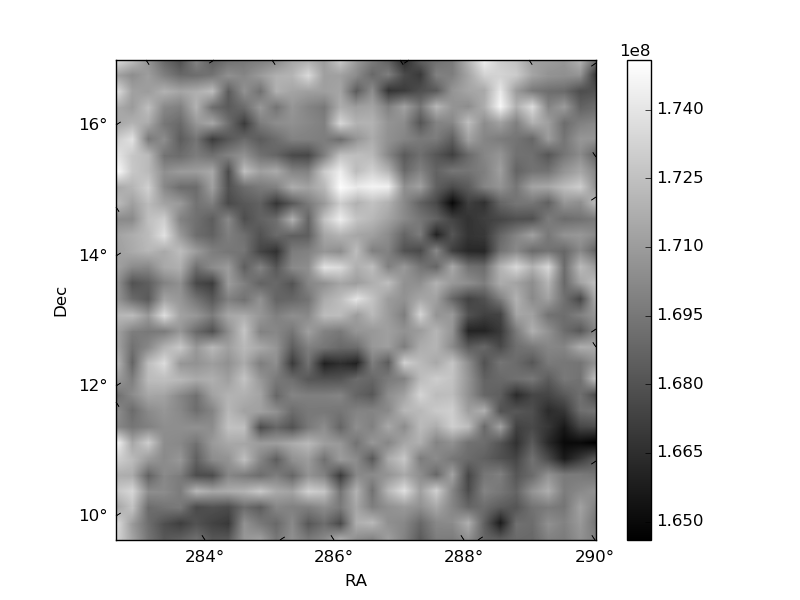
Quadrant B |
|---|---|---|---|
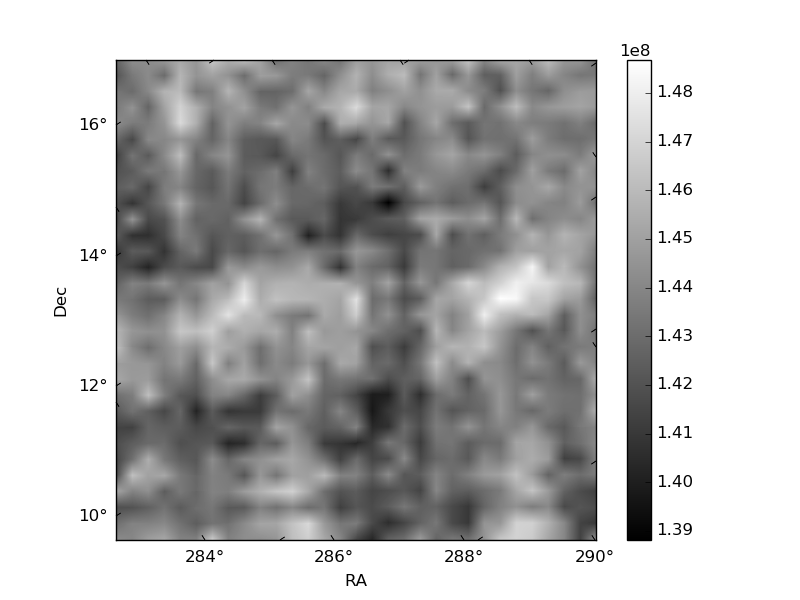
| Quadrant D |  |
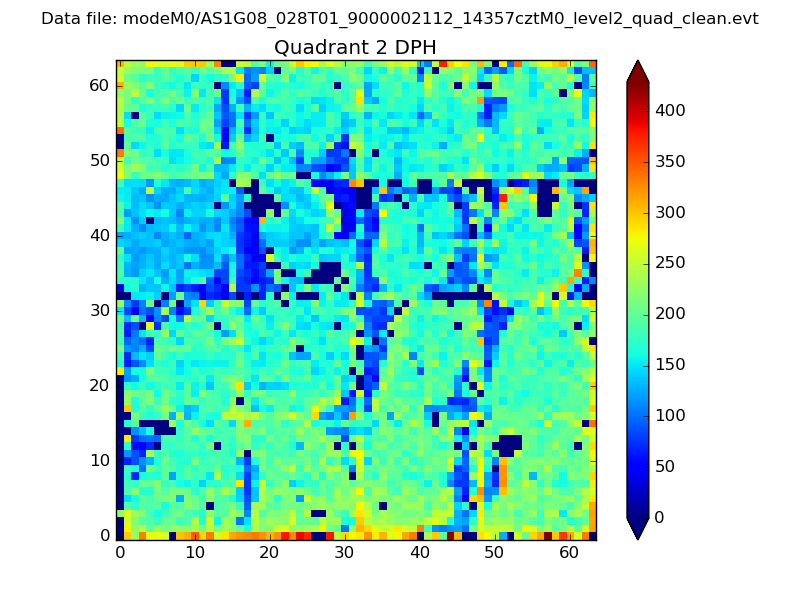 |
Quadrant C |
| Plot type | Count rate plots | Images |
|---|---|---|
| Comparison with Poisson distribution Blue bars denote a histogram of data divided into 1 sec bins. Red curve is a Poisson curve with rate = median count rate of data. |
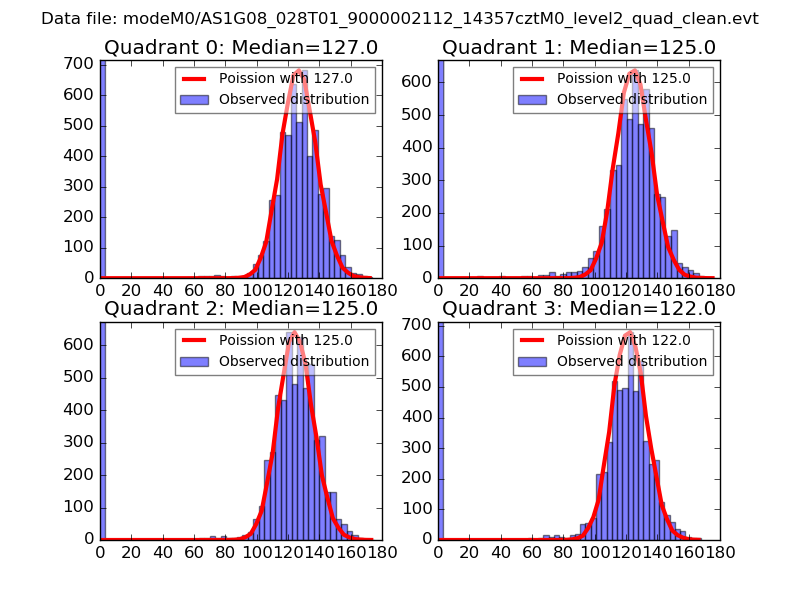 |
 |
| Quadrant-wise count rates Data is divided into 100 sec bins |
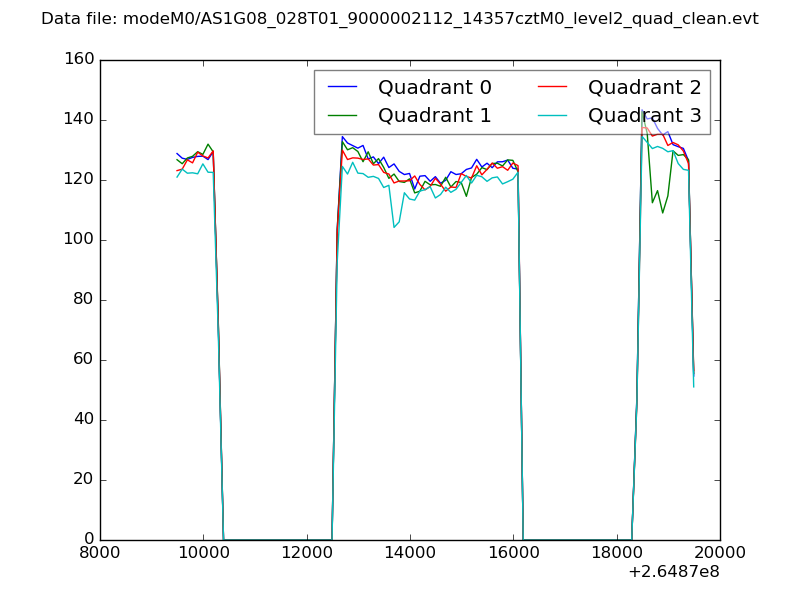 |
|
| Module-wise count rates for Quadrant A Data is divided into 100 sec bins |
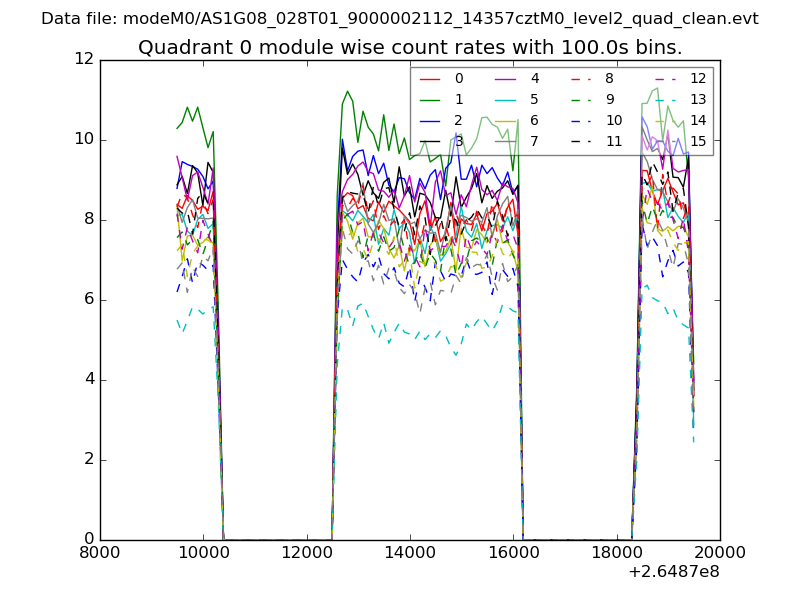 |
 |
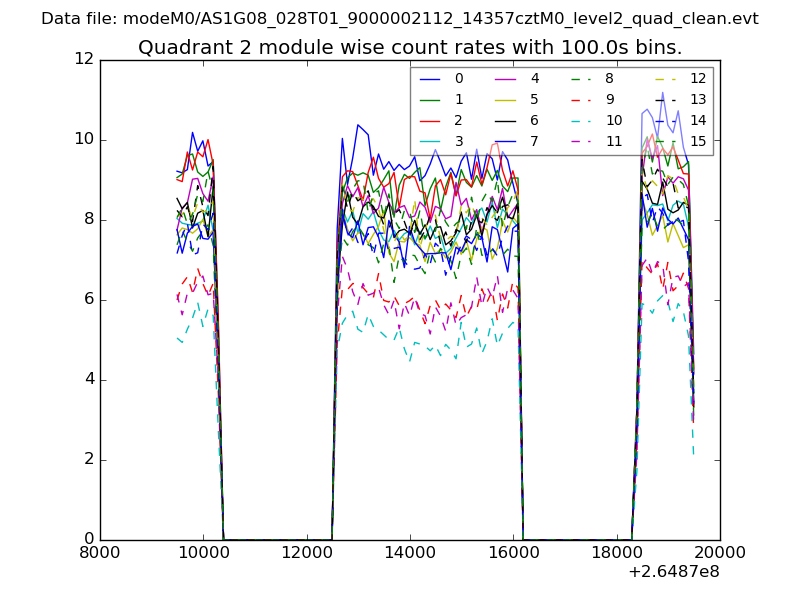
| Module-wise count rates for Quadrant B Data is divided into 100 sec bins |
 |
 |
| Module-wise count rates for Quadrant C Data is divided into 100 sec bins |
 |
 |
| Module-wise count rates for Quadrant D Data is divided into 100 sec bins |
 |
 |
| Parameter | Plot |
|---|---|
| CZT HV Monitor | 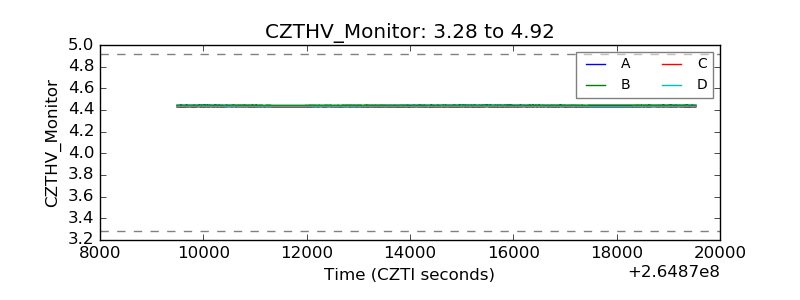 |
| D_VDD | 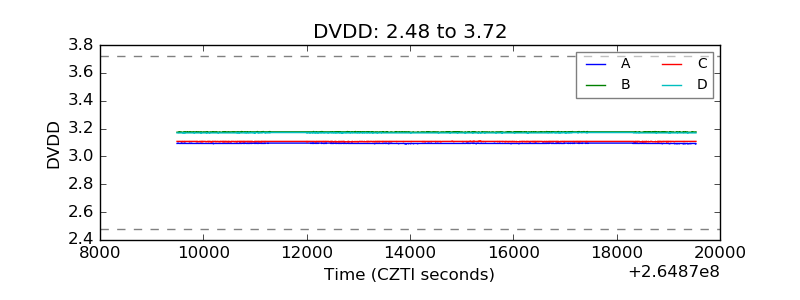 |
| Temperature 1 | 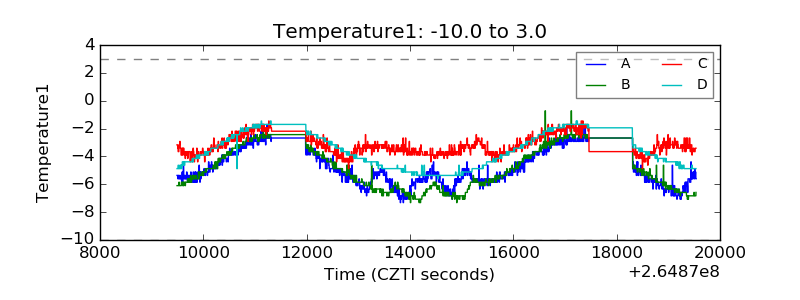 |
| Veto HV Monitor | 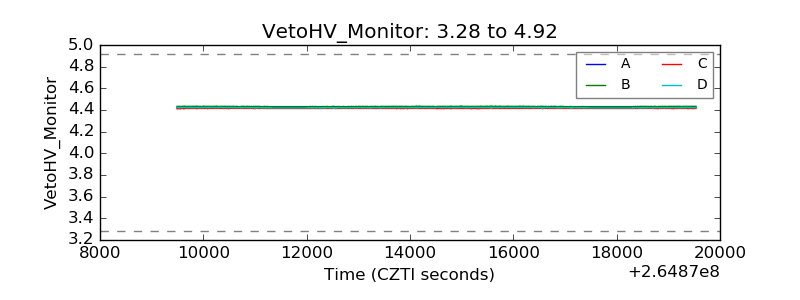 |
| Veto LLD | 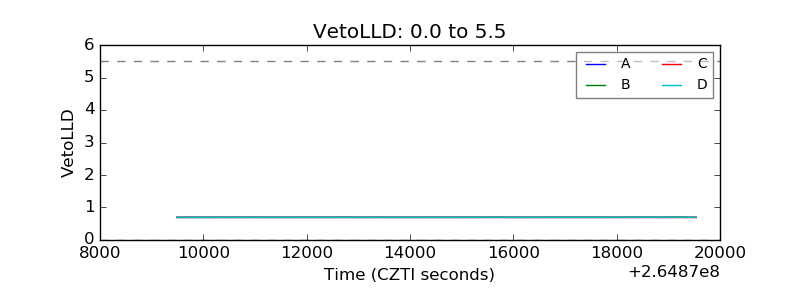 |
| Alpha Counter | 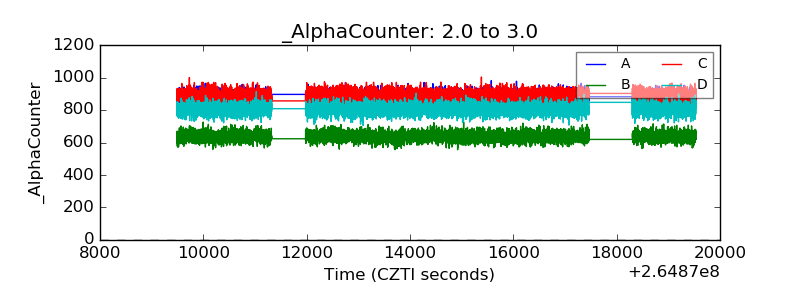 |
| _CPM_Rate | 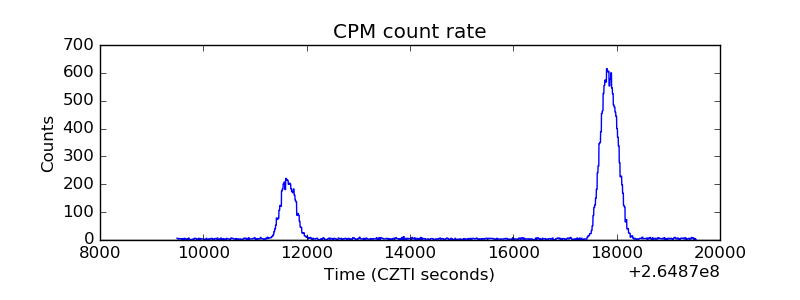 |
| CZT Counter | 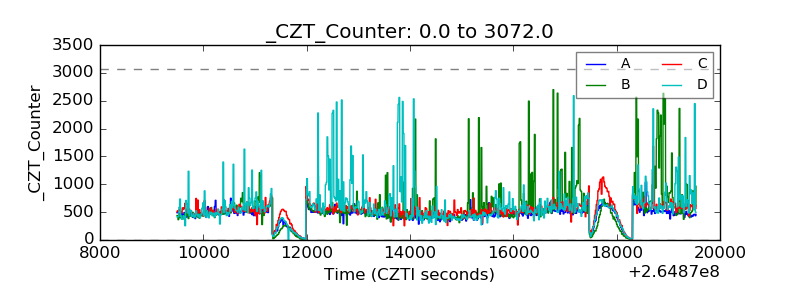 |
| +2.5 Volts monitor |  |
| +5 Volts monitor |  |
| _ROLL_ROT | 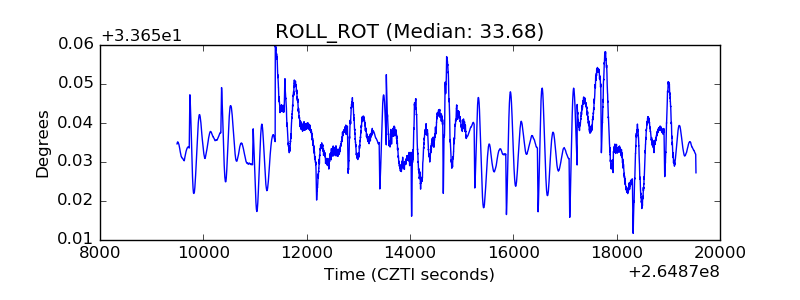 |
| _Roll_DEC | 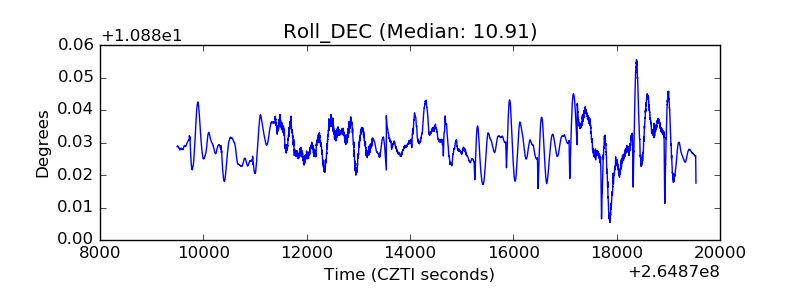 |
| _Roll_RA | 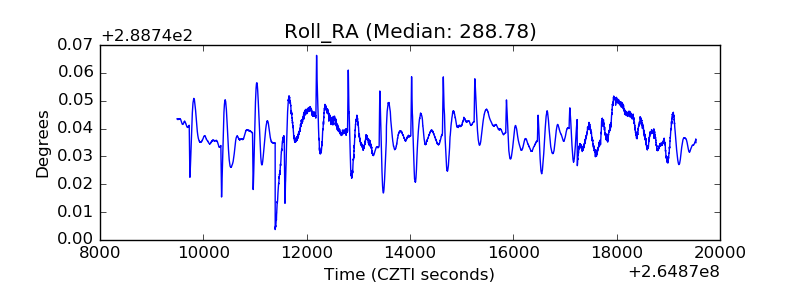 |
| Veto Counter | 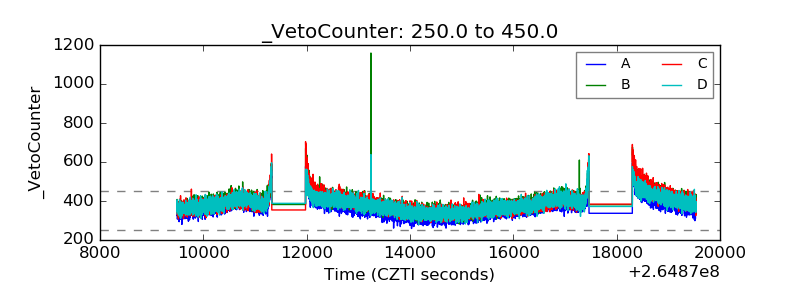 |