| Param | Original file | Final file |
|---|---|---|
| Filename | modeM0/AS1A04_149T01_9000002118cztM0_level2.fits | modeM0/AS1A04_149T01_9000002118cztM0_level2_quad_clean.evt |
| Size (bytes) | 716,644,800 | 739,967,040 |
| Size | 683.4 MB | 705.7 MB |
| Events in quadrant A | 4,368,146 | 4,563,797 |
| Events in quadrant B | 4,208,406 | 4,495,385 |
| Events in quadrant C | 4,317,150 | 4,328,810 |
| Events in quadrant D | 3,704,938 | 3,919,106 |
| Mode SS | |||
|---|---|---|---|
| Quadrant | BADHDUFLAG | Total packets | Discarded packets |
| A | 0 | 1516 | 0 |
| B | 0 | 1516 | 0 |
| C | 0 | 1516 | 0 |
| D | 0 | 1516 | 0 |
| Mode M0 | |||
|---|---|---|---|
| Quadrant | BADHDUFLAG | Total packets | Discarded packets |
| A | 0 | 153588 | 0 |
| B | 0 | 164209 | 0 |
| C | 0 | 169201 | 0 |
| D | 0 | 185004 | 0 |
| Mode M9 | |||
|---|---|---|---|
| Quadrant | BADHDUFLAG | Total packets | Discarded packets |
| A | 0 | 121 | 0 |
| B | 0 | 121 | 0 |
| C | 0 | 121 | 0 |
| D | 0 | 121 | 0 |
| Quadrant | Total seconds | Saturated seconds | Saturation percentage |
|---|---|---|---|
| A | 74438 | 886 | 1.190252% |
| B | 74438 | 1643 | 2.207206% |
| C | 74438 | 720 | 0.967248% |
| D | 74438 | 2971 | 3.991241% |
Noise dominated data is calculated using 1-second bins in cleaned event files. If a bin has >2000 counts, and if more than 50% of those come from <1% of pixels, then it is considered to be noise-dominated and hence unusable.
| Quadrant | # 1 sec bins | Bins with >0 counts | Bins with >2000 counts | High rate bins dominated by noise | Noise dominated (total time) | Noise dominated (detector-on time) | Marked lightcurve |
|---|---|---|---|---|---|---|---|
| A | 86479 | 74433 | 0 | 0 | 0.00% | 0.00% |  |
| B | 86479 | 74430 | 0 | 0 | 0.00% | 0.00% |  |
| C | 86479 | 74434 | 0 | 0 | 0.00% | 0.00% |  |
| D | 86478 | 74398 | 0 | 0 | 0.00% | 0.00% | 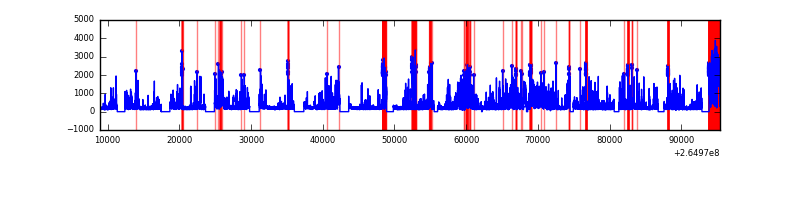 |
Top three noisy pixels from each quadrant. If the there are fewer than three noisy pixels in the level2.evt file, extra rows are filled as -1
| Pixel properties | Quadrant properties | ||||||
|---|---|---|---|---|---|---|---|
| Quadrant | DetID | PixID | Counts | Sigma | Mean | Median | Sigma |
| A | 0 | 29 | 4179 | 10.93 | 1138 | 1069 | 284.5 |
| A | 7 | 110 | 3504 | 8.56 | 1138 | 1069 | 284.5 |
| A | 9 | 19 | 3330 | 7.95 | 1138 | 1069 | 284.5 |
| B | 2 | 9 | 3679 | 12.14 | 1111 | 1064 | 215.3 |
| B | 5 | 128 | 2812 | 8.12 | 1111 | 1064 | 215.3 |
| B | 2 | 8 | 2768 | 7.91 | 1111 | 1064 | 215.3 |
| C | 1 | 80 | 3304 | 7.63 | 1141 | 1067 | 293.2 |
| C | 1 | 81 | 3246 | 7.43 | 1141 | 1067 | 293.2 |
| C | 12 | 241 | 3036 | 6.71 | 1141 | 1067 | 293.2 |
| D | 3 | 14 | 2698 | 6.19 | 1057 | 966 | 279.8 |
| D | 6 | 231 | 2643 | 5.99 | 1057 | 966 | 279.8 |
| D | 10 | 189 | 2632 | 5.96 | 1057 | 966 | 279.8 |
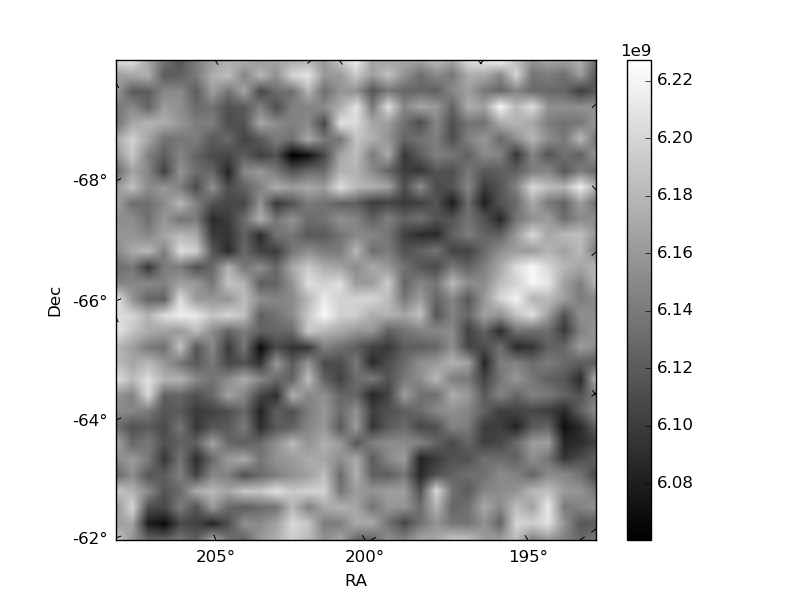
Histogram calculated using DETX and DETY for each event in the final _common_clean file
| Quadrant A | 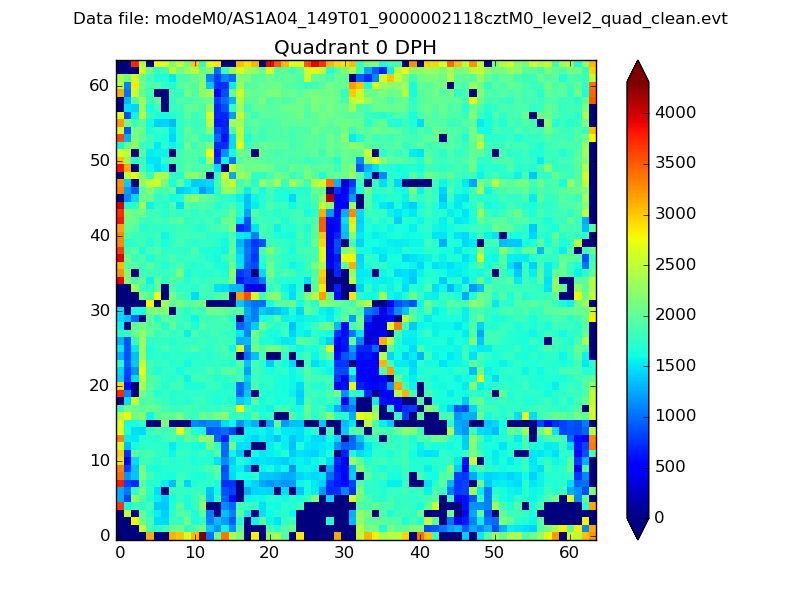 |
 |
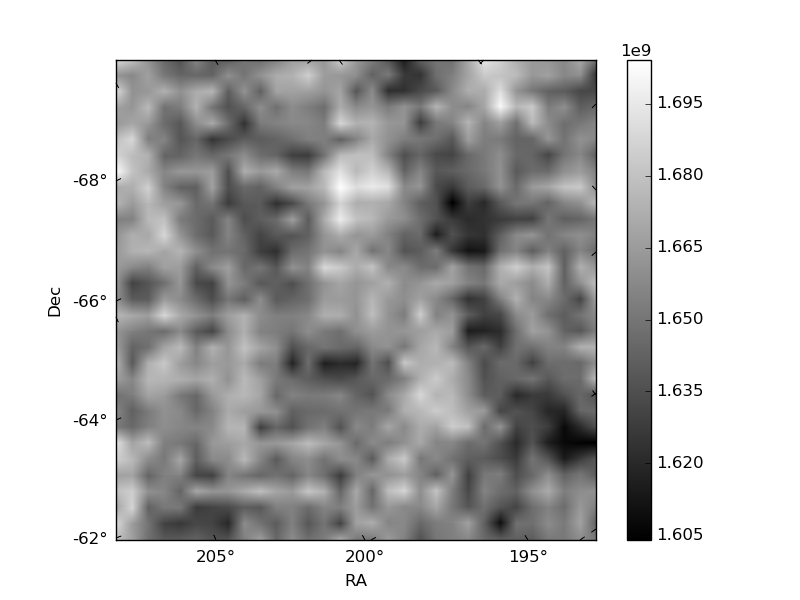
Quadrant B |
|---|---|---|---|
| Quadrant D | 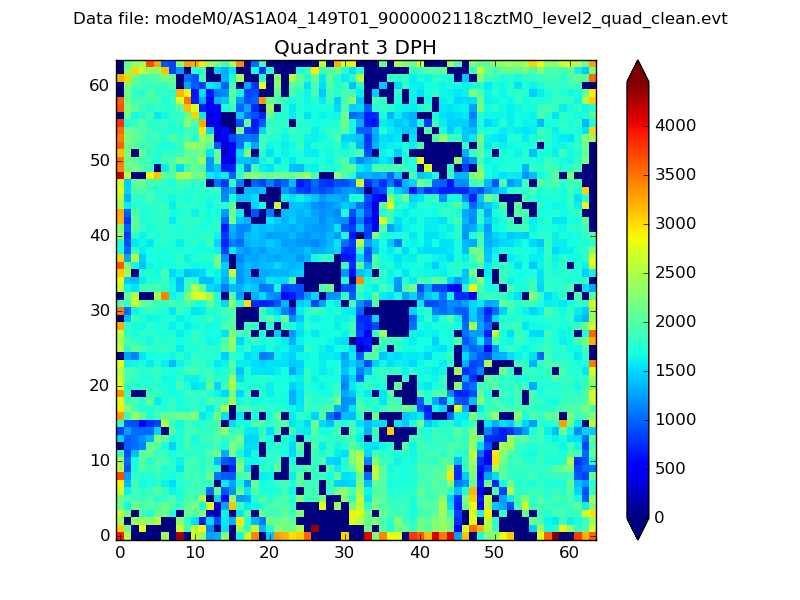 |
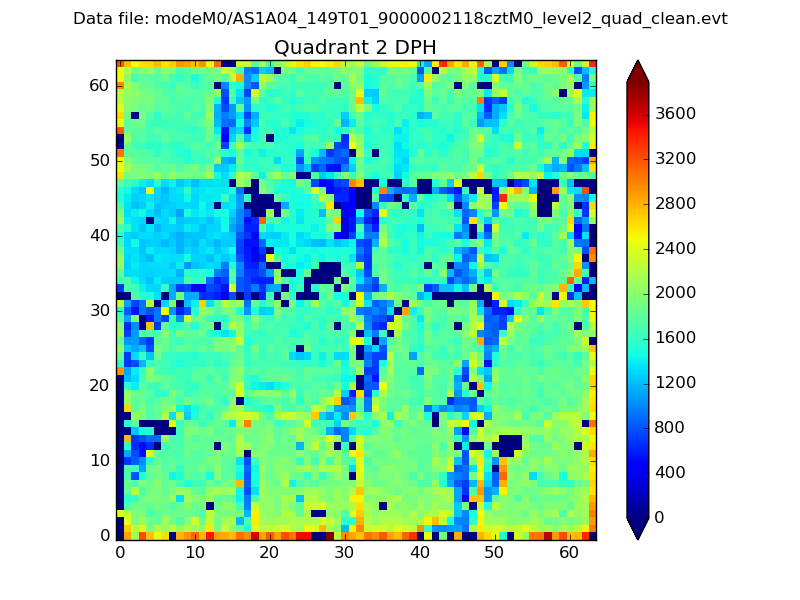 |
Quadrant C |
| Plot type | Count rate plots | Images |
|---|---|---|
| Comparison with Poisson distribution Blue bars denote a histogram of data divided into 1 sec bins. Red curve is a Poisson curve with rate = median count rate of data. |
 |
 |
| Quadrant-wise count rates Data is divided into 100 sec bins |
 |
|
| Module-wise count rates for Quadrant A Data is divided into 100 sec bins |
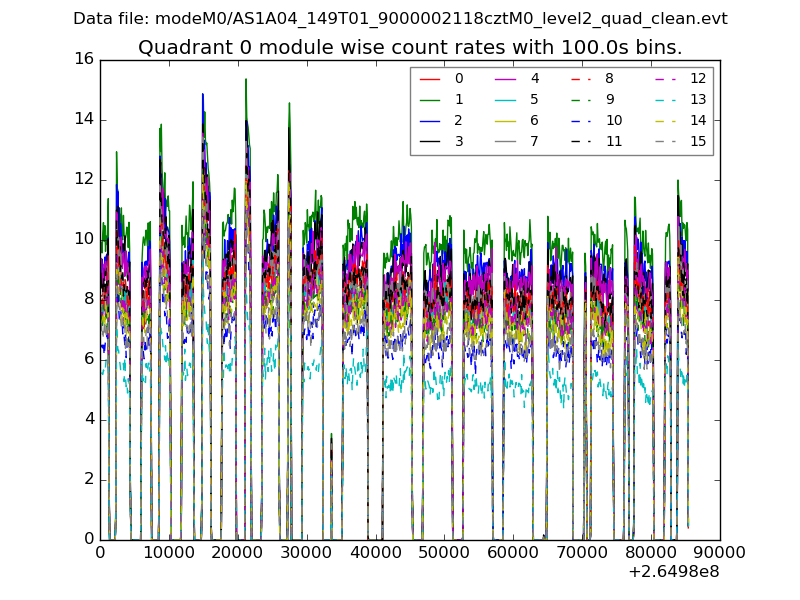 |
 |
| Module-wise count rates for Quadrant B Data is divided into 100 sec bins |
 |
 |
| Module-wise count rates for Quadrant C Data is divided into 100 sec bins |
 |
 |
| Module-wise count rates for Quadrant D Data is divided into 100 sec bins |
 |
 |
| Parameter | Plot |
|---|---|
| CZT HV Monitor |  |
| D_VDD |  |
| Temperature 1 |  |
| Veto HV Monitor |  |
| Veto LLD |  |
| Alpha Counter | 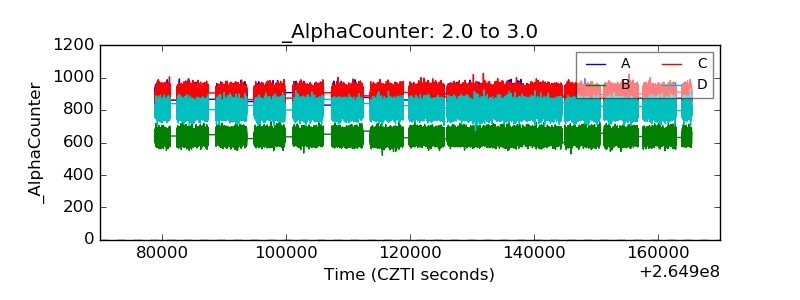 |
| _CPM_Rate | 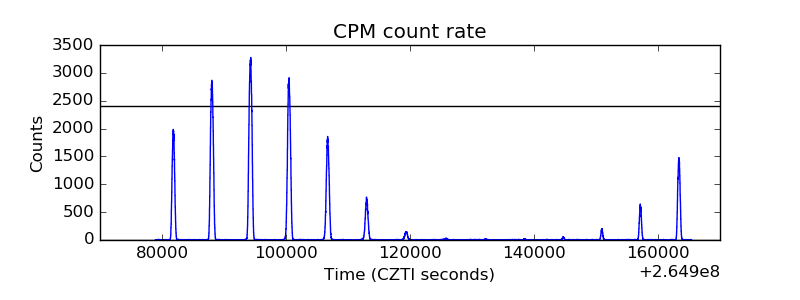 |
| CZT Counter |  |
| +2.5 Volts monitor |  |
| +5 Volts monitor |  |
| _ROLL_ROT | 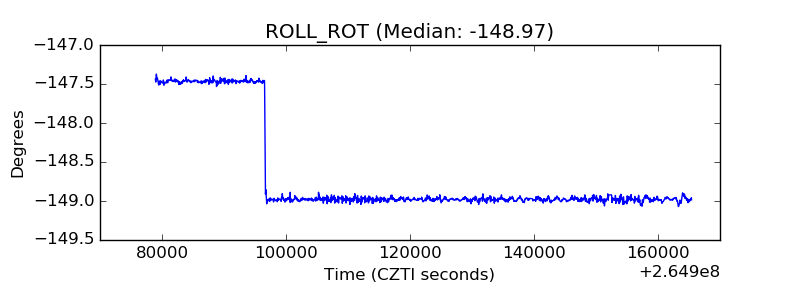 |
| _Roll_DEC | 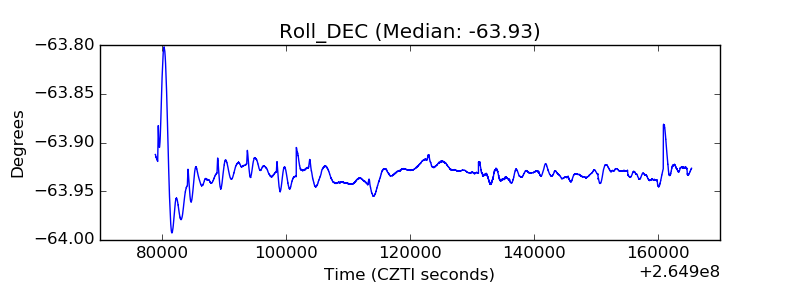 |
| _Roll_RA |  |
| Veto Counter |  |