| Param | Original file | Final file |
|---|---|---|
| Filename | modeM0/AS1A04_149T01_9000002118_14368cztM0_level2.evt | modeM0/AS1A04_149T01_9000002118_14368cztM0_level2_quad_clean.evt |
| Size (bytes) | 260,435,520 | 52,174,080 |
| Size | 248.4 MB | 49.8 MB |
| Events in quadrant A | 1,799,015 | 330,832 |
| Events in quadrant B | 1,982,373 | 335,541 |
| Events in quadrant C | 2,003,999 | 330,935 |
| Events in quadrant D | 1,847,355 | 319,081 |
| Mode SS | |||
|---|---|---|---|
| Quadrant | BADHDUFLAG | Total packets | Discarded packets |
| A | 0 | 76 | 0 |
| B | 0 | 76 | 0 |
| C | 0 | 76 | 0 |
| D | 0 | 76 | 0 |
| Mode M0 | |||
|---|---|---|---|
| Quadrant | BADHDUFLAG | Total packets | Discarded packets |
| A | 0 | 7662 | 2 |
| B | 0 | 8242 | 1 |
| C | 0 | 8037 | 1 |
| D | 0 | 7956 | 1 |
| Mode M9 | |||
|---|---|---|---|
| Quadrant | BADHDUFLAG | Total packets | Discarded packets |
| A | 0 | 11 | 0 |
| B | 0 | 11 | 0 |
| C | 0 | 11 | 0 |
| D | 0 | 11 | 0 |
| Quadrant | Total seconds | Saturated seconds | Saturation percentage |
|---|---|---|---|
| A | 3725 | 9 | 0.241611% |
| B | 3725 | 37 | 0.993289% |
| C | 3725 | 7 | 0.187919% |
| D | 3725 | 16 | 0.429530% |
Noise dominated data is calculated using 1-second bins in cleaned event files. If a bin has >2000 counts, and if more than 50% of those come from <1% of pixels, then it is considered to be noise-dominated and hence unusable.
| Quadrant | # 1 sec bins | Bins with >0 counts | Bins with >2000 counts | High rate bins dominated by noise | Noise dominated (total time) | Noise dominated (detector-on time) | Marked lightcurve |
|---|---|---|---|---|---|---|---|
| A | 4796 | 3727 | 0 | 0 | 0.00% | 0.00% | 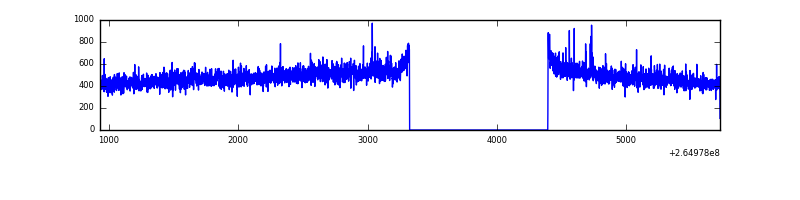 |
| B | 4796 | 3727 | 11 | 11 | 0.23% | 0.30% | 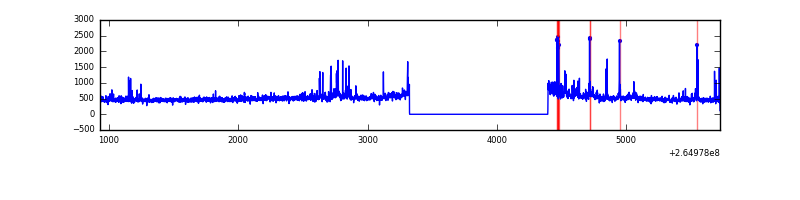 |
| C | 4796 | 3727 | 0 | 0 | 0.00% | 0.00% | 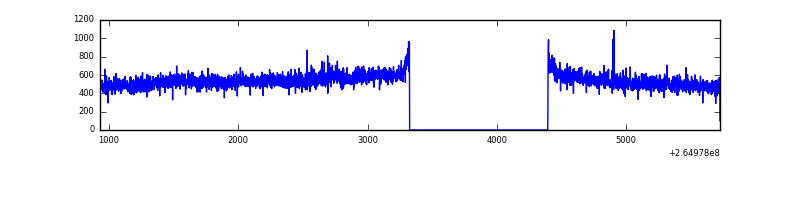 |
| D | 4796 | 3727 | 11 | 11 | 0.23% | 0.30% | 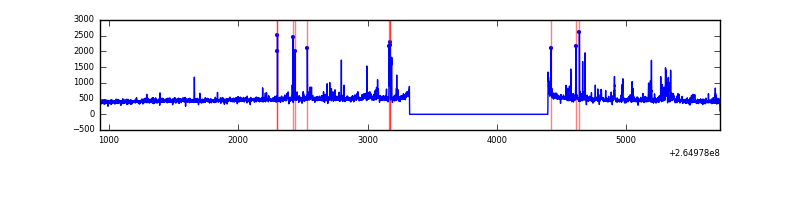 |
Top three noisy pixels from each quadrant. If the there are fewer than three noisy pixels in the level2.evt file, extra rows are filled as -1
| Pixel properties | Quadrant properties | ||||||
|---|---|---|---|---|---|---|---|
| Quadrant | DetID | PixID | Counts | Sigma | Mean | Median | Sigma |
| A | 12 | 189 | 32201 | 336.03 | 457 | 446 | 94.5 |
| A | 0 | 226 | 4180 | 39.51 | 457 | 446 | 94.5 |
| A | 15 | 69 | 3849 | 36.01 | 457 | 446 | 94.5 |
| B | 0 | 229 | 77205 | 876.93 | 456 | 444 | 87.5 |
| B | 0 | 189 | 39494 | 446.11 | 456 | 444 | 87.5 |
| B | 0 | 219 | 16687 | 185.56 | 456 | 444 | 87.5 |
| C | 3 | 233 | 263383 | 2515.49 | 445 | 447 | 104.5 |
| C | 10 | 22 | 5569 | 49.0 | 445 | 447 | 104.5 |
| C | 13 | 61 | 3163 | 25.98 | 445 | 447 | 104.5 |
| D | 2 | 120 | 46692 | 435.22 | 442 | 431 | 106.3 |
| D | 10 | 172 | 45198 | 421.17 | 442 | 431 | 106.3 |
| D | 12 | 110 | 28416 | 263.28 | 442 | 431 | 106.3 |
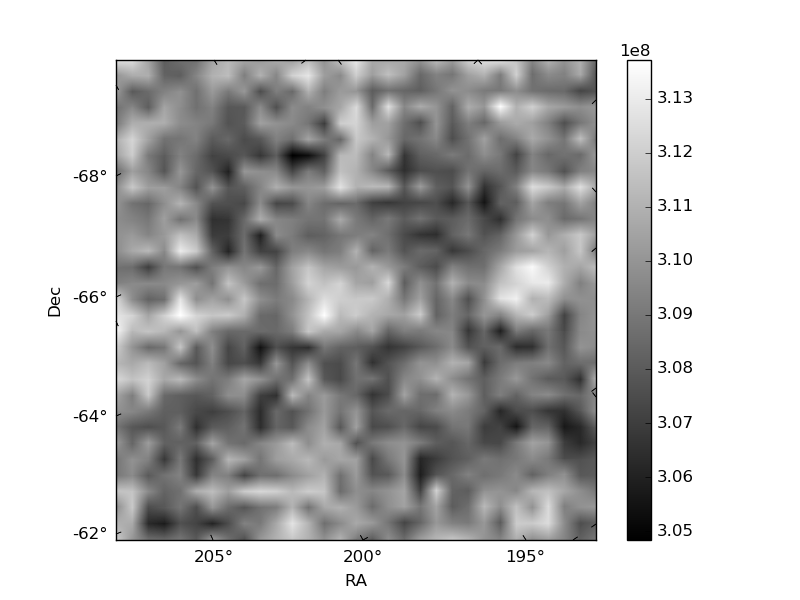
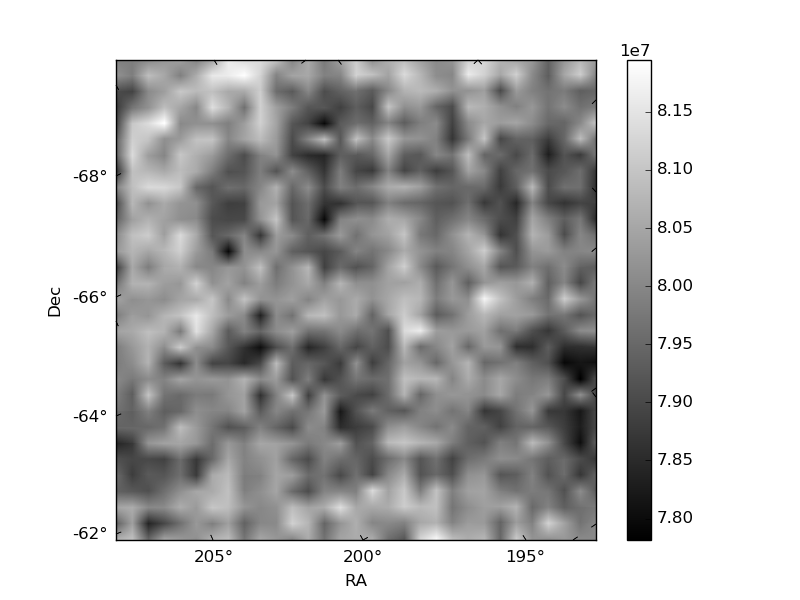
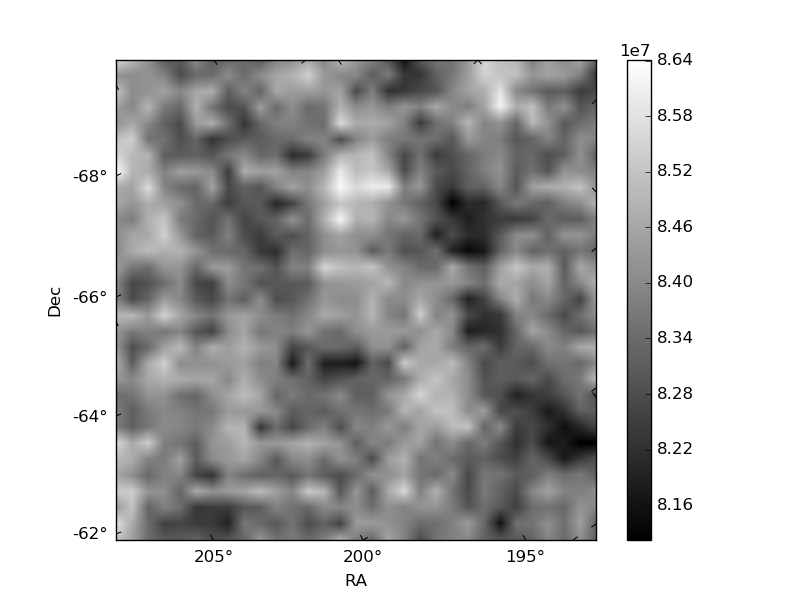
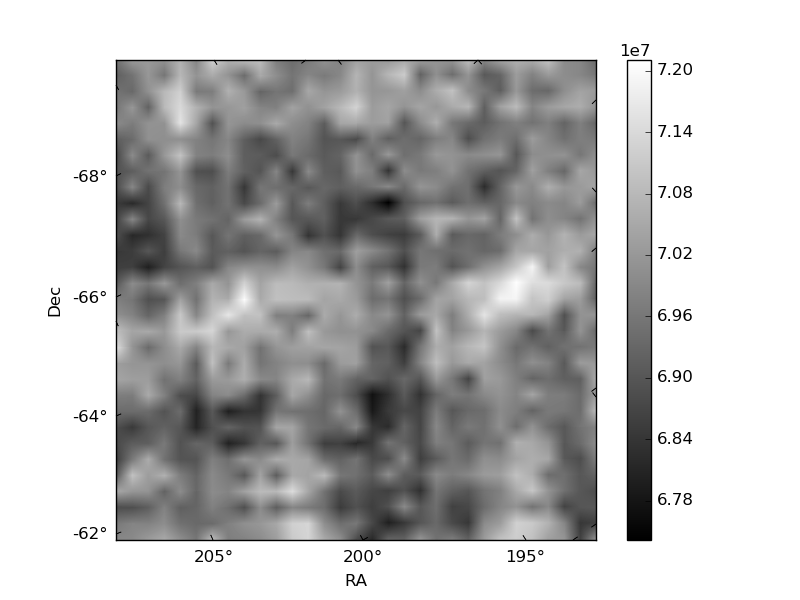
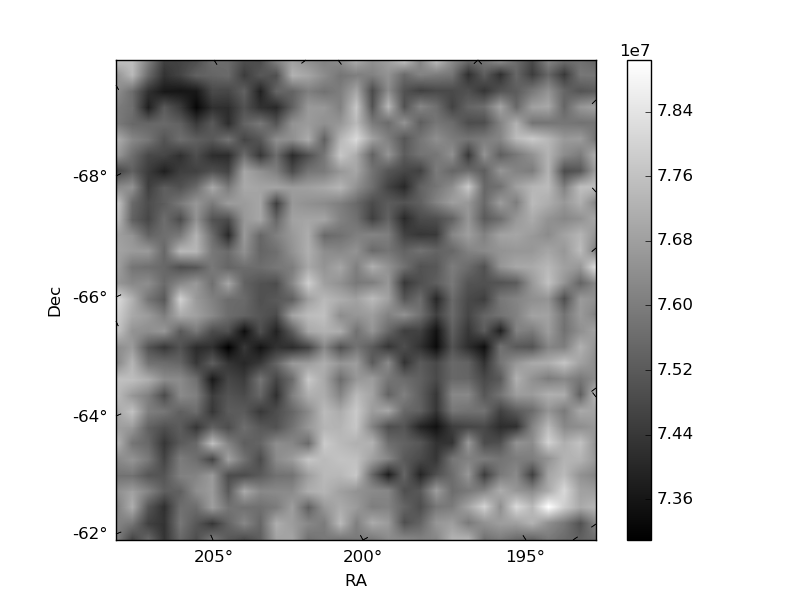
Histogram calculated using DETX and DETY for each event in the final _common_clean file
| Quadrant A | 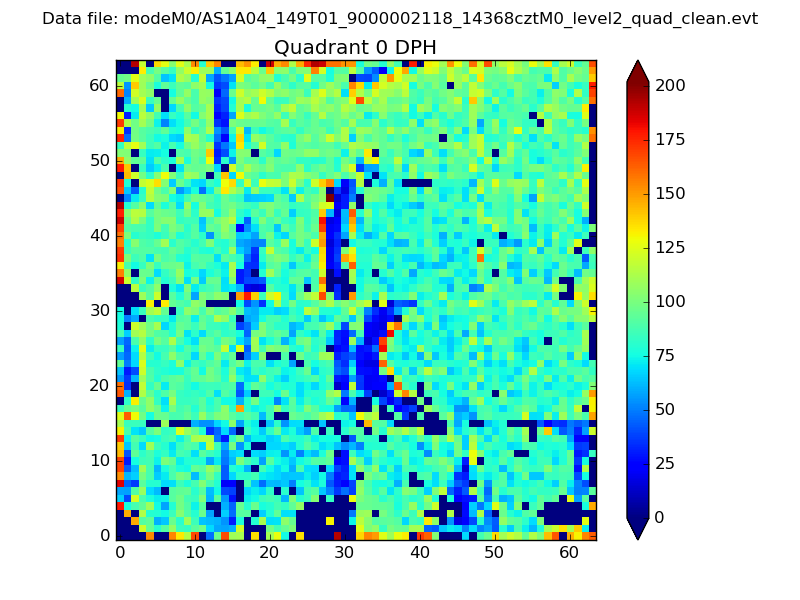 |
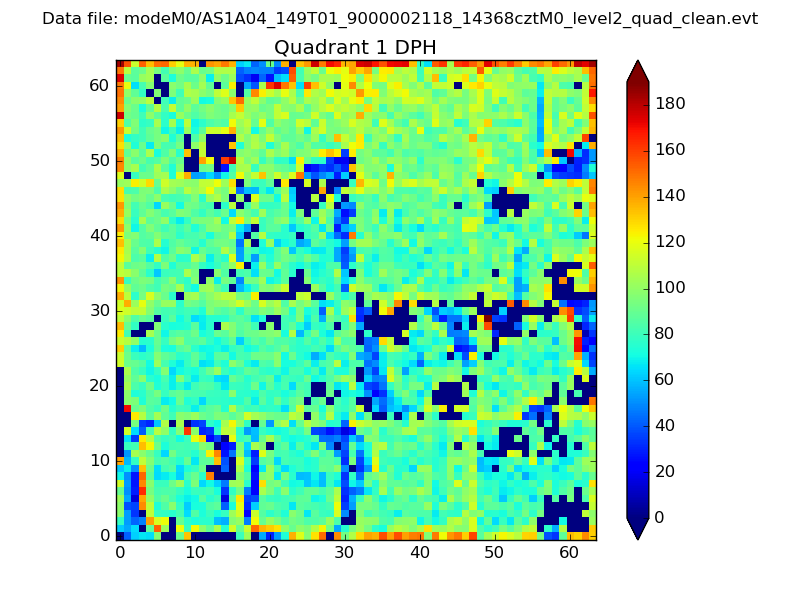 |
Quadrant B |
|---|---|---|---|
| Quadrant D | 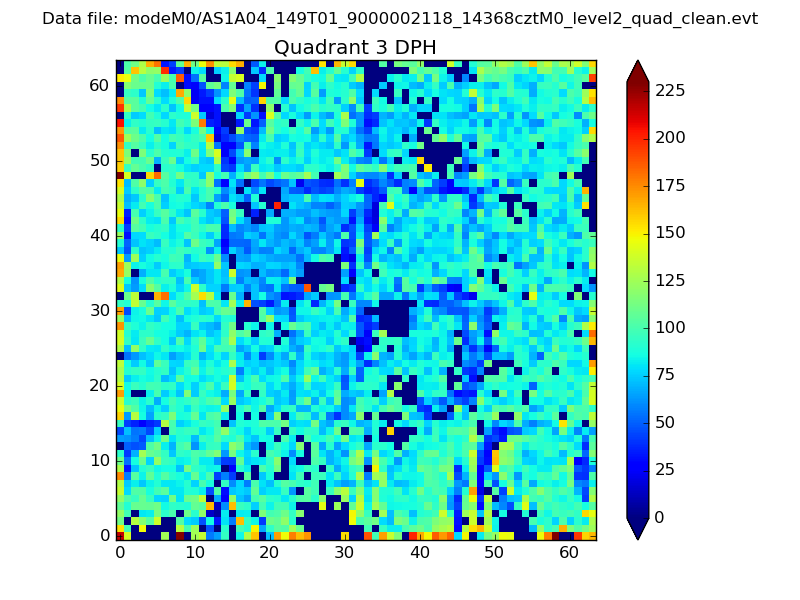 |
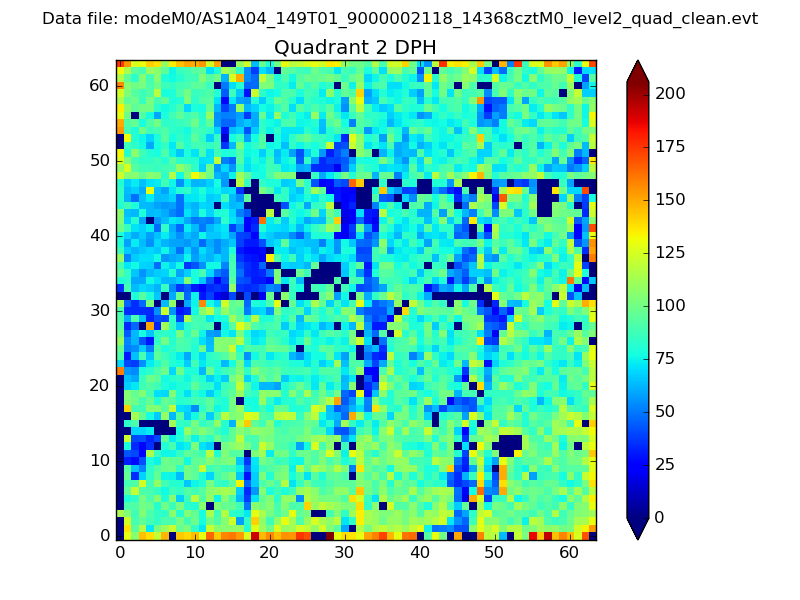 |
Quadrant C |
| Plot type | Count rate plots | Images |
|---|---|---|
| Comparison with Poisson distribution Blue bars denote a histogram of data divided into 1 sec bins. Red curve is a Poisson curve with rate = median count rate of data. |
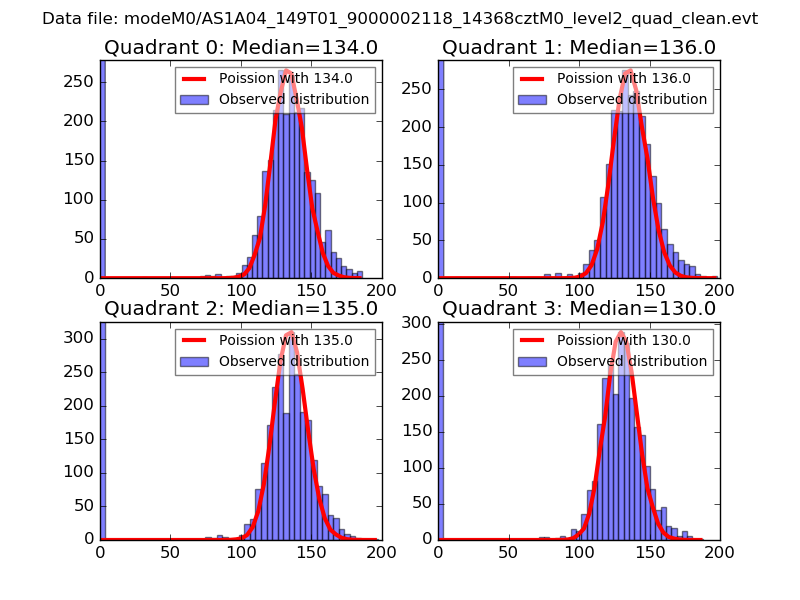 |
 |
| Quadrant-wise count rates Data is divided into 100 sec bins |
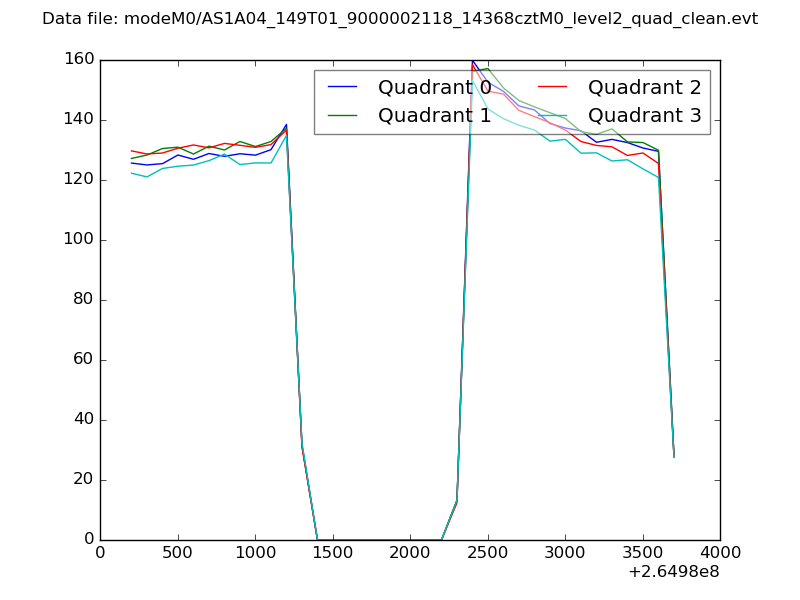 |
|
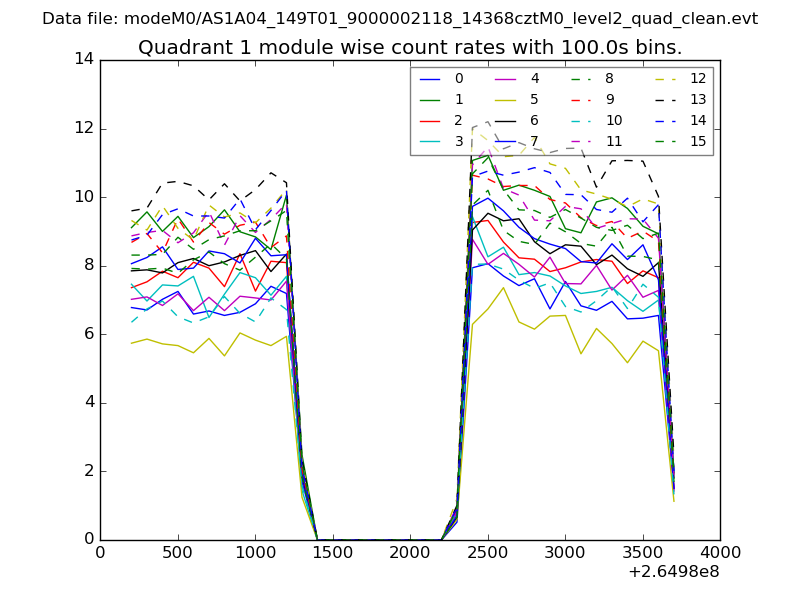
| Module-wise count rates for Quadrant A Data is divided into 100 sec bins |
 |
 |
| Module-wise count rates for Quadrant B Data is divided into 100 sec bins |
 |
 |
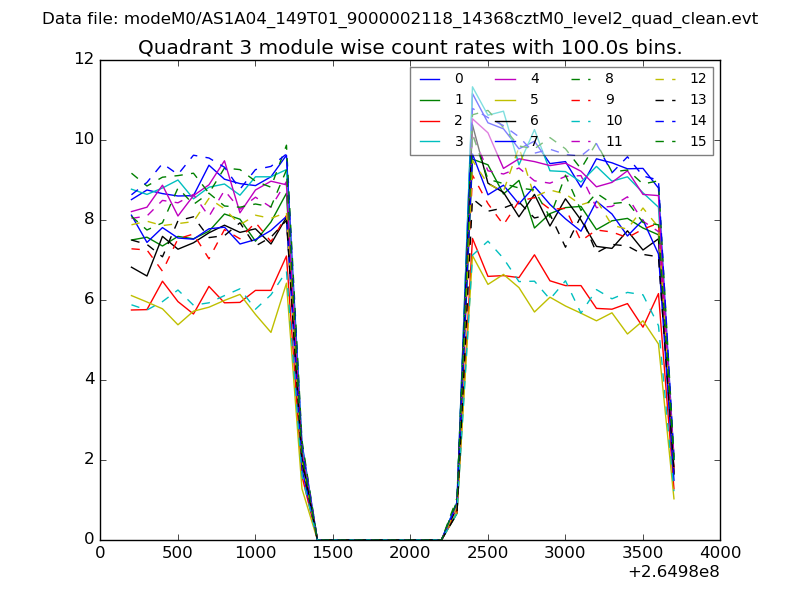
| Module-wise count rates for Quadrant C Data is divided into 100 sec bins |
 |
 |
| Module-wise count rates for Quadrant D Data is divided into 100 sec bins |
 |
 |
| Parameter | Plot |
|---|---|
| CZT HV Monitor | 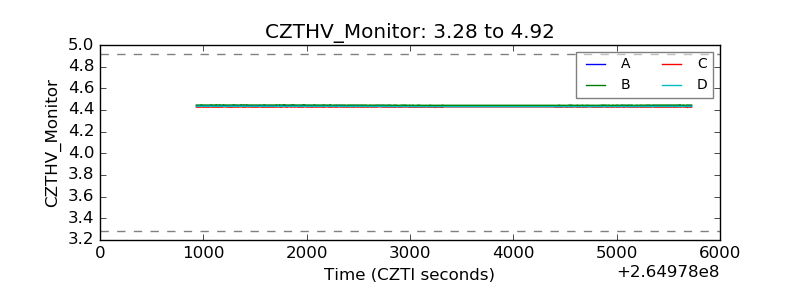 |
| D_VDD | 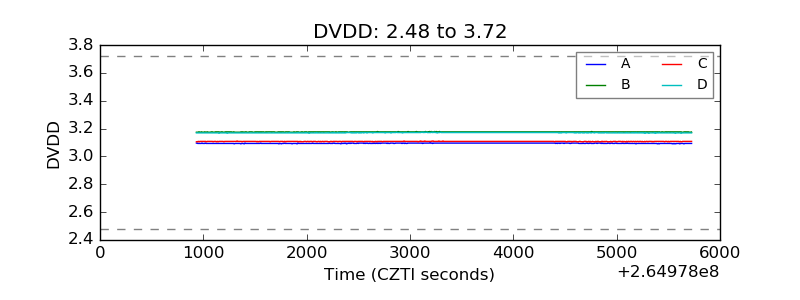 |
| Temperature 1 | 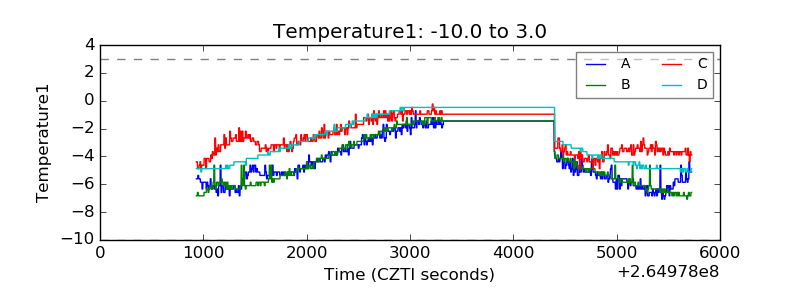 |
| Veto HV Monitor | 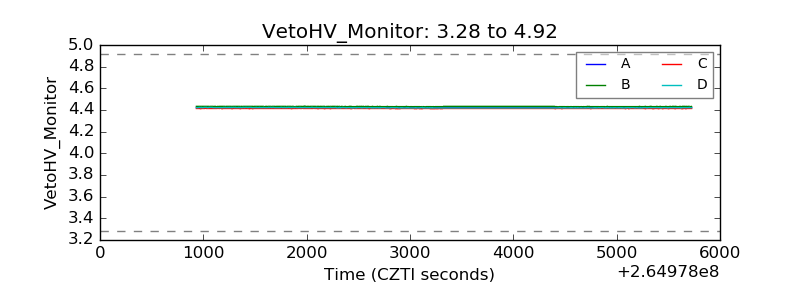 |
| Veto LLD | 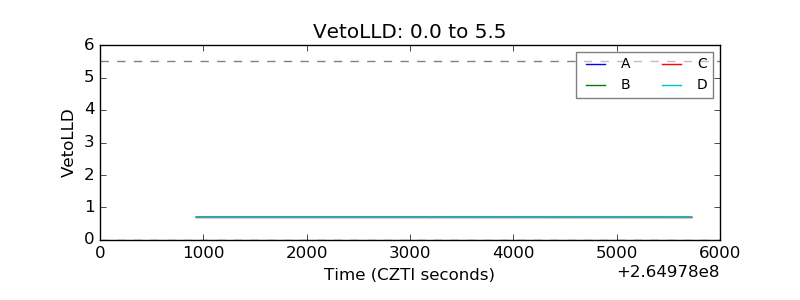 |
| Alpha Counter | 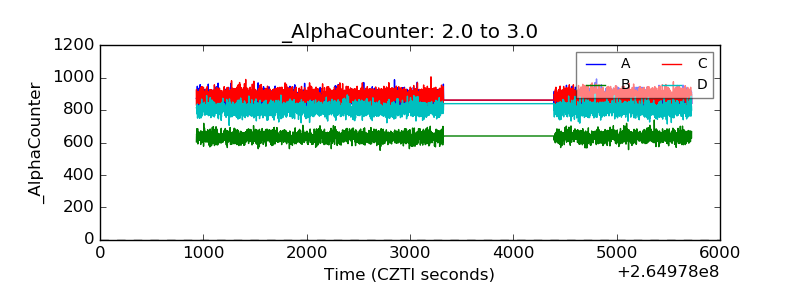 |
| _CPM_Rate | 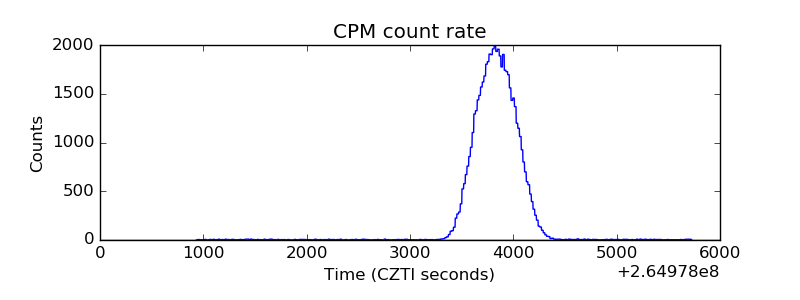 |
| CZT Counter | 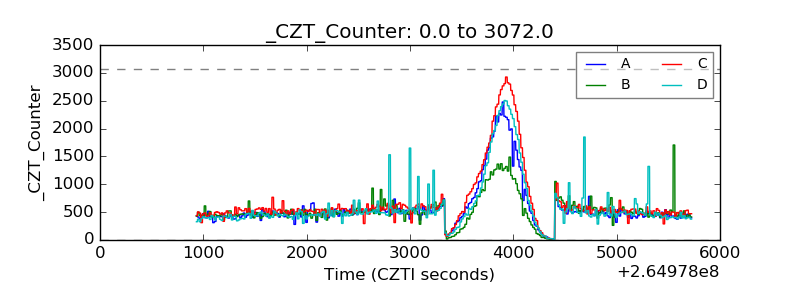 |
| +2.5 Volts monitor |  |
| +5 Volts monitor |  |
| _ROLL_ROT |  |
| _Roll_DEC | 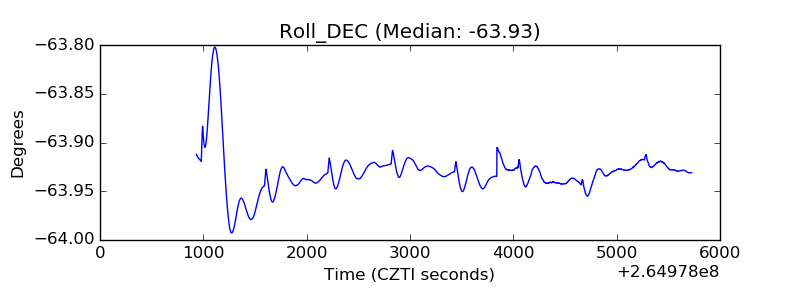 |
| _Roll_RA | 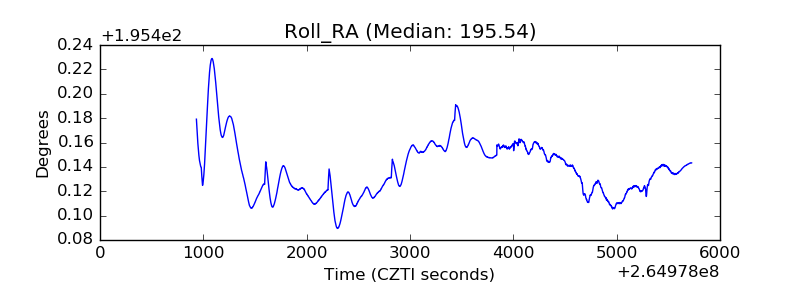 |
| Veto Counter | 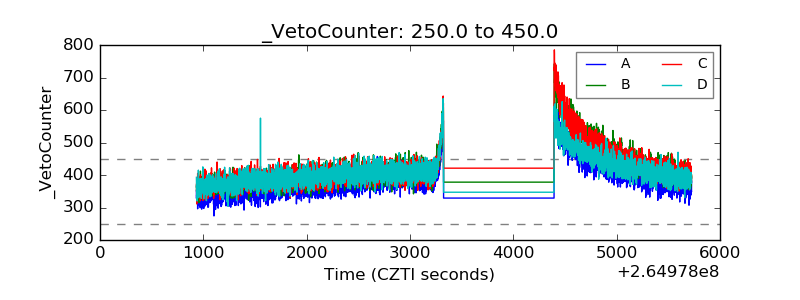 |