| Param | Original file | Final file |
|---|---|---|
| Filename | modeM0/AS1A04_149T01_9000002118_14373cztM0_level2.evt | modeM0/AS1A04_149T01_9000002118_14373cztM0_level2_quad_clean.evt |
| Size (bytes) | 465,603,840 | 89,372,160 |
| Size | 444.0 MB | 85.2 MB |
| Events in quadrant A | 3,266,576 | 565,940 |
| Events in quadrant B | 3,456,861 | 576,095 |
| Events in quadrant C | 3,715,826 | 572,801 |
| Events in quadrant D | 3,236,326 | 554,404 |
| Mode SS | |||
|---|---|---|---|
| Quadrant | BADHDUFLAG | Total packets | Discarded packets |
| A | 0 | 128 | 0 |
| B | 0 | 128 | 0 |
| C | 0 | 128 | 0 |
| D | 0 | 128 | 0 |
| Mode M0 | |||
|---|---|---|---|
| Quadrant | BADHDUFLAG | Total packets | Discarded packets |
| A | 0 | 13430 | 3 |
| B | 0 | 14068 | 2 |
| C | 0 | 15117 | 2 |
| D | 0 | 13433 | 2 |
| Mode M9 | |||
|---|---|---|---|
| Quadrant | BADHDUFLAG | Total packets | Discarded packets |
| A | 0 | 16 | 0 |
| B | 0 | 16 | 0 |
| C | 0 | 16 | 0 |
| D | 0 | 17 | 0 |
| Quadrant | Total seconds | Saturated seconds | Saturation percentage |
|---|---|---|---|
| A | 6262 | 57 | 0.910252% |
| B | 6262 | 86 | 1.373363% |
| C | 6262 | 71 | 1.133823% |
| D | 6262 | 53 | 0.846375% |
Noise dominated data is calculated using 1-second bins in cleaned event files. If a bin has >2000 counts, and if more than 50% of those come from <1% of pixels, then it is considered to be noise-dominated and hence unusable.
| Quadrant | # 1 sec bins | Bins with >0 counts | Bins with >2000 counts | High rate bins dominated by noise | Noise dominated (total time) | Noise dominated (detector-on time) | Marked lightcurve |
|---|---|---|---|---|---|---|---|
| A | 7593 | 6264 | 0 | 0 | 0.00% | 0.00% | 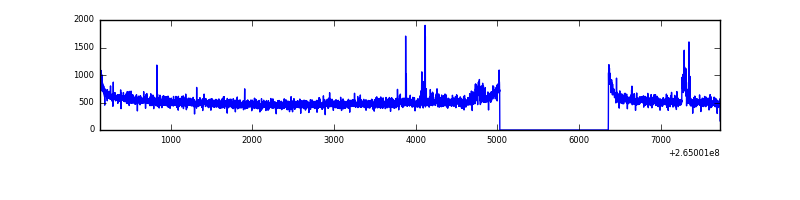 |
| B | 7593 | 6263 | 12 | 12 | 0.16% | 0.19% | 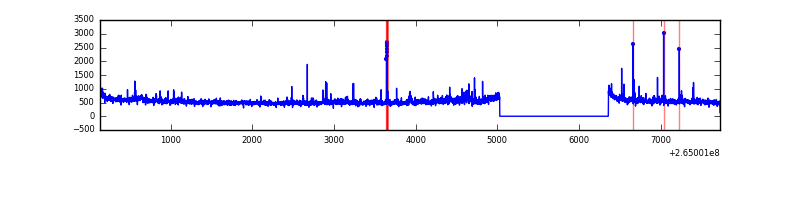 |
| C | 7593 | 6264 | 5 | 5 | 0.07% | 0.08% | 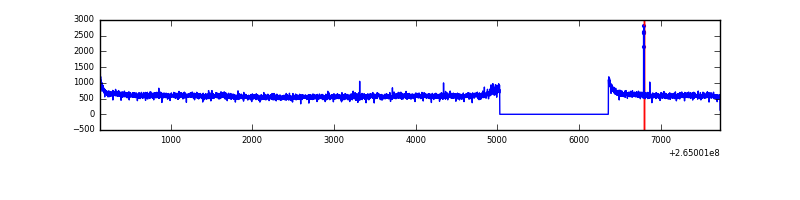 |
| D | 7593 | 6264 | 18 | 18 | 0.24% | 0.29% | 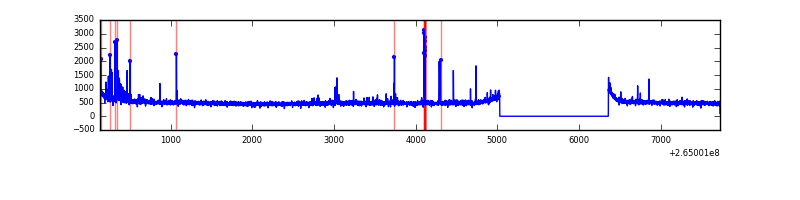 |
Top three noisy pixels from each quadrant. If the there are fewer than three noisy pixels in the level2.evt file, extra rows are filled as -1
| Pixel properties | Quadrant properties | ||||||
|---|---|---|---|---|---|---|---|
| Quadrant | DetID | PixID | Counts | Sigma | Mean | Median | Sigma |
| A | 12 | 189 | 85835 | 520.24 | 822 | 809 | 163.4 |
| A | 3 | 1 | 8412 | 46.52 | 822 | 809 | 163.4 |
| A | 0 | 226 | 7317 | 39.82 | 822 | 809 | 163.4 |
| B | 0 | 229 | 103595 | 679.29 | 824 | 805 | 151.3 |
| B | 0 | 189 | 58650 | 382.27 | 824 | 805 | 151.3 |
| B | 0 | 214 | 36865 | 238.3 | 824 | 805 | 151.3 |
| C | 3 | 233 | 524358 | 2845.59 | 814 | 820 | 184.0 |
| C | 14 | 234 | 16735 | 86.5 | 814 | 820 | 184.0 |
| C | 13 | 61 | 5906 | 27.64 | 814 | 820 | 184.0 |
| D | 12 | 110 | 58761 | 306.27 | 806 | 787 | 189.3 |
| D | 2 | 120 | 56938 | 296.64 | 806 | 787 | 189.3 |
| D | 10 | 199 | 29338 | 150.83 | 806 | 787 | 189.3 |
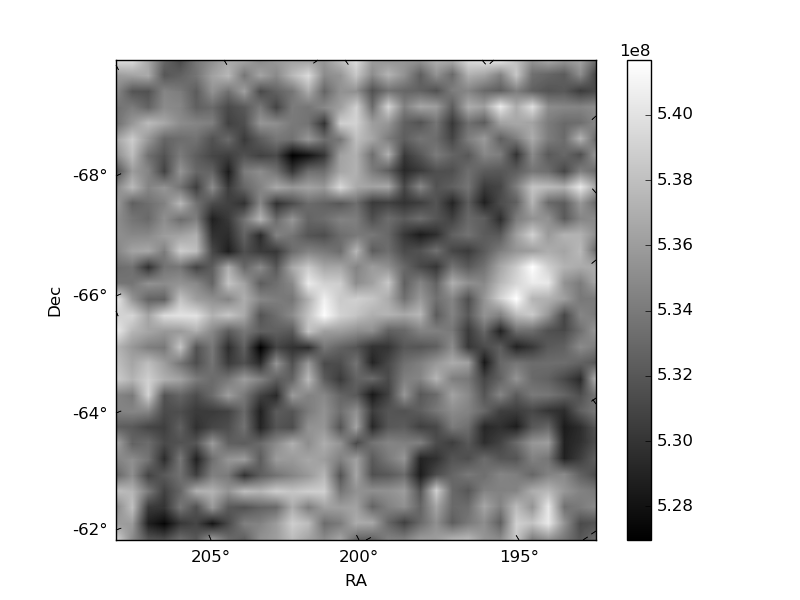
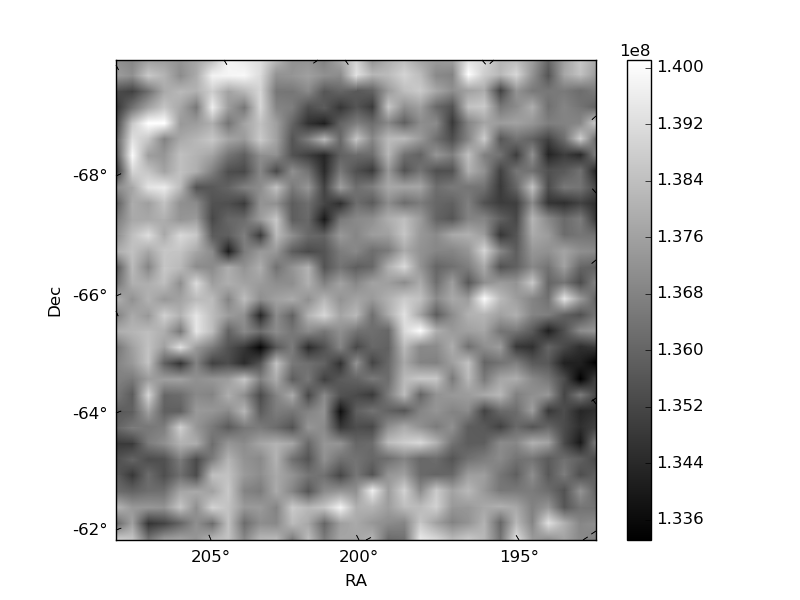
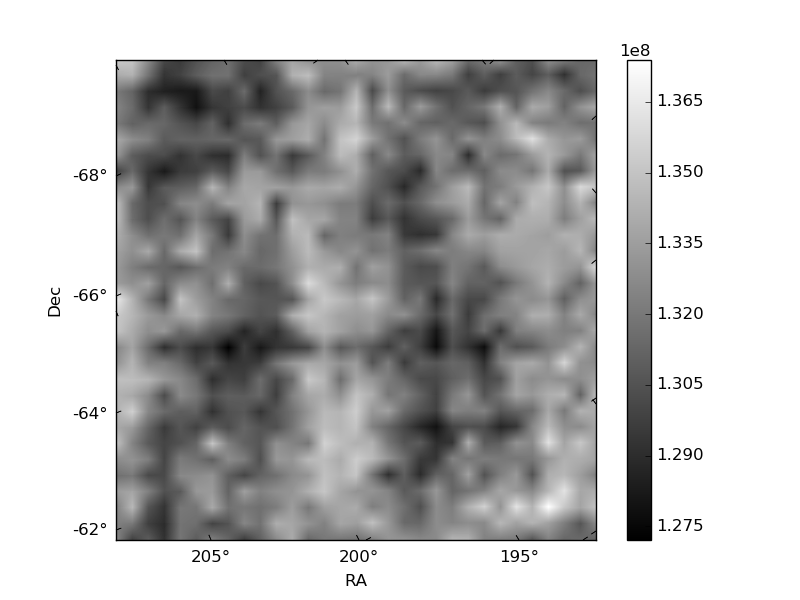
Histogram calculated using DETX and DETY for each event in the final _common_clean file
| Quadrant A | 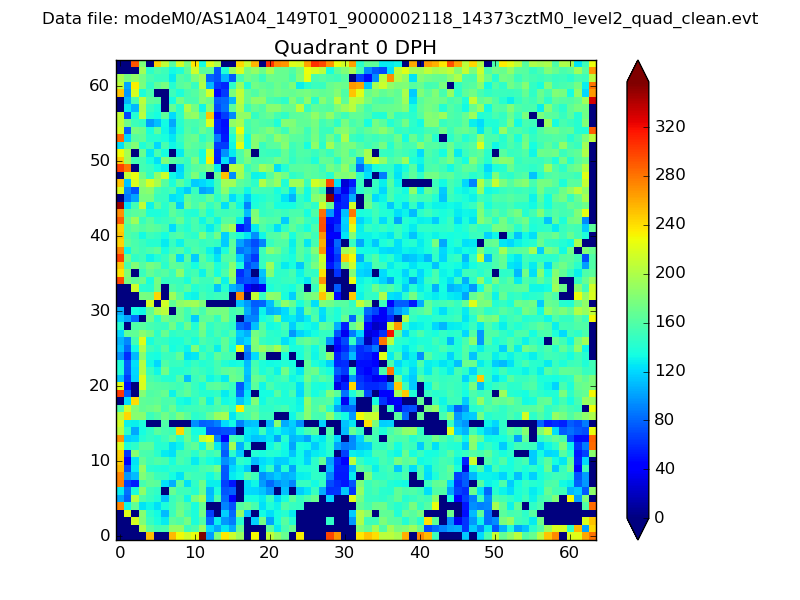 |
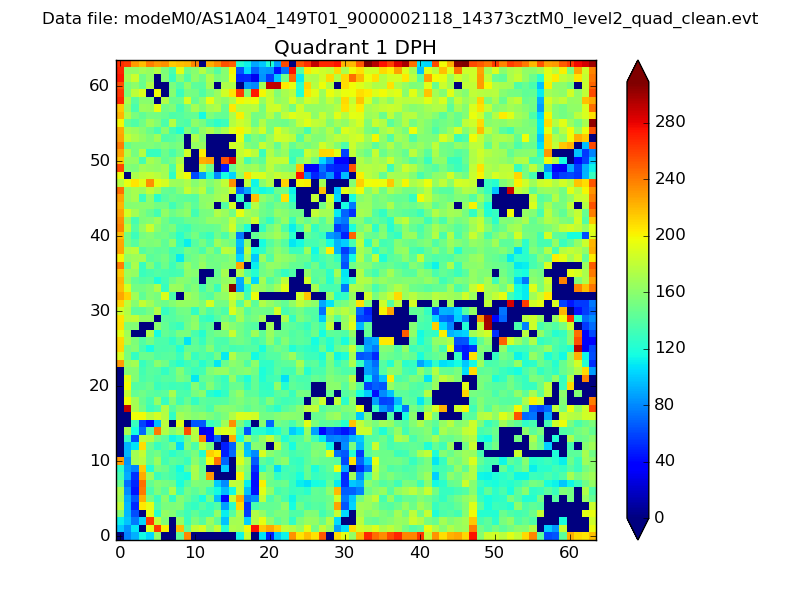 |
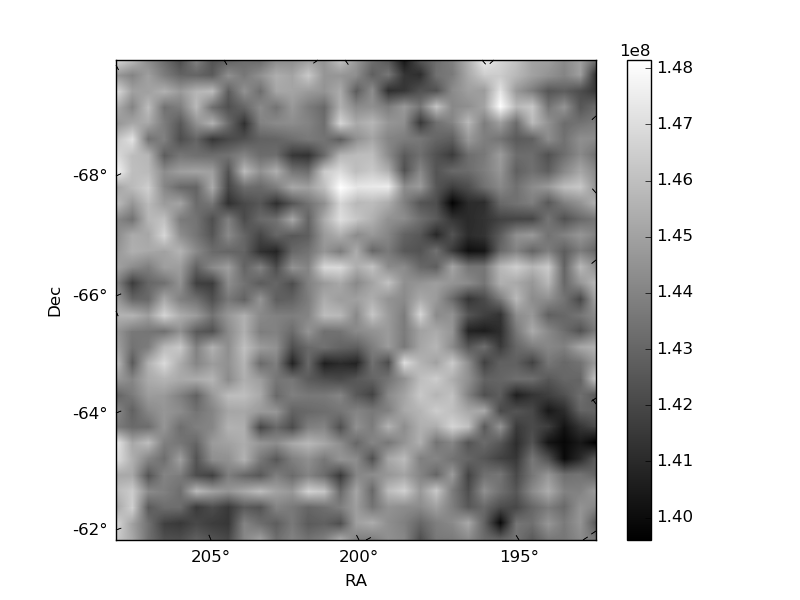
Quadrant B |
|---|---|---|---|
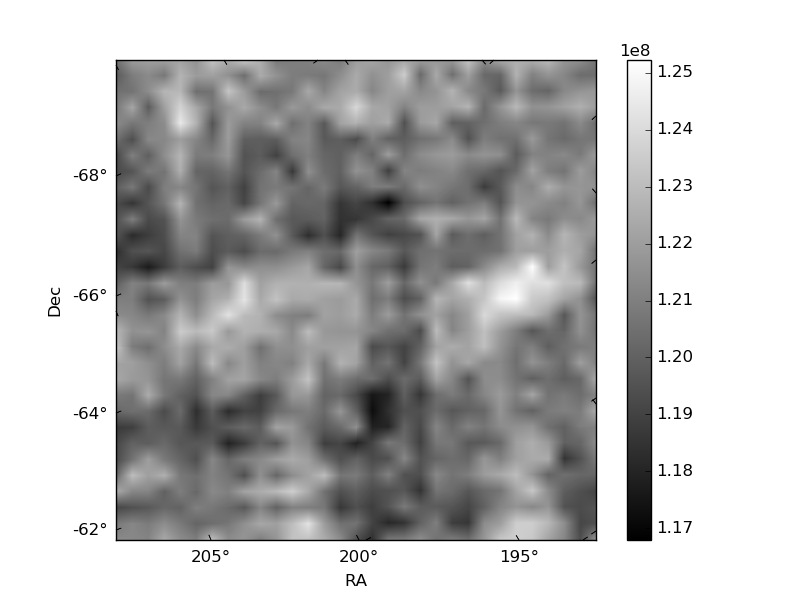
| Quadrant D | 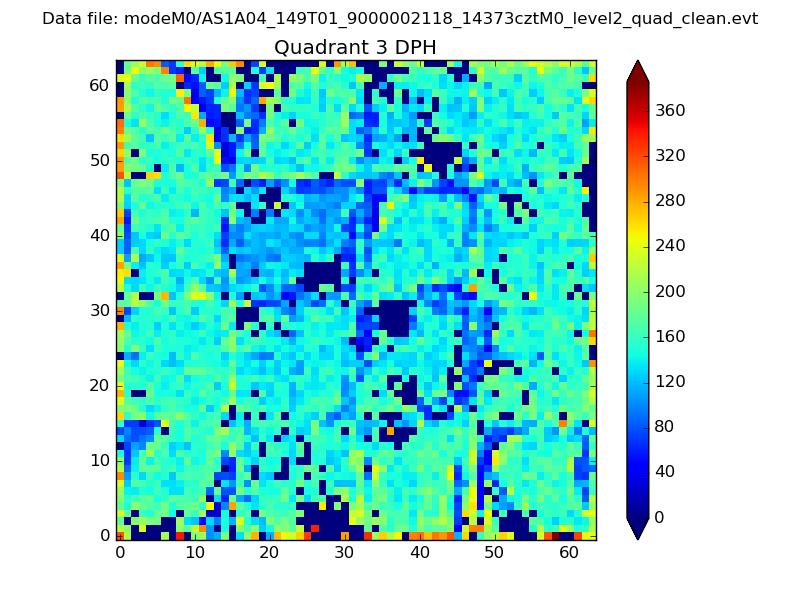 |
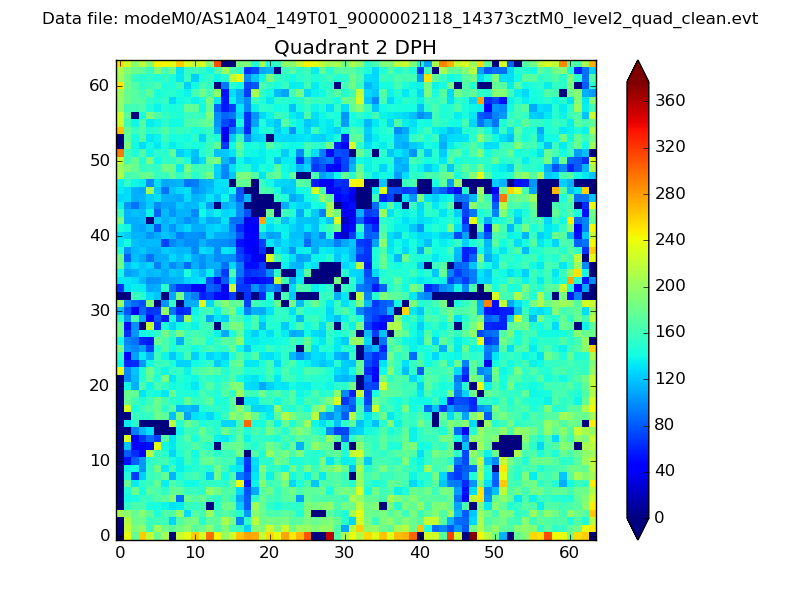 |
Quadrant C |
| Plot type | Count rate plots | Images |
|---|---|---|
| Comparison with Poisson distribution Blue bars denote a histogram of data divided into 1 sec bins. Red curve is a Poisson curve with rate = median count rate of data. |
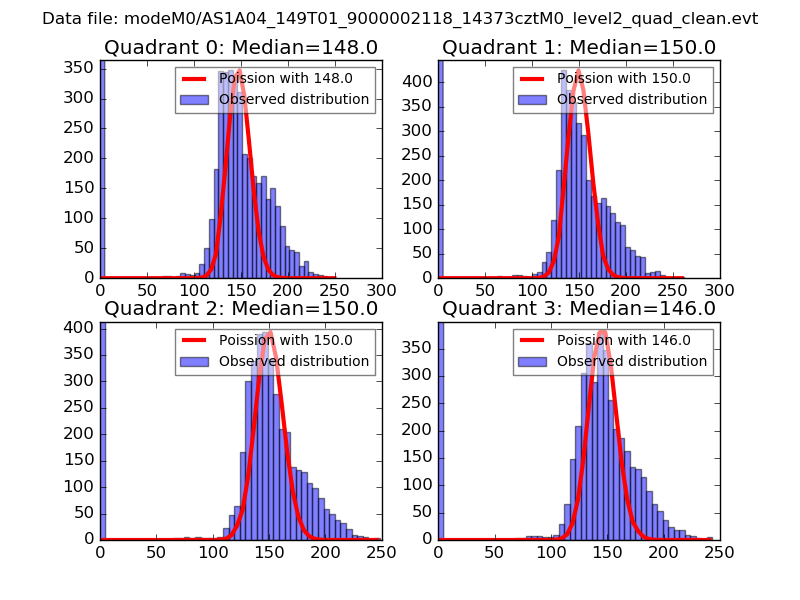 |
 |
| Quadrant-wise count rates Data is divided into 100 sec bins |
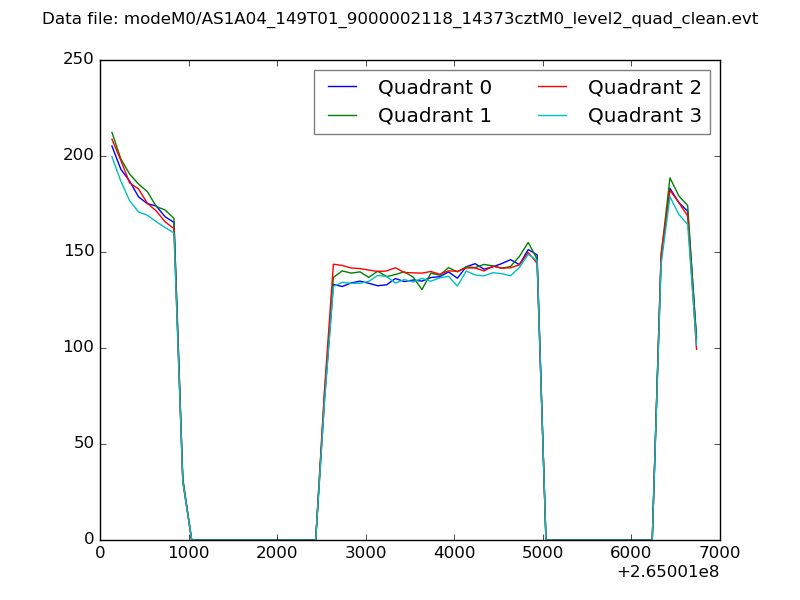 |
|
| Module-wise count rates for Quadrant A Data is divided into 100 sec bins |
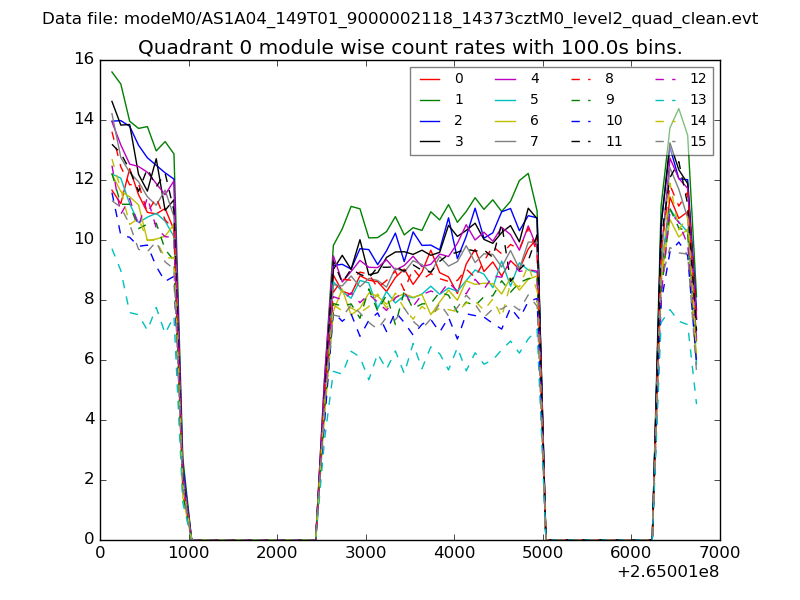 |
 |
| Module-wise count rates for Quadrant B Data is divided into 100 sec bins |
 |
 |
| Module-wise count rates for Quadrant C Data is divided into 100 sec bins |
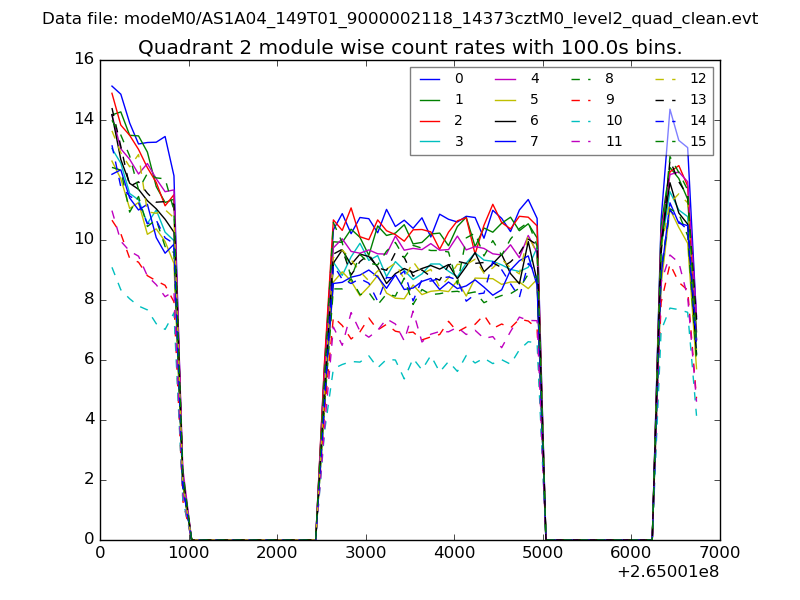 |
 |
| Module-wise count rates for Quadrant D Data is divided into 100 sec bins |
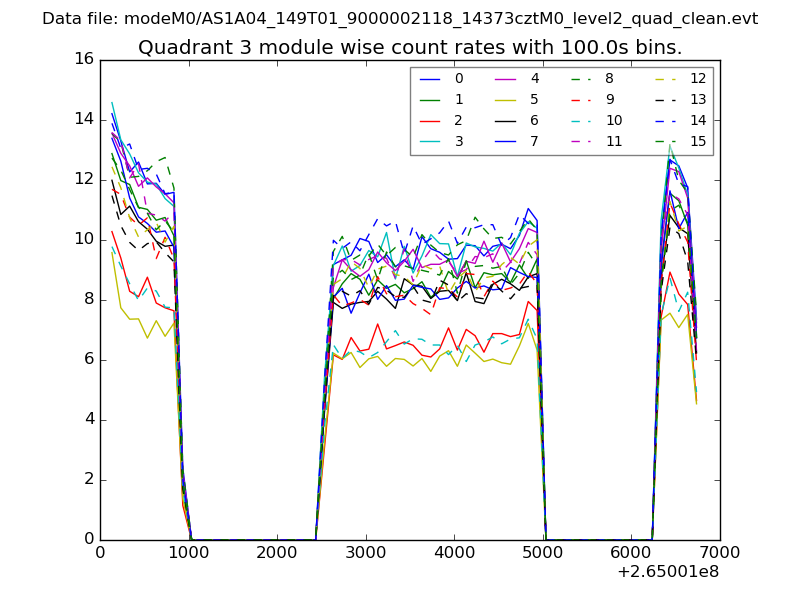 |
 |
| Parameter | Plot |
|---|---|
| CZT HV Monitor | 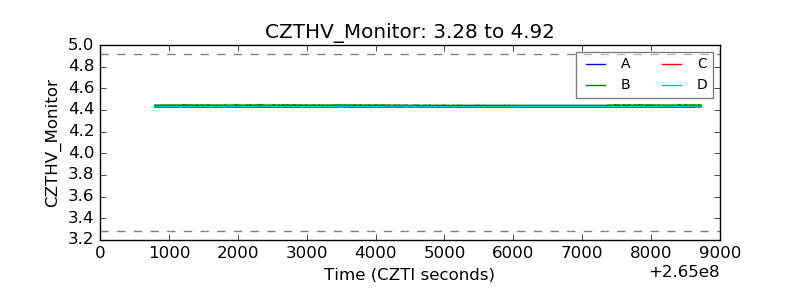 |
| D_VDD |  |
| Temperature 1 | 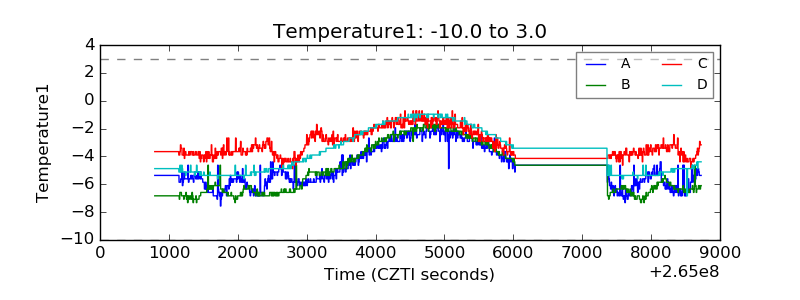 |
| Veto HV Monitor | 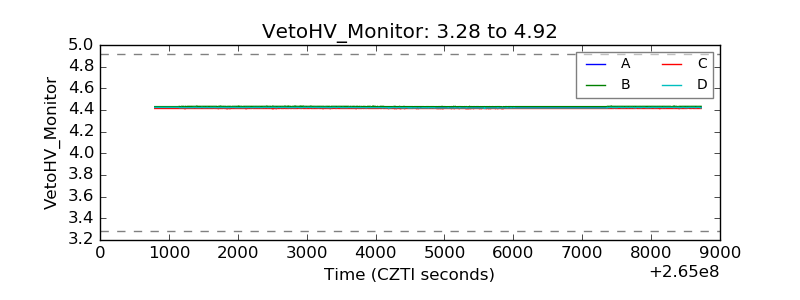 |
| Veto LLD |  |
| Alpha Counter | 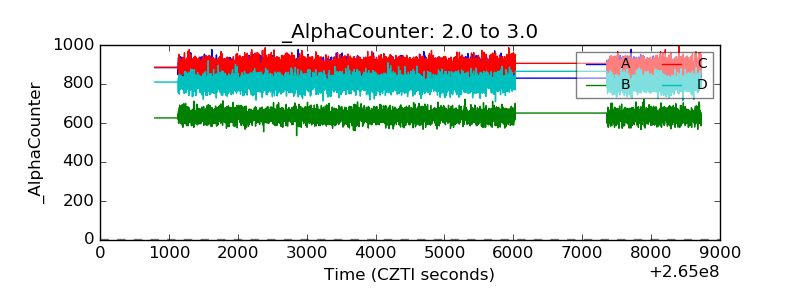 |
| _CPM_Rate | 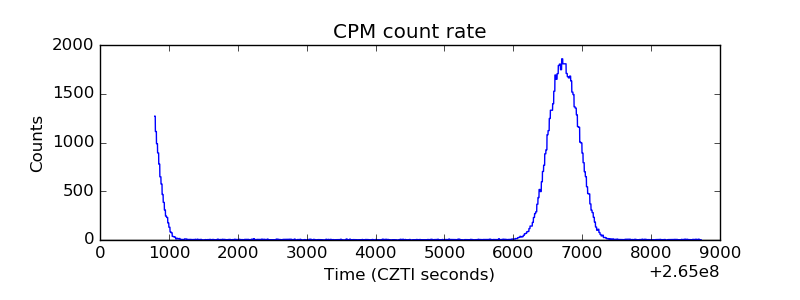 |
| CZT Counter | 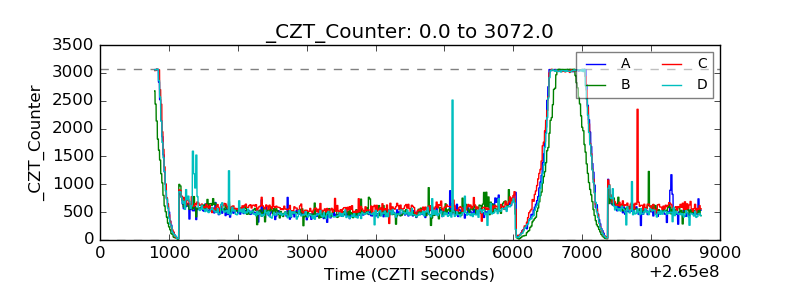 |
| +2.5 Volts monitor |  |
| +5 Volts monitor |  |
| _ROLL_ROT | 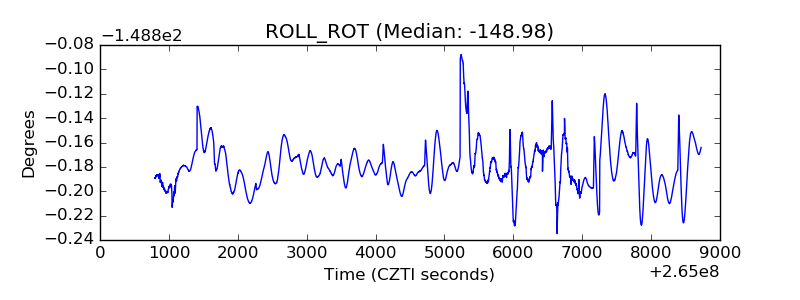 |
| _Roll_DEC | 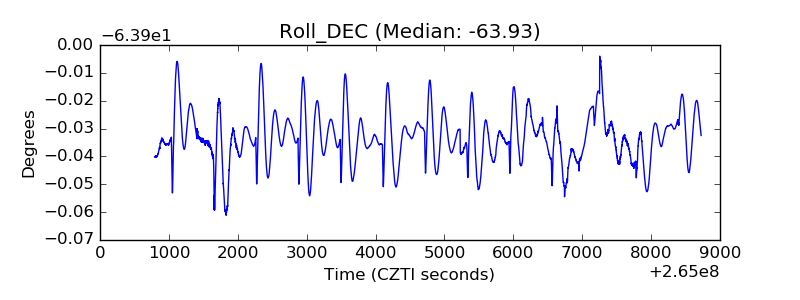 |
| _Roll_RA | 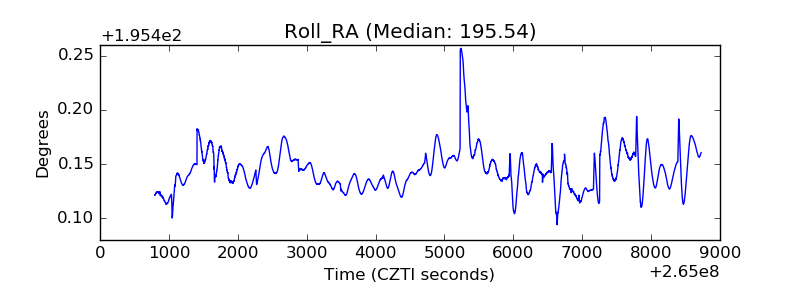 |
| Veto Counter | 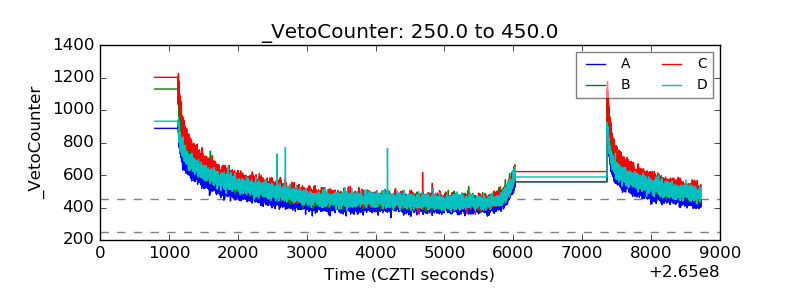 |