| Param | Original file | Final file |
|---|---|---|
| Filename | modeM0/AS1A04_149T01_9000002118_14374cztM0_level2.evt | modeM0/AS1A04_149T01_9000002118_14374cztM0_level2_quad_clean.evt |
| Size (bytes) | 478,497,600 | 78,773,760 |
| Size | 456.3 MB | 75.1 MB |
| Events in quadrant A | 3,224,714 | 489,146 |
| Events in quadrant B | 3,477,130 | 492,267 |
| Events in quadrant C | 3,725,526 | 490,108 |
| Events in quadrant D | 3,633,779 | 471,627 |
| Mode SS | |||
|---|---|---|---|
| Quadrant | BADHDUFLAG | Total packets | Discarded packets |
| A | 0 | 128 | 0 |
| B | 0 | 128 | 0 |
| C | 0 | 128 | 0 |
| D | 0 | 128 | 0 |
| Mode M0 | |||
|---|---|---|---|
| Quadrant | BADHDUFLAG | Total packets | Discarded packets |
| A | 0 | 13386 | 3 |
| B | 0 | 14161 | 2 |
| C | 0 | 14967 | 2 |
| D | 0 | 14851 | 2 |
| Mode M9 | |||
|---|---|---|---|
| Quadrant | BADHDUFLAG | Total packets | Discarded packets |
| A | 0 | 15 | 0 |
| B | 0 | 15 | 0 |
| C | 0 | 15 | 0 |
| D | 0 | 16 | 0 |
| Quadrant | Total seconds | Saturated seconds | Saturation percentage |
|---|---|---|---|
| A | 6338 | 105 | 1.656674% |
| B | 6338 | 150 | 2.366677% |
| C | 6338 | 115 | 1.814453% |
| D | 6338 | 177 | 2.792679% |
Noise dominated data is calculated using 1-second bins in cleaned event files. If a bin has >2000 counts, and if more than 50% of those come from <1% of pixels, then it is considered to be noise-dominated and hence unusable.
| Quadrant | # 1 sec bins | Bins with >0 counts | Bins with >2000 counts | High rate bins dominated by noise | Noise dominated (total time) | Noise dominated (detector-on time) | Marked lightcurve |
|---|---|---|---|---|---|---|---|
| A | 7569 | 6339 | 2 | 2 | 0.03% | 0.03% | 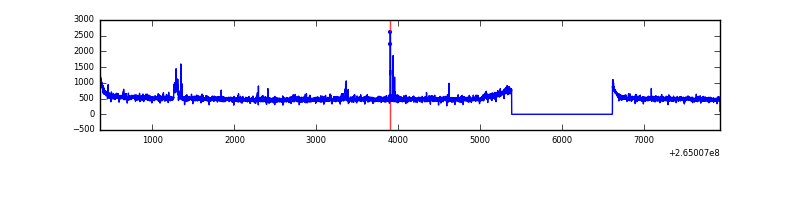 |
| B | 7569 | 6339 | 13 | 13 | 0.17% | 0.21% | 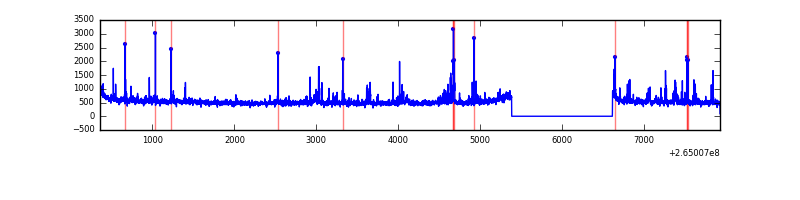 |
| C | 7569 | 6339 | 5 | 5 | 0.07% | 0.08% | 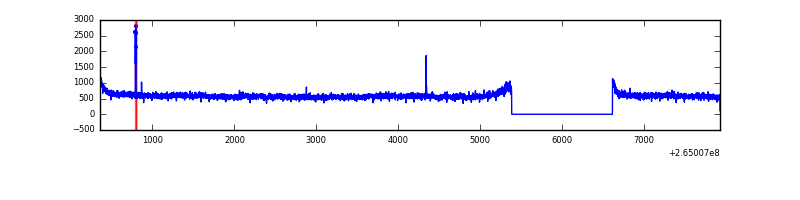 |
| D | 7569 | 6339 | 19 | 19 | 0.25% | 0.30% | 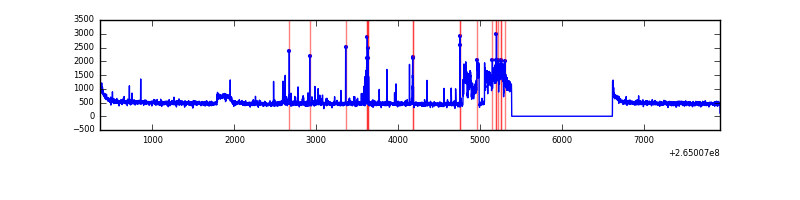 |
Top three noisy pixels from each quadrant. If the there are fewer than three noisy pixels in the level2.evt file, extra rows are filled as -1
| Pixel properties | Quadrant properties | ||||||
|---|---|---|---|---|---|---|---|
| Quadrant | DetID | PixID | Counts | Sigma | Mean | Median | Sigma |
| A | 12 | 189 | 66674 | 405.03 | 813 | 795 | 162.7 |
| A | 15 | 69 | 13738 | 79.57 | 813 | 795 | 162.7 |
| A | 8 | 15 | 13046 | 75.32 | 813 | 795 | 162.7 |
| B | 0 | 229 | 169173 | 1125.51 | 811 | 791 | 149.6 |
| B | 4 | 142 | 47944 | 315.18 | 811 | 791 | 149.6 |
| B | 0 | 214 | 27482 | 178.41 | 811 | 791 | 149.6 |
| C | 3 | 233 | 580581 | 3217.96 | 801 | 805 | 180.2 |
| C | 14 | 234 | 19327 | 102.8 | 801 | 805 | 180.2 |
| C | 13 | 61 | 5804 | 27.74 | 801 | 805 | 180.2 |
| D | 12 | 110 | 469188 | 2504.4 | 791 | 771 | 187.0 |
| D | 2 | 120 | 60451 | 319.08 | 791 | 771 | 187.0 |
| D | 2 | 152 | 53886 | 283.98 | 791 | 771 | 187.0 |
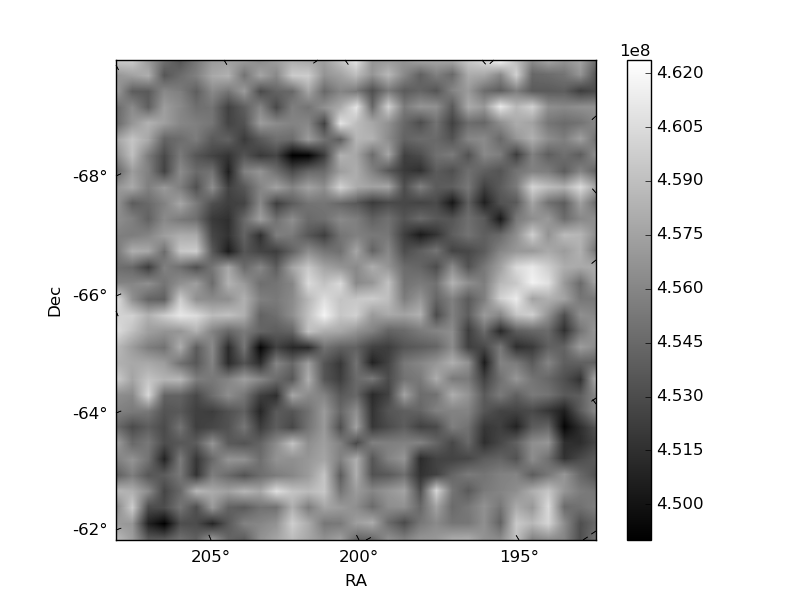
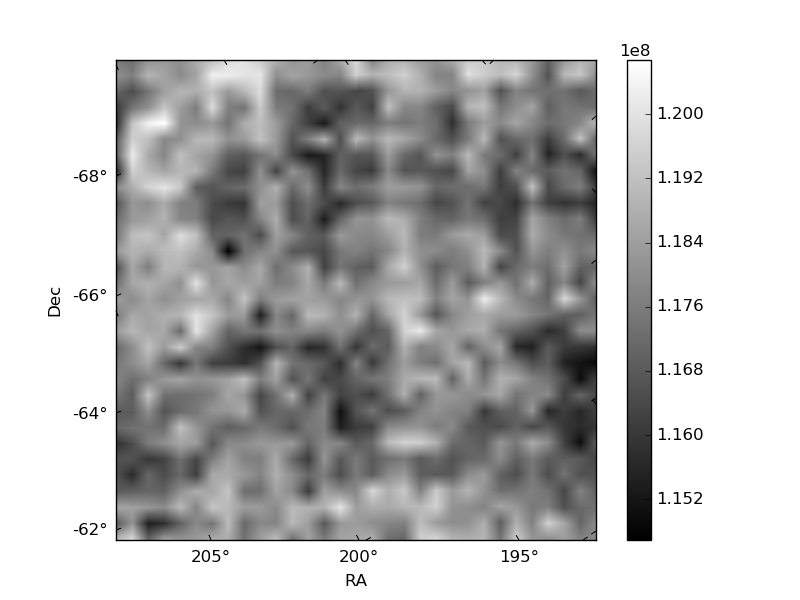
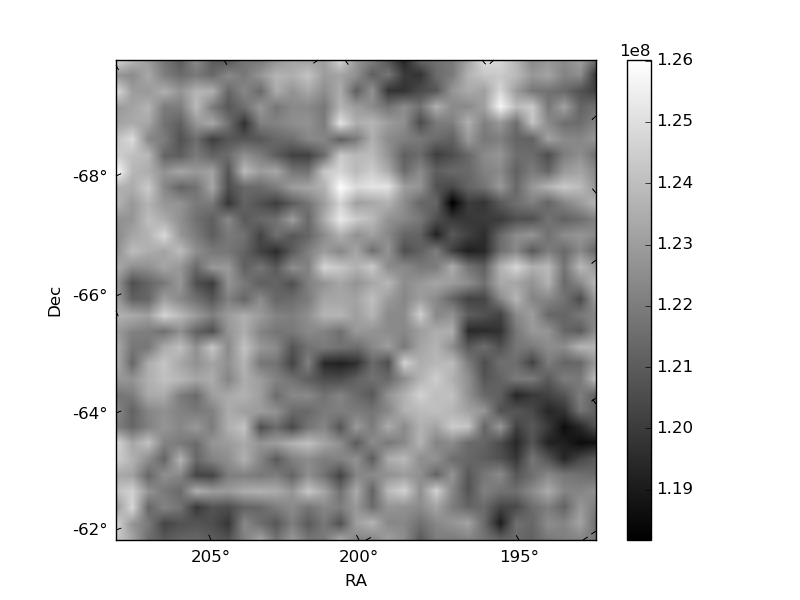
Histogram calculated using DETX and DETY for each event in the final _common_clean file
| Quadrant A | 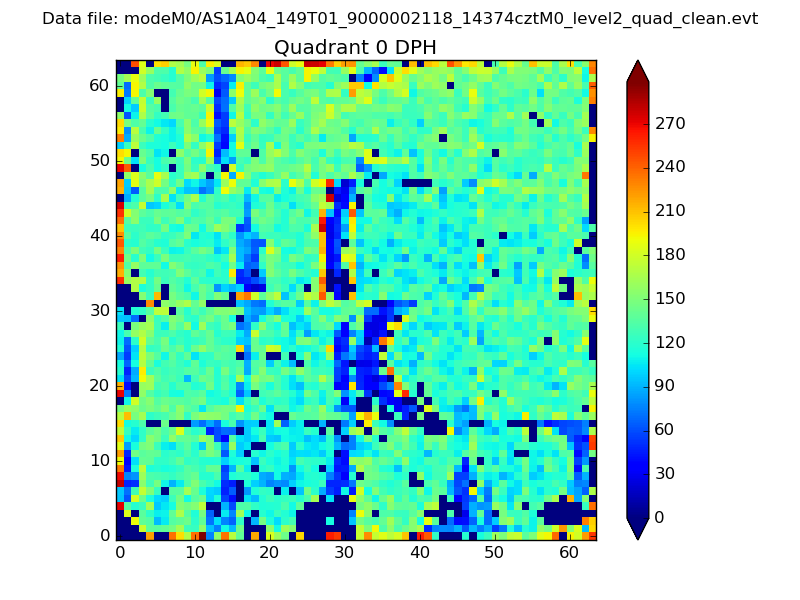 |
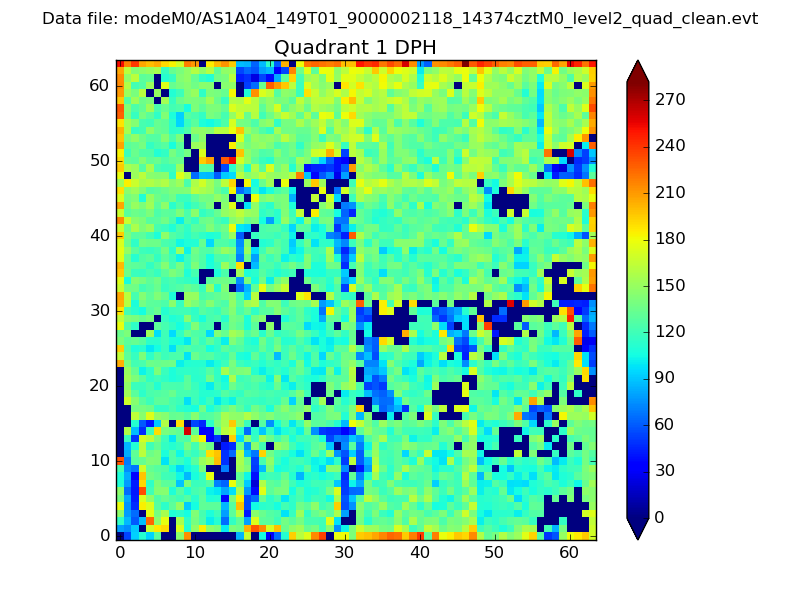 |
Quadrant B |
|---|---|---|---|
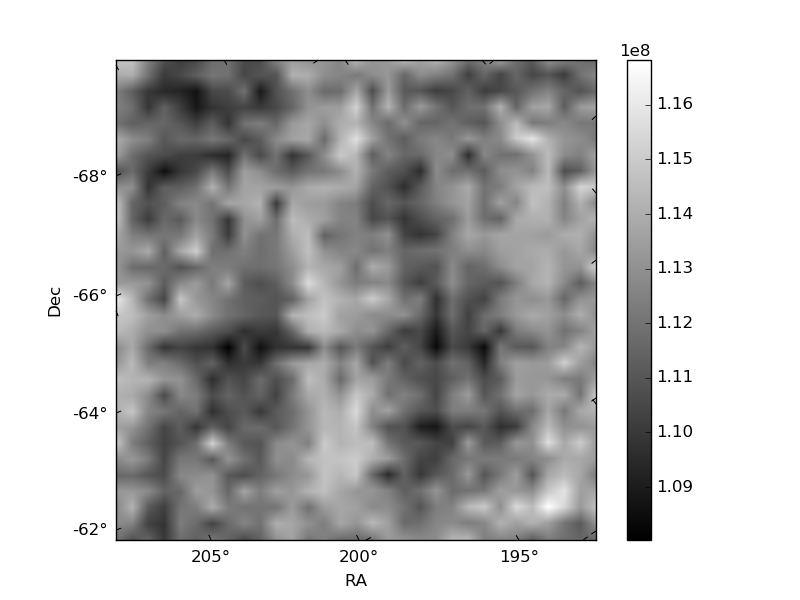
| Quadrant D |  |
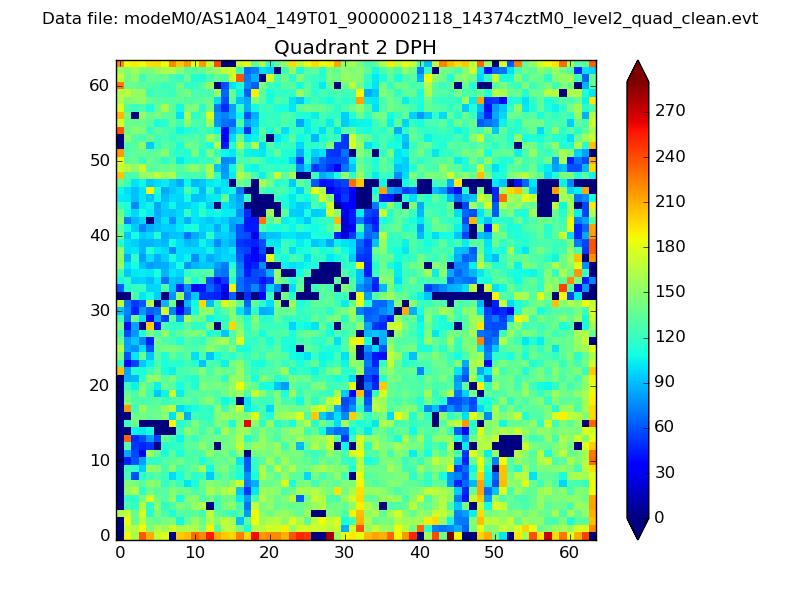 |
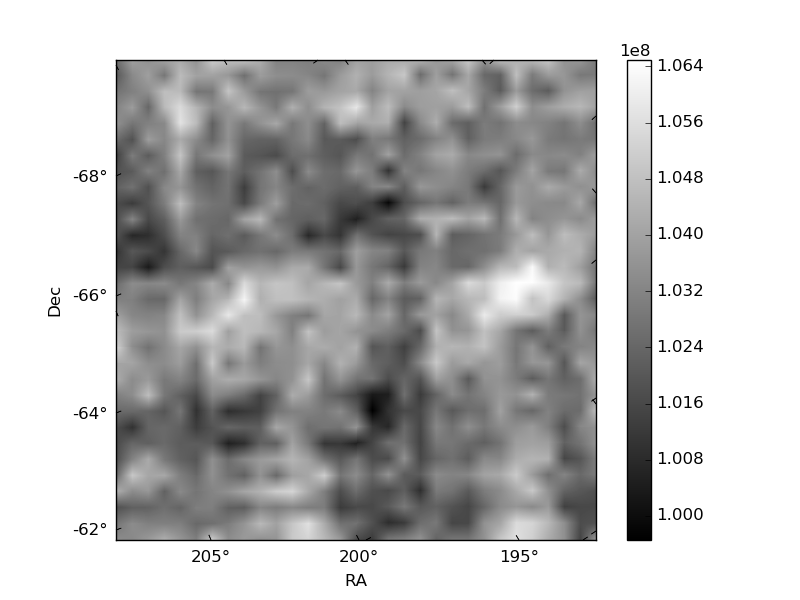
Quadrant C |
| Plot type | Count rate plots | Images |
|---|---|---|
| Comparison with Poisson distribution Blue bars denote a histogram of data divided into 1 sec bins. Red curve is a Poisson curve with rate = median count rate of data. |
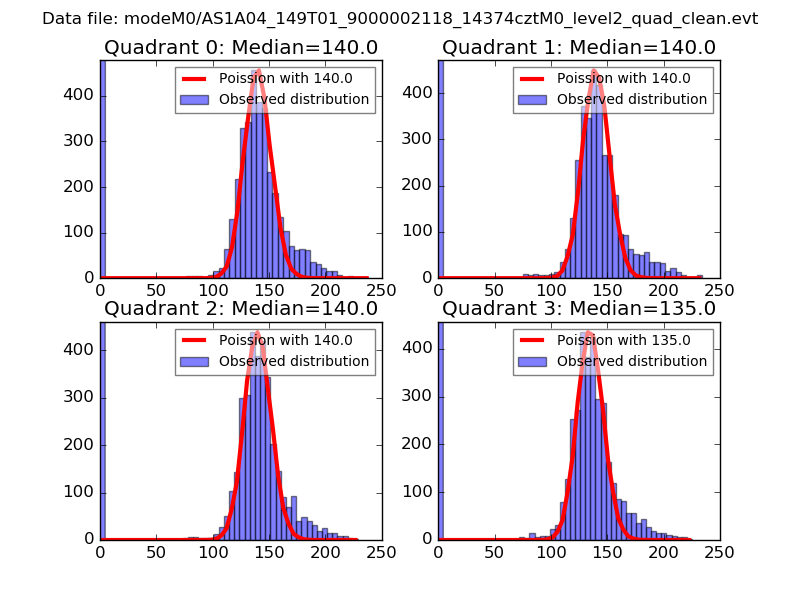 |
 |
| Quadrant-wise count rates Data is divided into 100 sec bins |
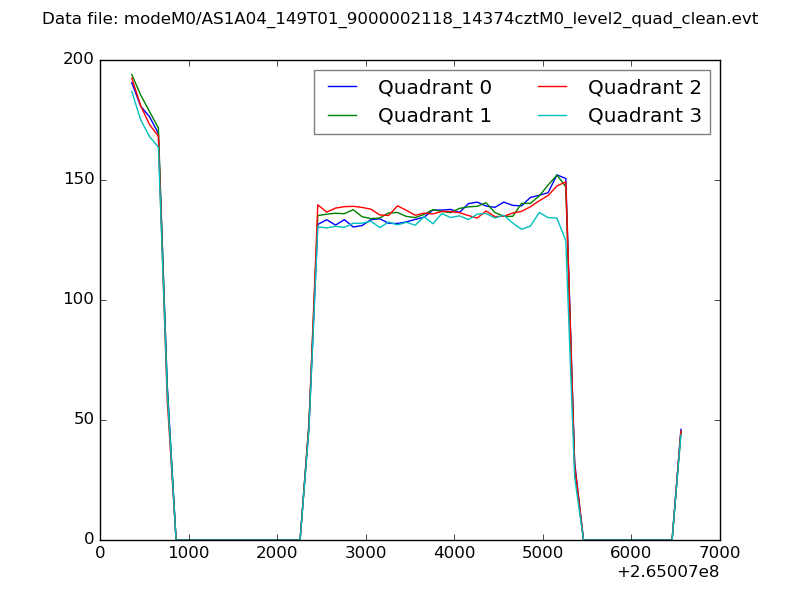 |
|
| Module-wise count rates for Quadrant A Data is divided into 100 sec bins |
 |
 |
| Module-wise count rates for Quadrant B Data is divided into 100 sec bins |
 |
 |
| Module-wise count rates for Quadrant C Data is divided into 100 sec bins |
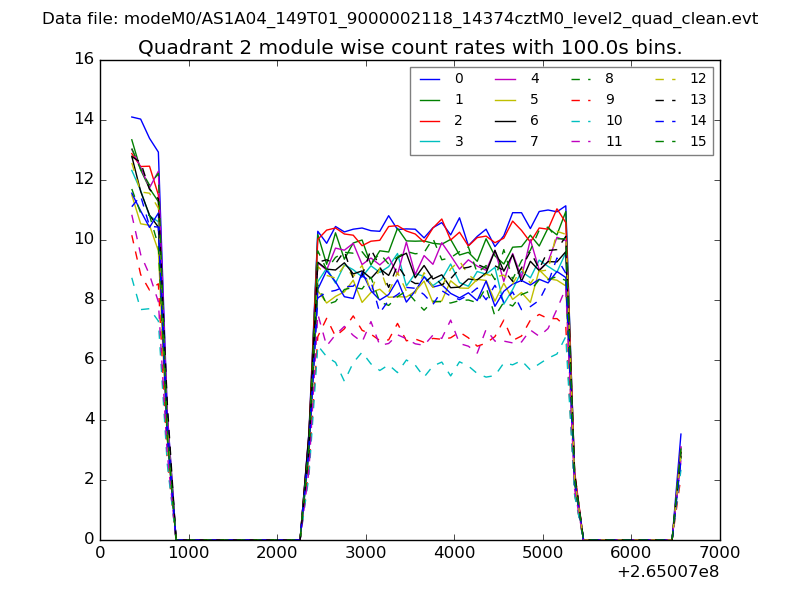 |
 |
| Module-wise count rates for Quadrant D Data is divided into 100 sec bins |
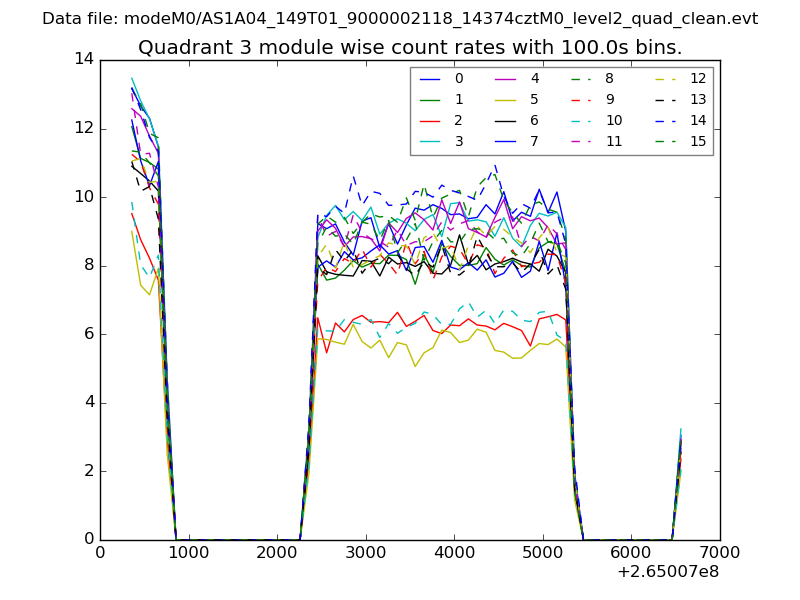 |
 |
| Parameter | Plot |
|---|---|
| CZT HV Monitor | 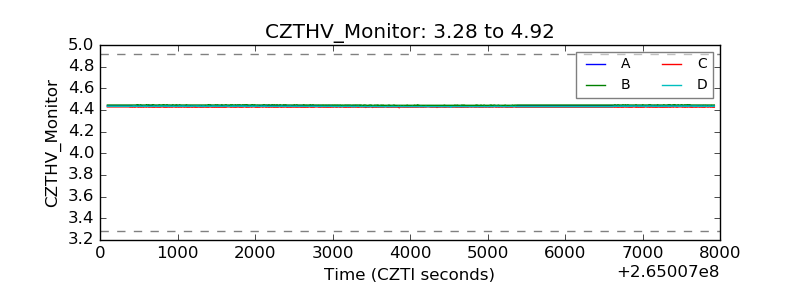 |
| D_VDD | 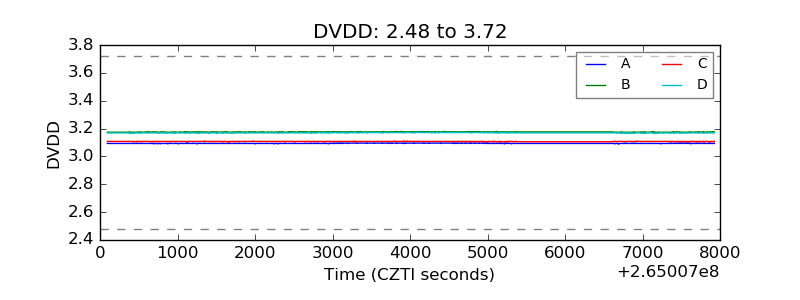 |
| Temperature 1 | 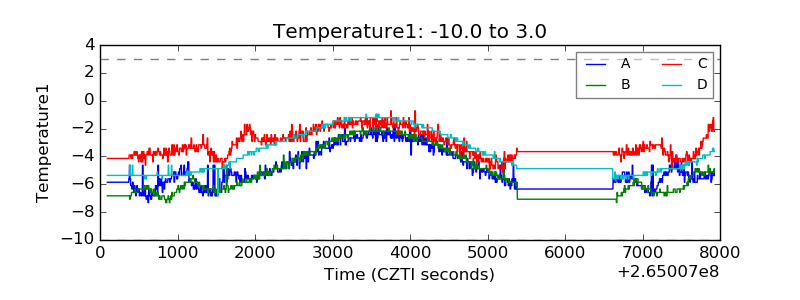 |
| Veto HV Monitor | 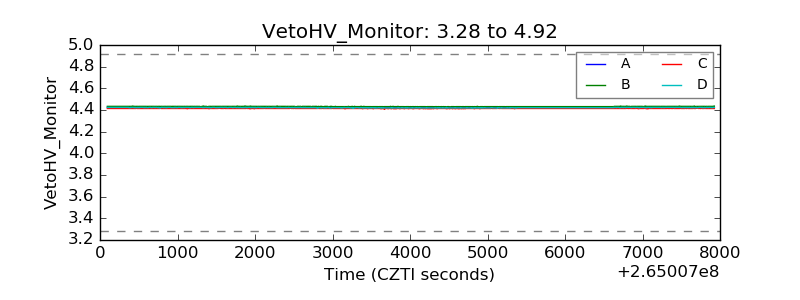 |
| Veto LLD |  |
| Alpha Counter | 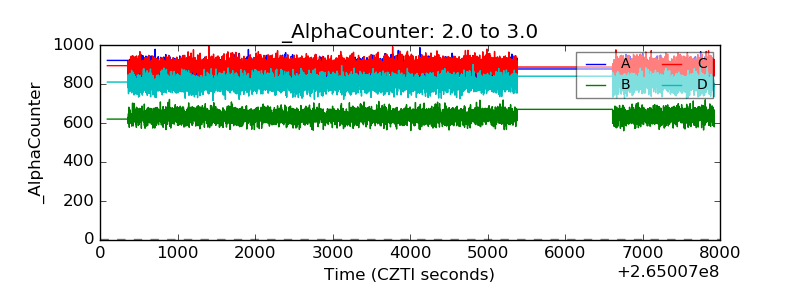 |
| _CPM_Rate | 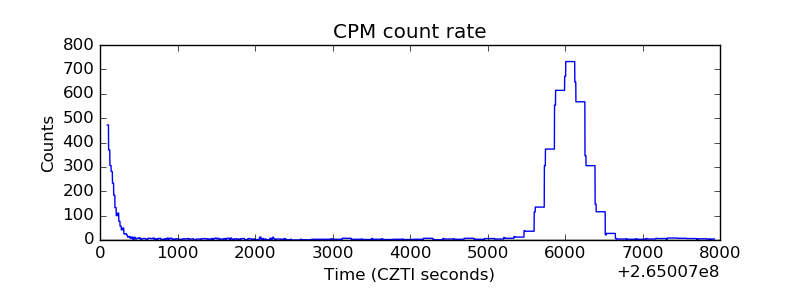 |
| CZT Counter | 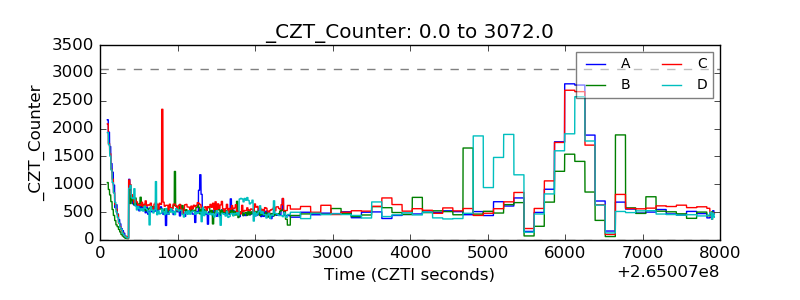 |
| +2.5 Volts monitor |  |
| +5 Volts monitor |  |
| _ROLL_ROT |  |
| _Roll_DEC | 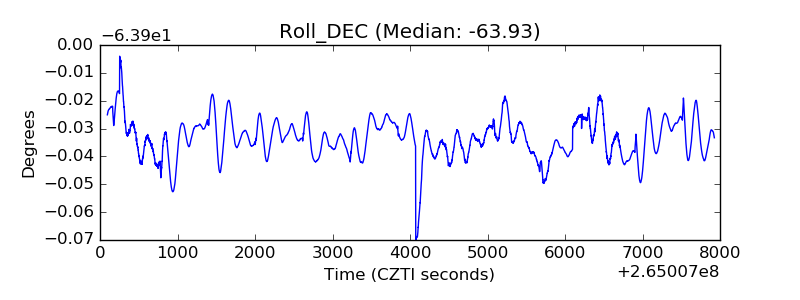 |
| _Roll_RA | 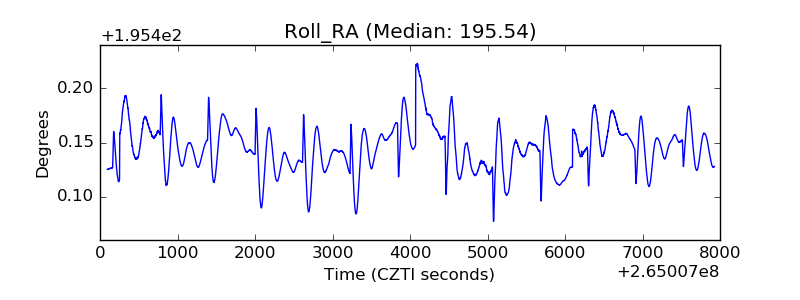 |
| Veto Counter |  |