| Param | Original file | Final file |
|---|---|---|
| Filename | modeM0/AS1A04_149T01_9000002118_14375cztM0_level2.evt | modeM0/AS1A04_149T01_9000002118_14375cztM0_level2_quad_clean.evt |
| Size (bytes) | 536,996,160 | 92,252,160 |
| Size | 512.1 MB | 88.0 MB |
| Events in quadrant A | 3,569,283 | 579,545 |
| Events in quadrant B | 3,845,762 | 581,390 |
| Events in quadrant C | 4,034,475 | 576,747 |
| Events in quadrant D | 4,323,046 | 552,760 |
| Mode SS | |||
|---|---|---|---|
| Quadrant | BADHDUFLAG | Total packets | Discarded packets |
| A | 0 | 148 | 0 |
| B | 0 | 148 | 0 |
| C | 0 | 148 | 0 |
| D | 0 | 148 | 0 |
| Mode M0 | |||
|---|---|---|---|
| Quadrant | BADHDUFLAG | Total packets | Discarded packets |
| A | 0 | 15208 | 3 |
| B | 0 | 15895 | 2 |
| C | 0 | 16038 | 2 |
| D | 0 | 17735 | 2 |
| Mode M9 | |||
|---|---|---|---|
| Quadrant | BADHDUFLAG | Total packets | Discarded packets |
| A | 0 | 22 | 0 |
| B | 0 | 22 | 0 |
| C | 0 | 22 | 0 |
| D | 0 | 22 | 0 |
| Quadrant | Total seconds | Saturated seconds | Saturation percentage |
|---|---|---|---|
| A | 7224 | 167 | 2.311739% |
| B | 7224 | 237 | 3.280731% |
| C | 7224 | 174 | 2.408638% |
| D | 7224 | 401 | 5.550941% |
Noise dominated data is calculated using 1-second bins in cleaned event files. If a bin has >2000 counts, and if more than 50% of those come from <1% of pixels, then it is considered to be noise-dominated and hence unusable.
| Quadrant | # 1 sec bins | Bins with >0 counts | Bins with >2000 counts | High rate bins dominated by noise | Noise dominated (total time) | Noise dominated (detector-on time) | Marked lightcurve |
|---|---|---|---|---|---|---|---|
| A | 9401 | 7225 | 2 | 2 | 0.02% | 0.03% | 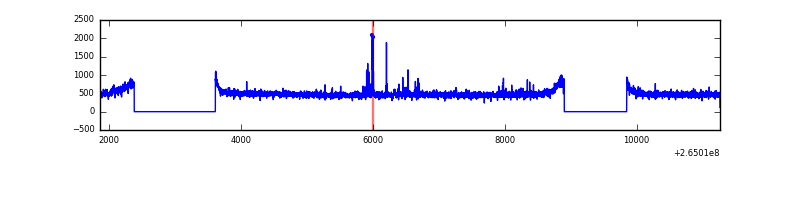 |
| B | 9401 | 7225 | 16 | 16 | 0.17% | 0.22% | 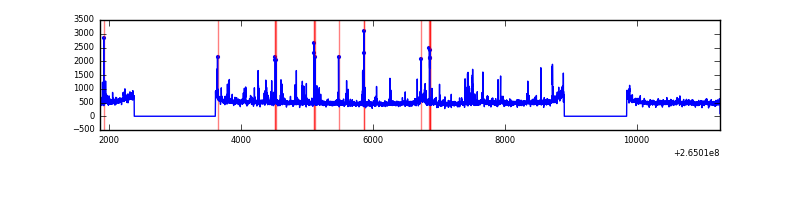 |
| C | 9401 | 7225 | 0 | 0 | 0.00% | 0.00% | 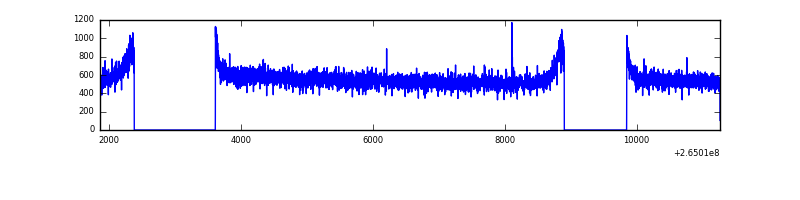 |
| D | 9401 | 7225 | 167 | 167 | 1.78% | 2.31% | 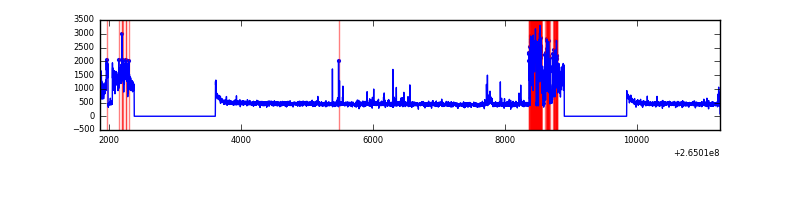 |
Top three noisy pixels from each quadrant. If the there are fewer than three noisy pixels in the level2.evt file, extra rows are filled as -1
| Pixel properties | Quadrant properties | ||||||
|---|---|---|---|---|---|---|---|
| Quadrant | DetID | PixID | Counts | Sigma | Mean | Median | Sigma |
| A | 12 | 189 | 92377 | 505.02 | 900 | 881 | 181.2 |
| A | 8 | 15 | 12594 | 64.65 | 900 | 881 | 181.2 |
| A | 0 | 226 | 7865 | 38.55 | 900 | 881 | 181.2 |
| B | 0 | 229 | 149320 | 865.59 | 898 | 874 | 171.5 |
| B | 0 | 182 | 77899 | 449.13 | 898 | 874 | 171.5 |
| B | 0 | 189 | 25338 | 142.65 | 898 | 874 | 171.5 |
| C | 3 | 233 | 601310 | 3009.98 | 879 | 883 | 199.5 |
| C | 13 | 61 | 6309 | 27.2 | 879 | 883 | 199.5 |
| C | 14 | 234 | 4360 | 17.43 | 879 | 883 | 199.5 |
| D | 12 | 110 | 901392 | 4414.89 | 866 | 844 | 204.0 |
| D | 10 | 199 | 42384 | 203.65 | 866 | 844 | 204.0 |
| D | 2 | 120 | 41840 | 200.98 | 866 | 844 | 204.0 |
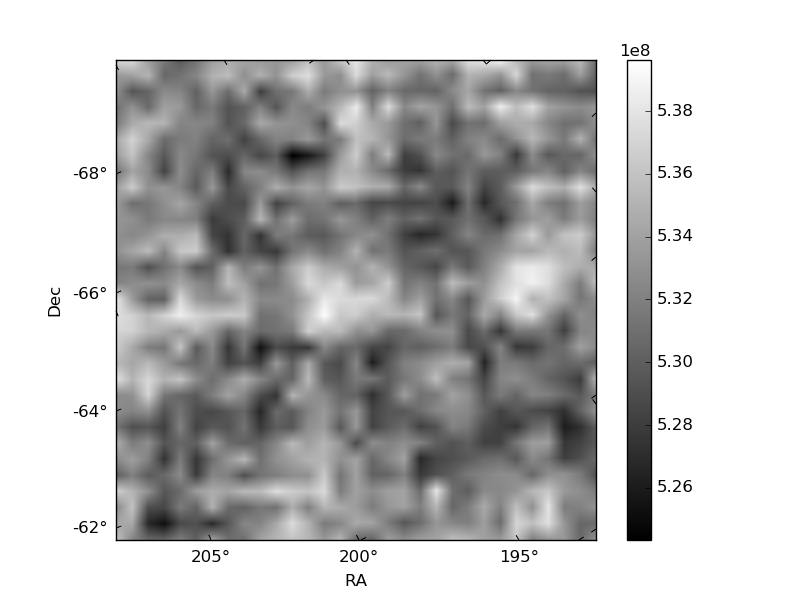
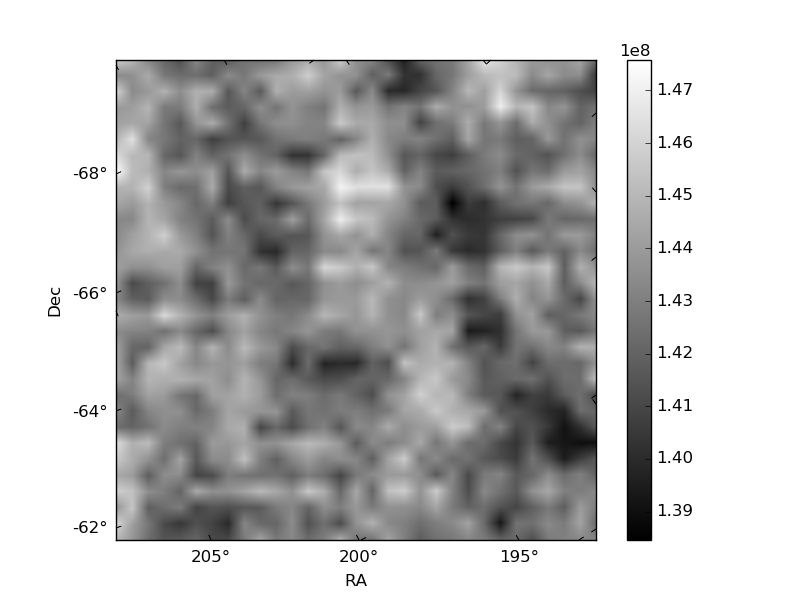
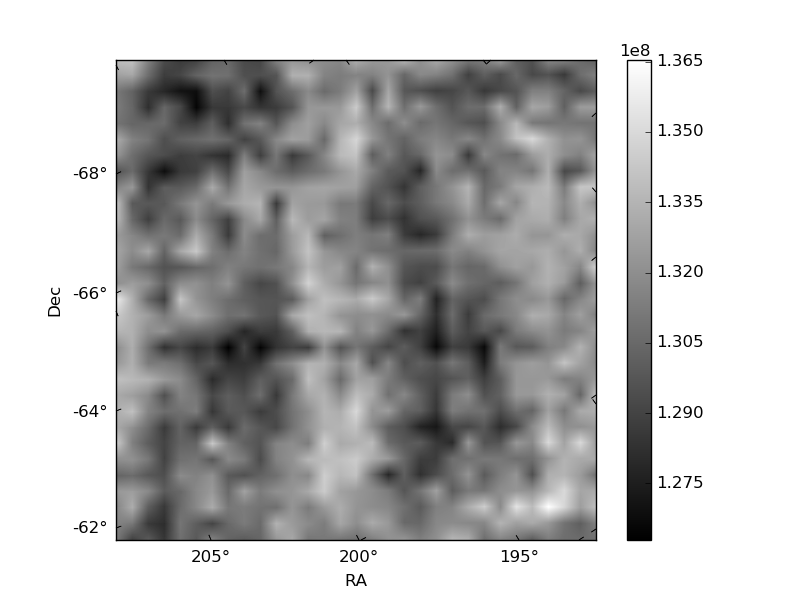
Histogram calculated using DETX and DETY for each event in the final _common_clean file
| Quadrant A | 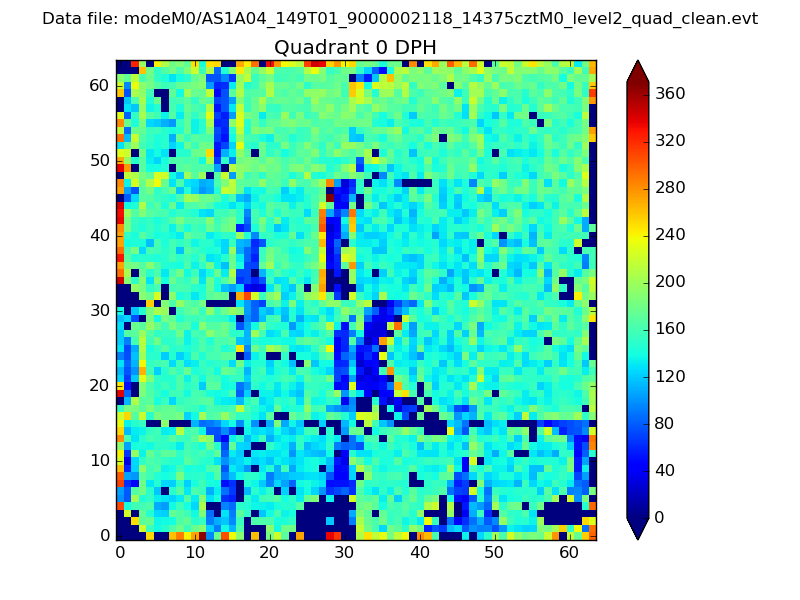 |
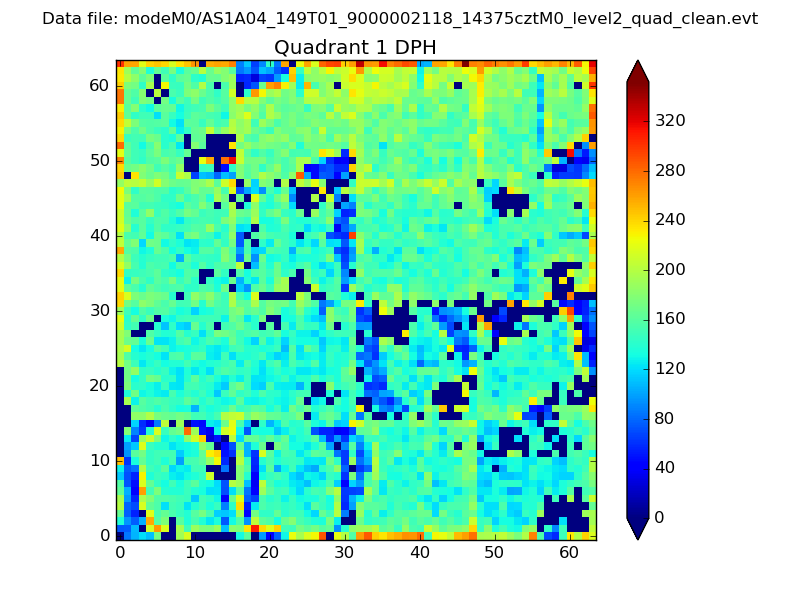 |
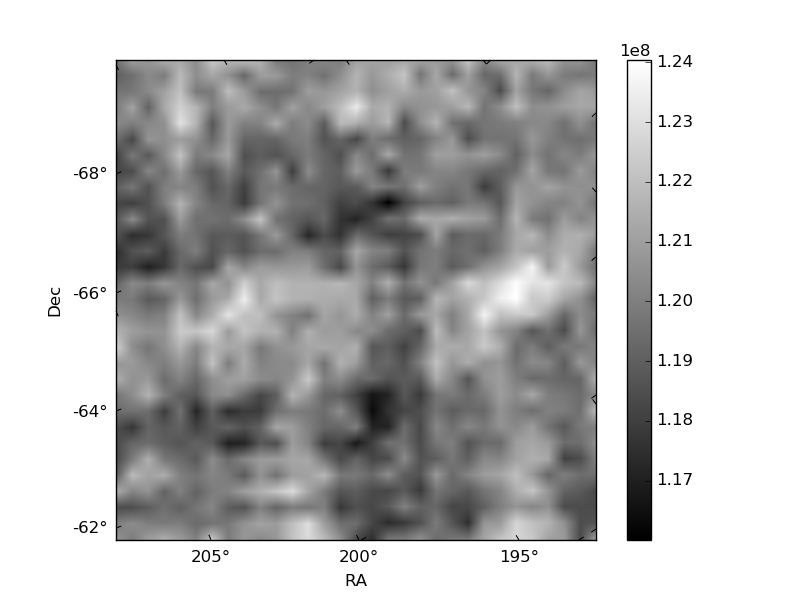
Quadrant B |
|---|---|---|---|
| Quadrant D | 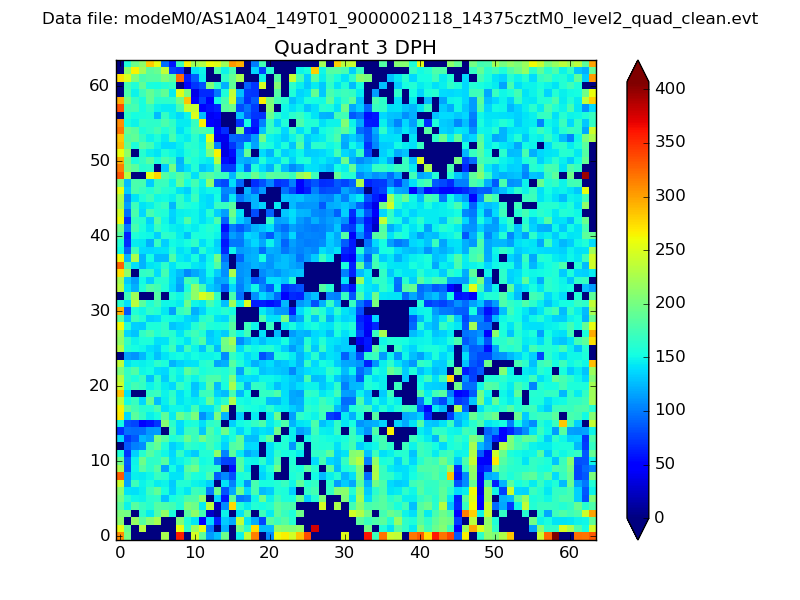 |
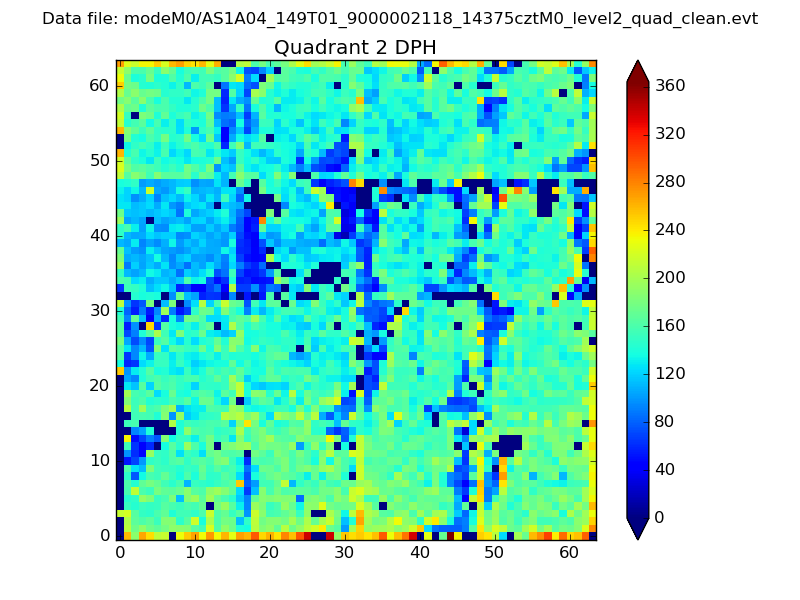 |
Quadrant C |
| Plot type | Count rate plots | Images |
|---|---|---|
| Comparison with Poisson distribution Blue bars denote a histogram of data divided into 1 sec bins. Red curve is a Poisson curve with rate = median count rate of data. |
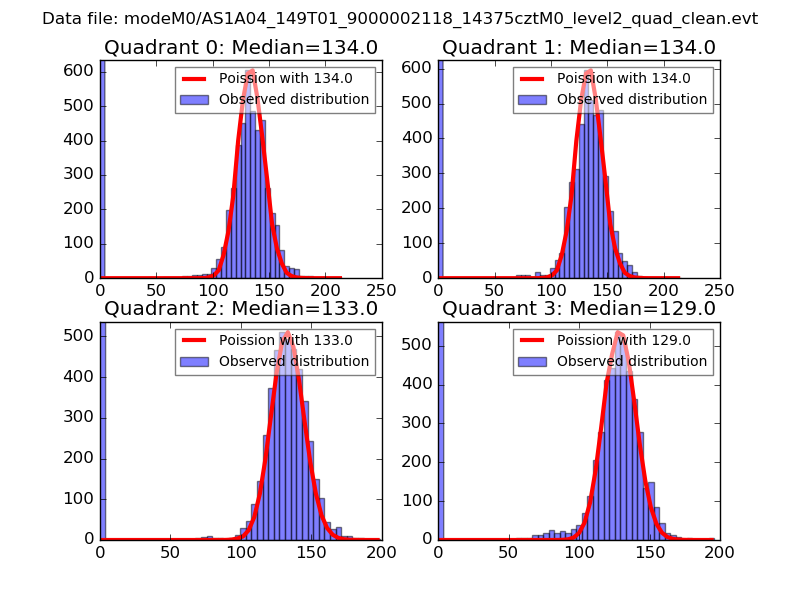 |
 |
| Quadrant-wise count rates Data is divided into 100 sec bins |
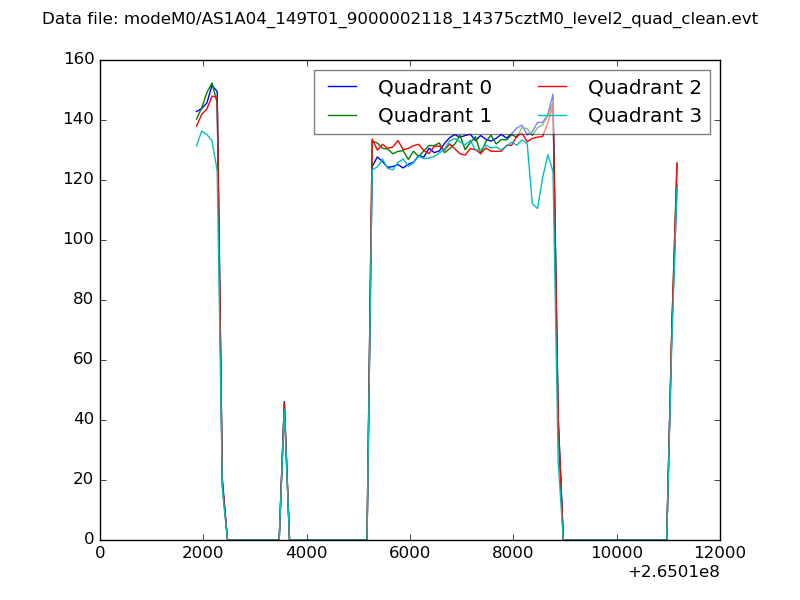 |
|
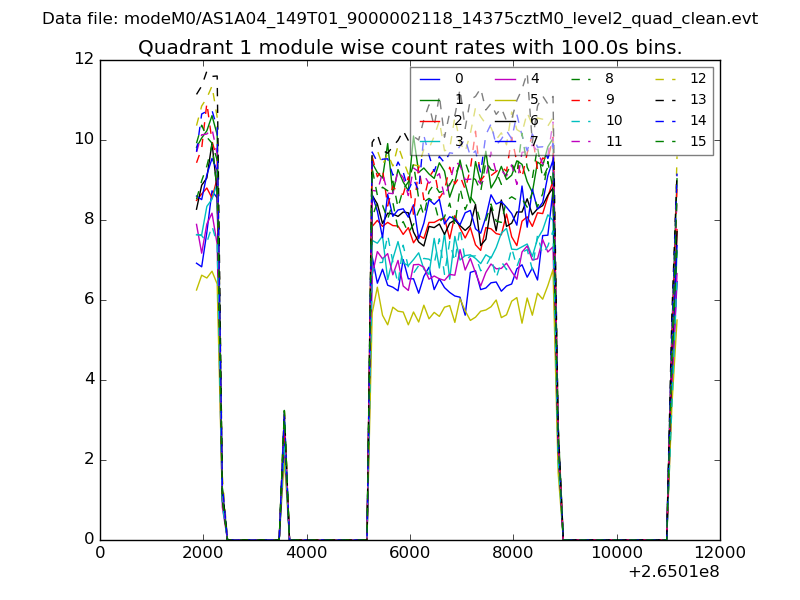
| Module-wise count rates for Quadrant A Data is divided into 100 sec bins |
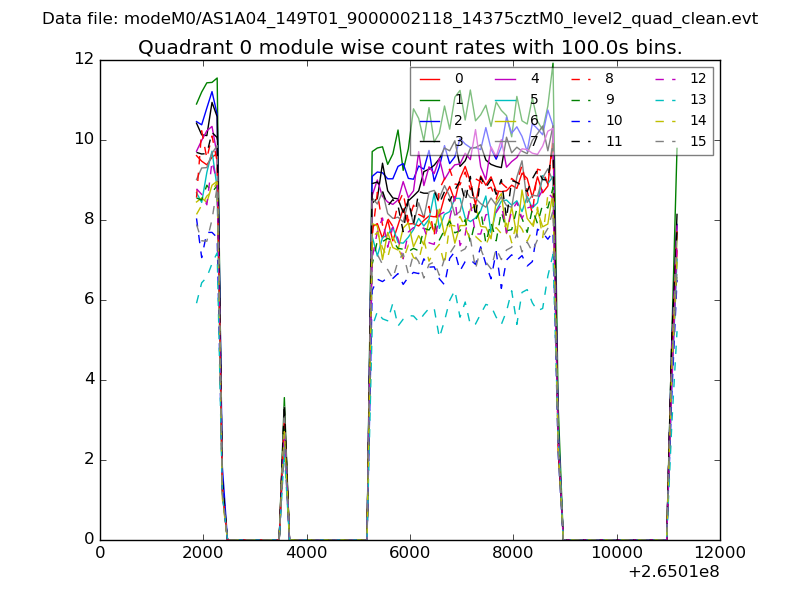 |
 |
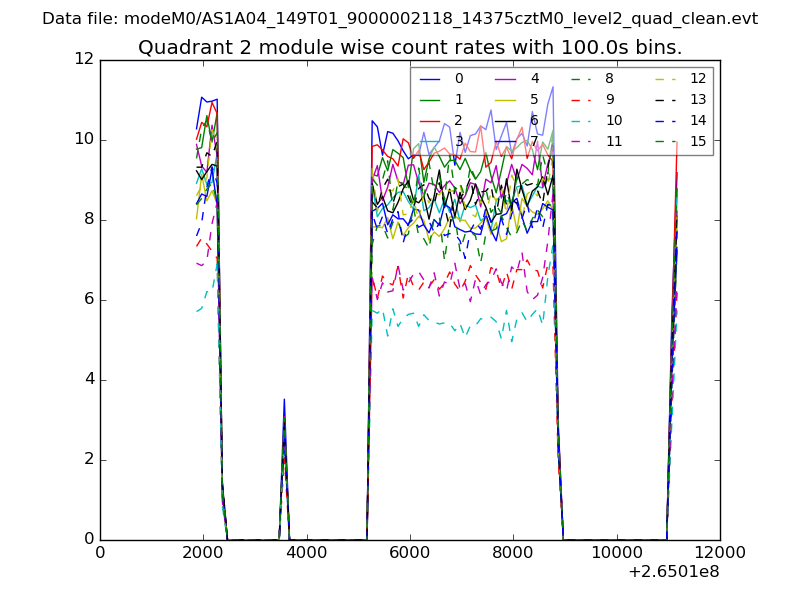
| Module-wise count rates for Quadrant B Data is divided into 100 sec bins |
 |
 |
| Module-wise count rates for Quadrant C Data is divided into 100 sec bins |
 |
 |
| Module-wise count rates for Quadrant D Data is divided into 100 sec bins |
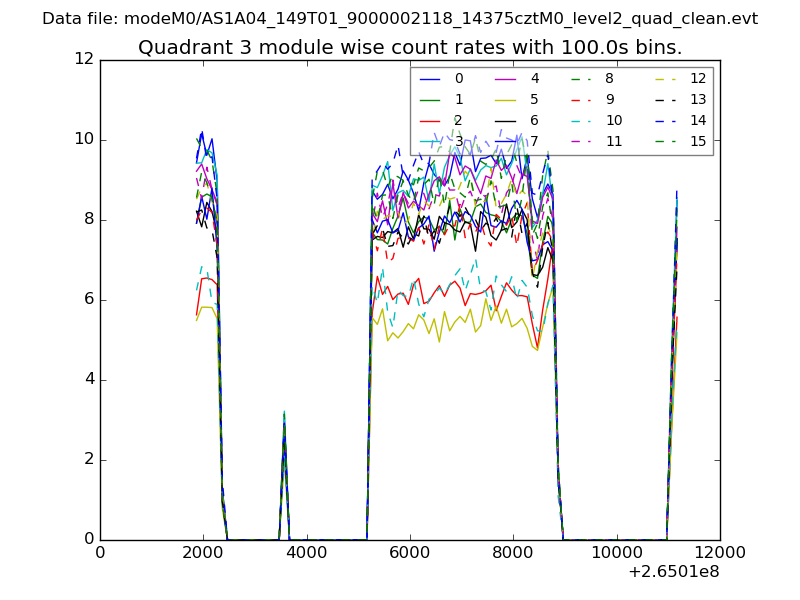 |
 |
| Parameter | Plot |
|---|---|
| CZT HV Monitor | 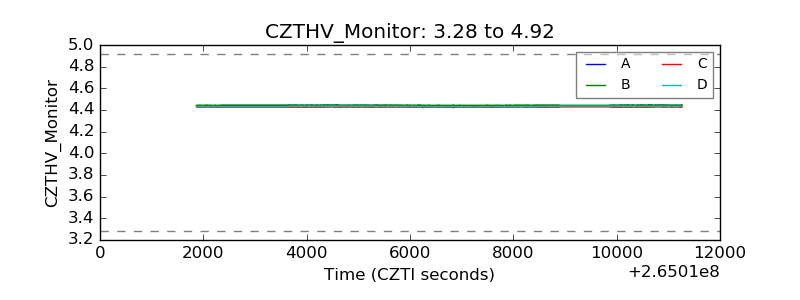 |
| D_VDD | 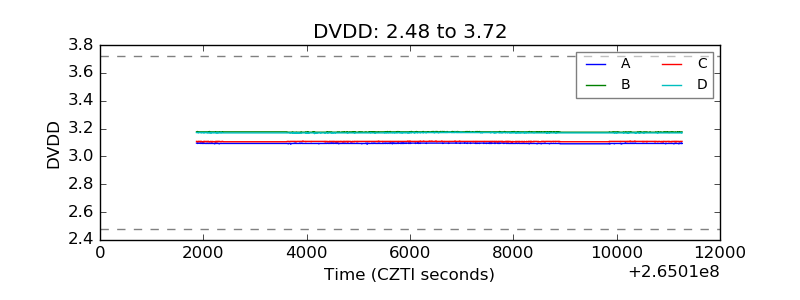 |
| Temperature 1 |  |
| Veto HV Monitor | 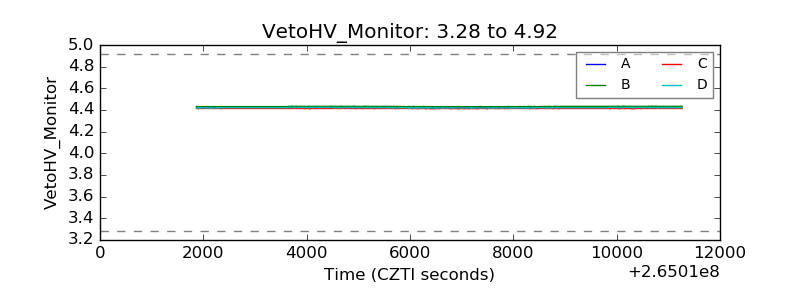 |
| Veto LLD | 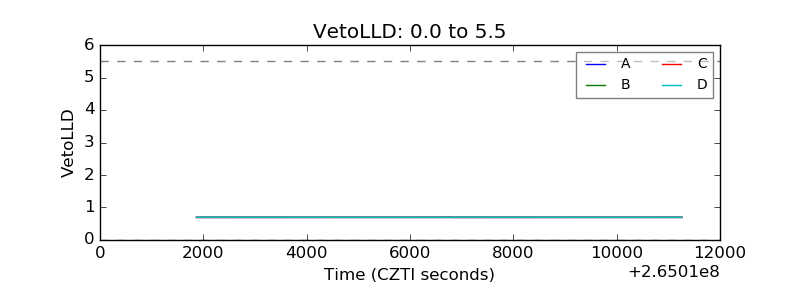 |
| Alpha Counter | 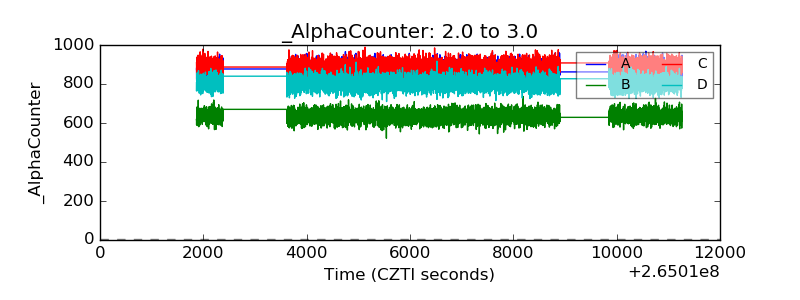 |
| _CPM_Rate | 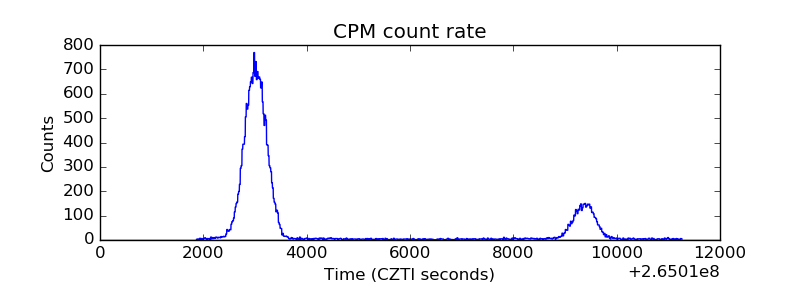 |
| CZT Counter | 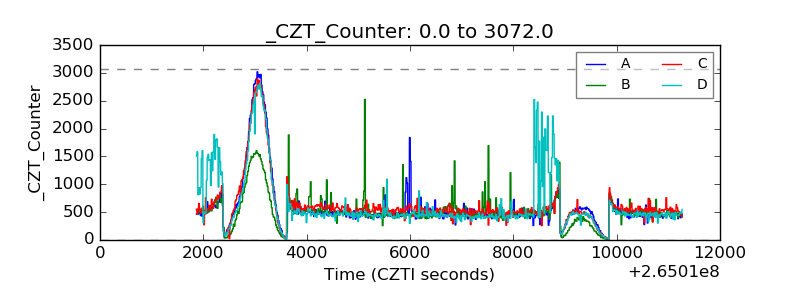 |
| +2.5 Volts monitor |  |
| +5 Volts monitor | 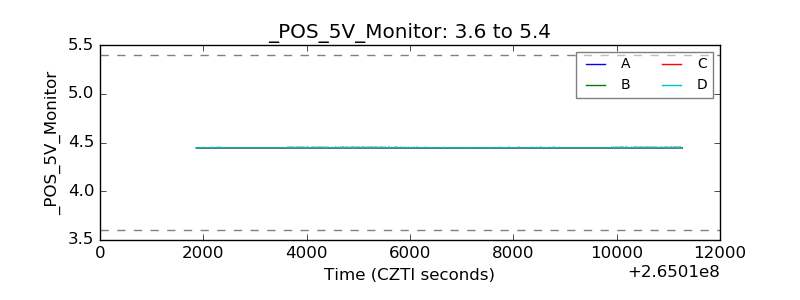 |
| _ROLL_ROT |  |
| _Roll_DEC | 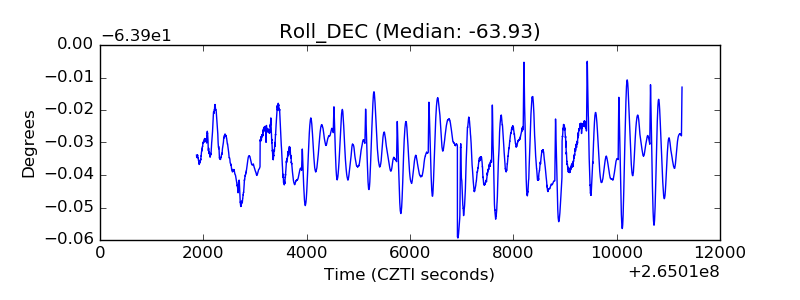 |
| _Roll_RA | 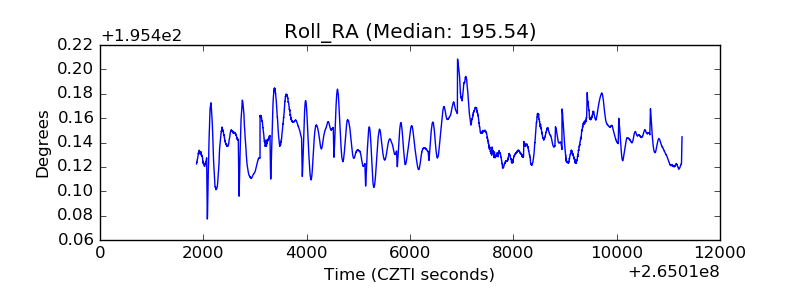 |
| Veto Counter | 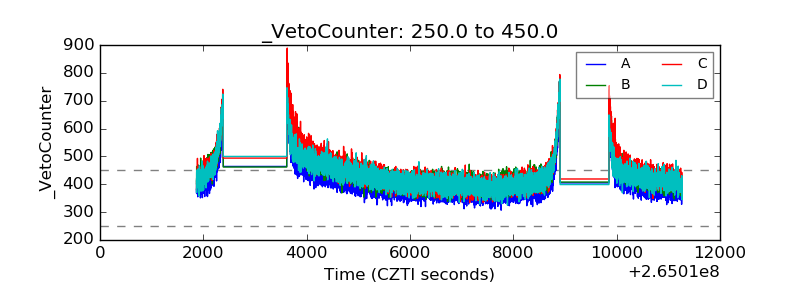 |