| Param | Original file | Final file |
|---|---|---|
| Filename | modeM0/AS1A04_149T01_9000002118_14376cztM0_level2.evt | modeM0/AS1A04_149T01_9000002118_14376cztM0_level2_quad_clean.evt |
| Size (bytes) | 553,409,280 | 103,852,800 |
| Size | 527.8 MB | 99.0 MB |
| Events in quadrant A | 3,628,463 | 663,177 |
| Events in quadrant B | 3,987,064 | 664,666 |
| Events in quadrant C | 4,067,860 | 657,555 |
| Events in quadrant D | 4,559,320 | 629,718 |
| Mode SS | |||
|---|---|---|---|
| Quadrant | BADHDUFLAG | Total packets | Discarded packets |
| A | 0 | 158 | 0 |
| B | 0 | 158 | 0 |
| C | 0 | 158 | 0 |
| D | 0 | 158 | 0 |
| Mode M0 | |||
|---|---|---|---|
| Quadrant | BADHDUFLAG | Total packets | Discarded packets |
| A | 0 | 15809 | 3 |
| B | 0 | 16667 | 2 |
| C | 0 | 16286 | 2 |
| D | 0 | 18913 | 2 |
| Mode M9 | |||
|---|---|---|---|
| Quadrant | BADHDUFLAG | Total packets | Discarded packets |
| A | 0 | 14 | 0 |
| B | 0 | 14 | 0 |
| C | 0 | 14 | 0 |
| D | 0 | 14 | 0 |
| Quadrant | Total seconds | Saturated seconds | Saturation percentage |
|---|---|---|---|
| A | 7613 | 218 | 2.863523% |
| B | 7613 | 295 | 3.874951% |
| C | 7613 | 200 | 2.627085% |
| D | 7613 | 464 | 6.094838% |
Noise dominated data is calculated using 1-second bins in cleaned event files. If a bin has >2000 counts, and if more than 50% of those come from <1% of pixels, then it is considered to be noise-dominated and hence unusable.
| Quadrant | # 1 sec bins | Bins with >0 counts | Bins with >2000 counts | High rate bins dominated by noise | Noise dominated (total time) | Noise dominated (detector-on time) | Marked lightcurve |
|---|---|---|---|---|---|---|---|
| A | 9035 | 7614 | 2 | 2 | 0.02% | 0.03% | 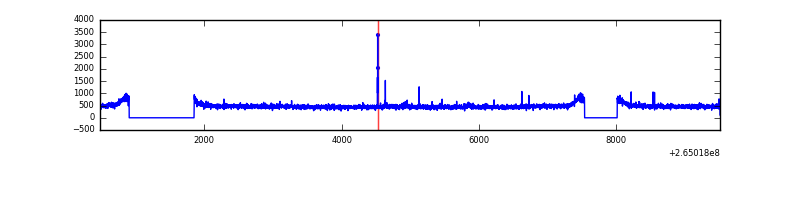 |
| B | 9035 | 7614 | 28 | 28 | 0.31% | 0.37% | 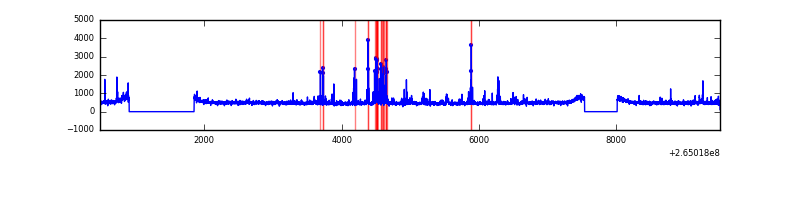 |
| C | 9035 | 7614 | 1 | 1 | 0.01% | 0.01% | 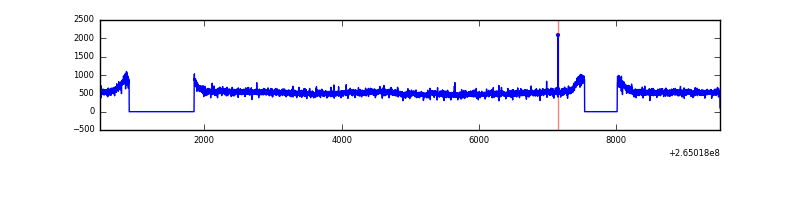 |
| D | 9035 | 7614 | 255 | 255 | 2.82% | 3.35% | 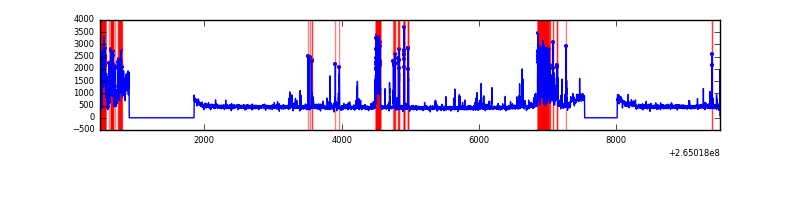 |
Top three noisy pixels from each quadrant. If the there are fewer than three noisy pixels in the level2.evt file, extra rows are filled as -1
| Pixel properties | Quadrant properties | ||||||
|---|---|---|---|---|---|---|---|
| Quadrant | DetID | PixID | Counts | Sigma | Mean | Median | Sigma |
| A | 12 | 189 | 33373 | 172.82 | 928 | 910 | 187.8 |
| A | 8 | 15 | 16028 | 80.48 | 928 | 910 | 187.8 |
| A | 15 | 69 | 12806 | 63.33 | 928 | 910 | 187.8 |
| B | 0 | 229 | 266657 | 1504.71 | 923 | 898 | 176.6 |
| B | 0 | 189 | 41200 | 228.19 | 923 | 898 | 176.6 |
| B | 0 | 219 | 33112 | 182.39 | 923 | 898 | 176.6 |
| C | 3 | 233 | 520500 | 2502.27 | 908 | 912 | 207.6 |
| C | 13 | 61 | 6464 | 26.74 | 908 | 912 | 207.6 |
| C | 14 | 234 | 3997 | 14.86 | 908 | 912 | 207.6 |
| D | 12 | 110 | 624677 | 2956.35 | 893 | 868 | 211.0 |
| D | 10 | 199 | 448636 | 2122.06 | 893 | 868 | 211.0 |
| D | 2 | 120 | 65925 | 308.32 | 893 | 868 | 211.0 |
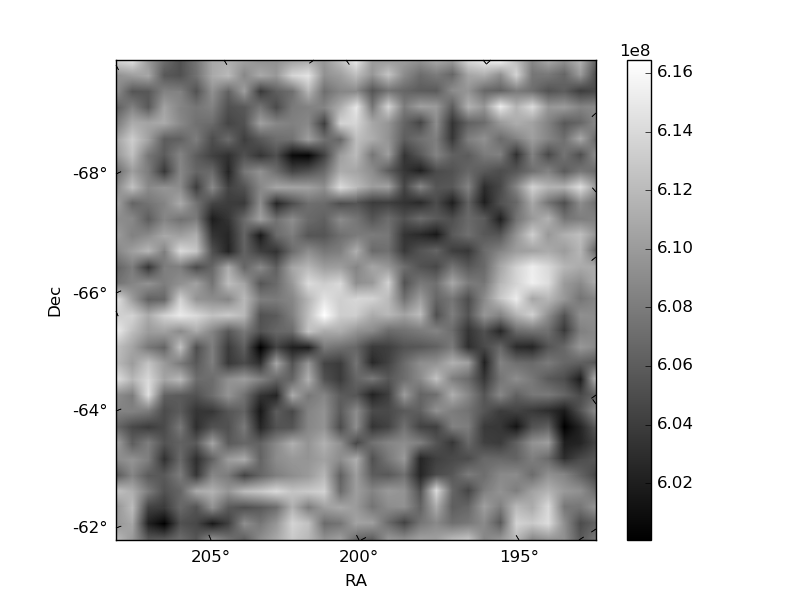
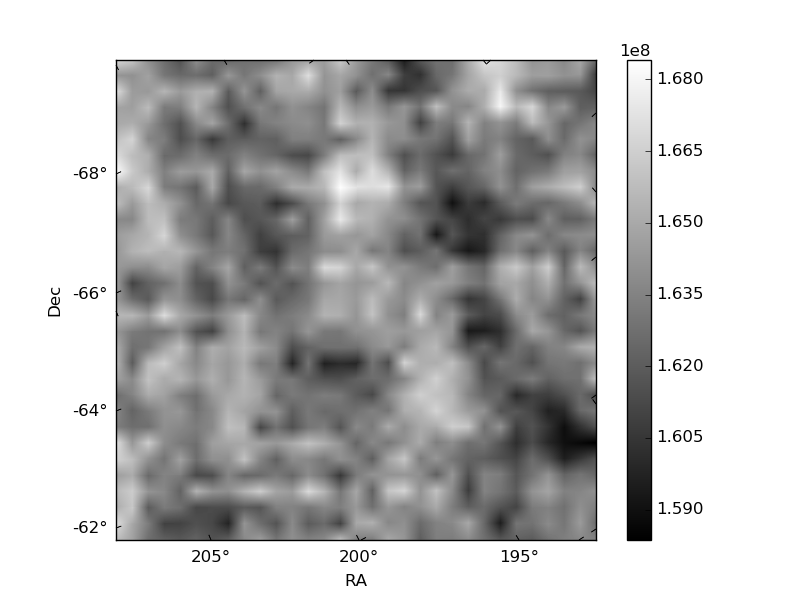
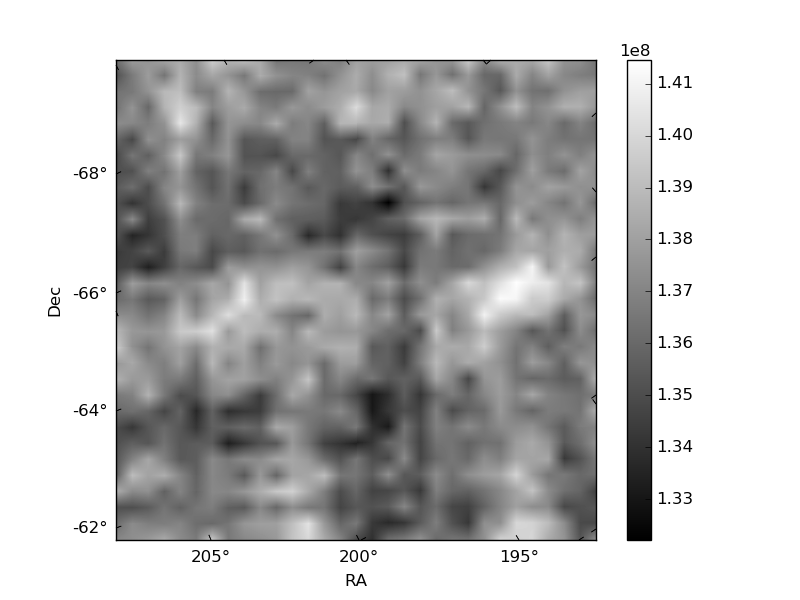
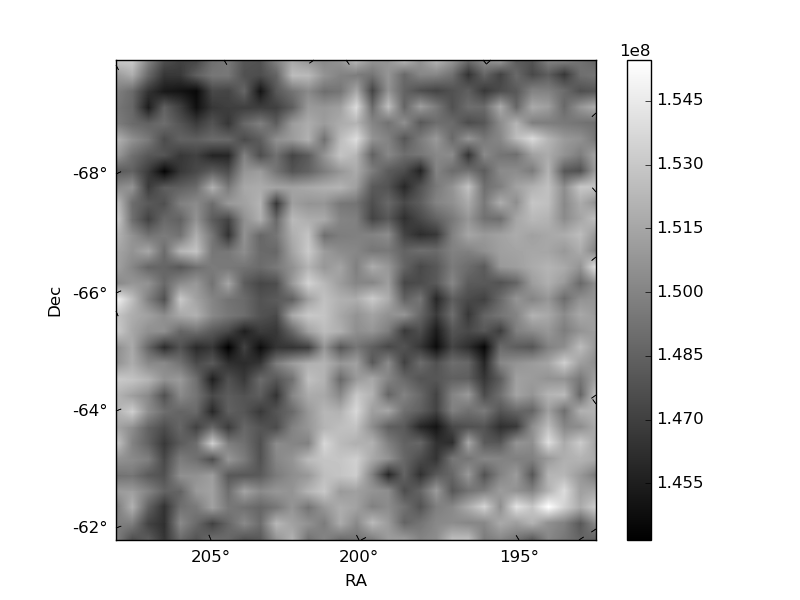
Histogram calculated using DETX and DETY for each event in the final _common_clean file
| Quadrant A | 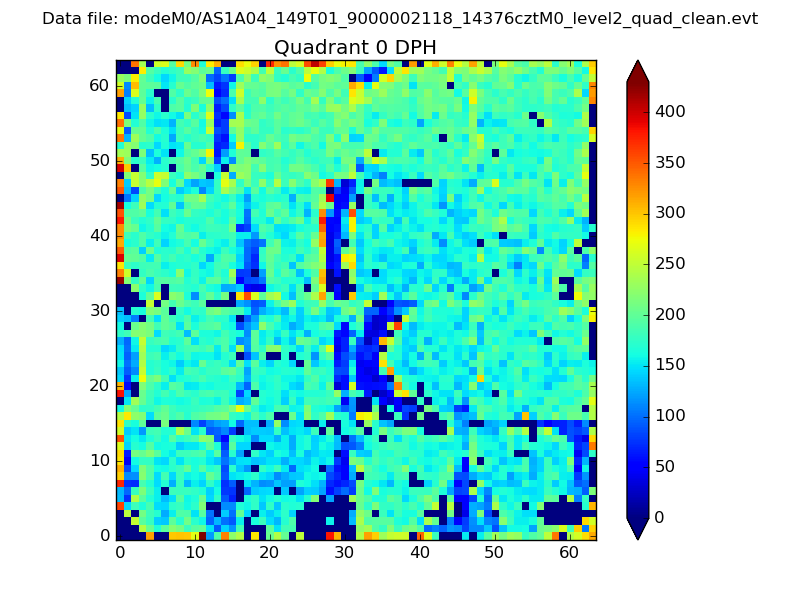 |
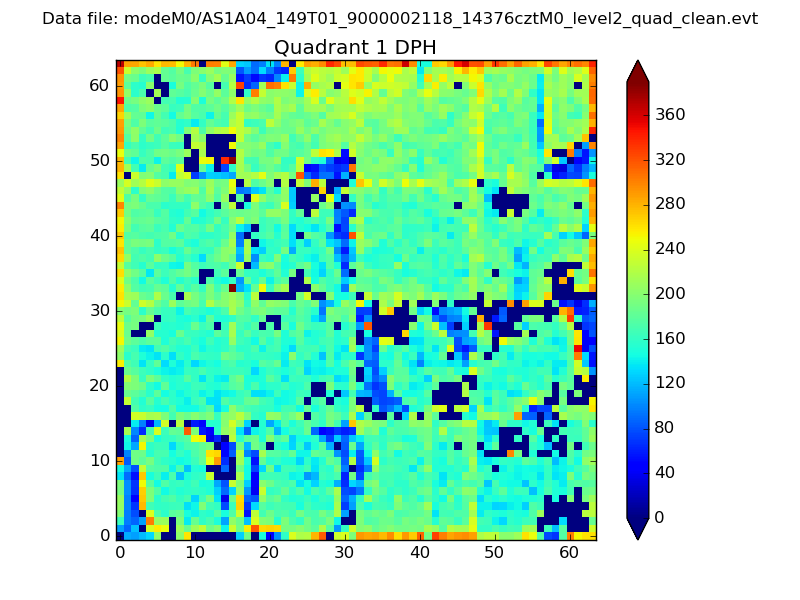 |
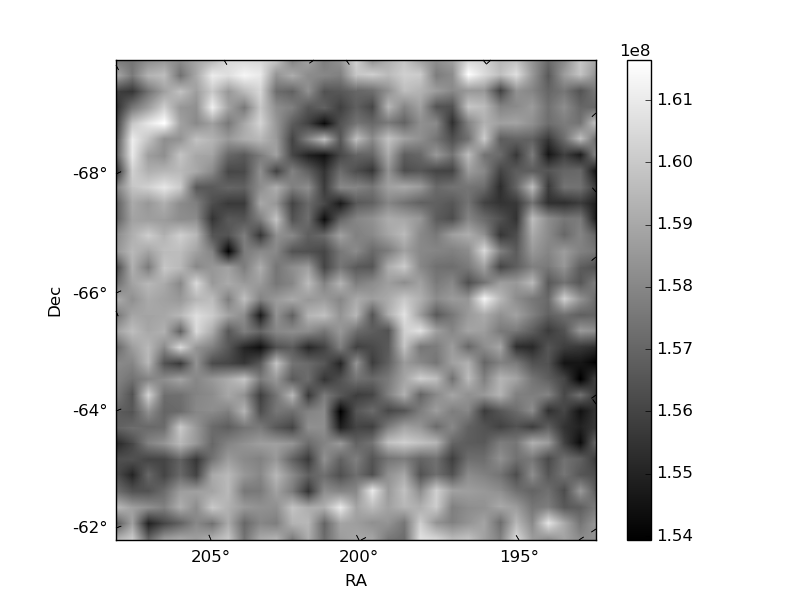
Quadrant B |
|---|---|---|---|
| Quadrant D | 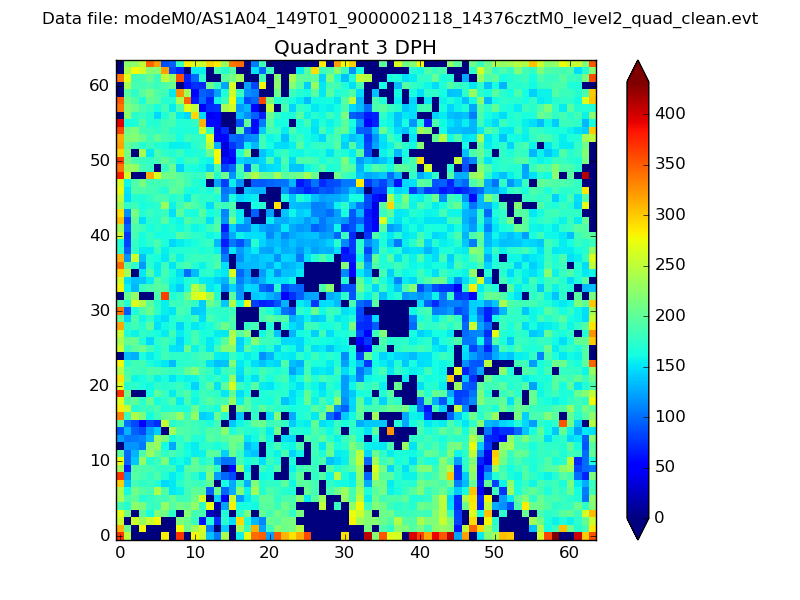 |
 |
Quadrant C |
| Plot type | Count rate plots | Images |
|---|---|---|
| Comparison with Poisson distribution Blue bars denote a histogram of data divided into 1 sec bins. Red curve is a Poisson curve with rate = median count rate of data. |
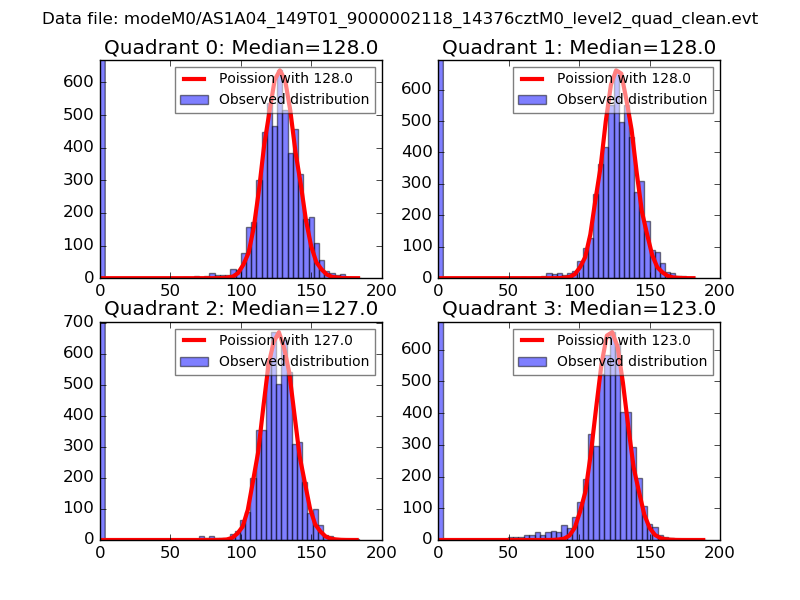 |
 |
| Quadrant-wise count rates Data is divided into 100 sec bins |
 |
|
| Module-wise count rates for Quadrant A Data is divided into 100 sec bins |
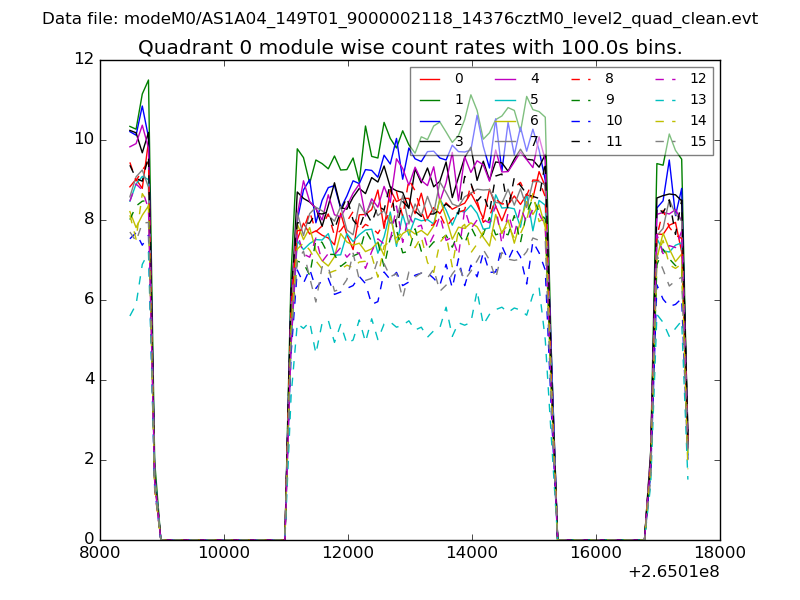 |
 |
| Module-wise count rates for Quadrant B Data is divided into 100 sec bins |
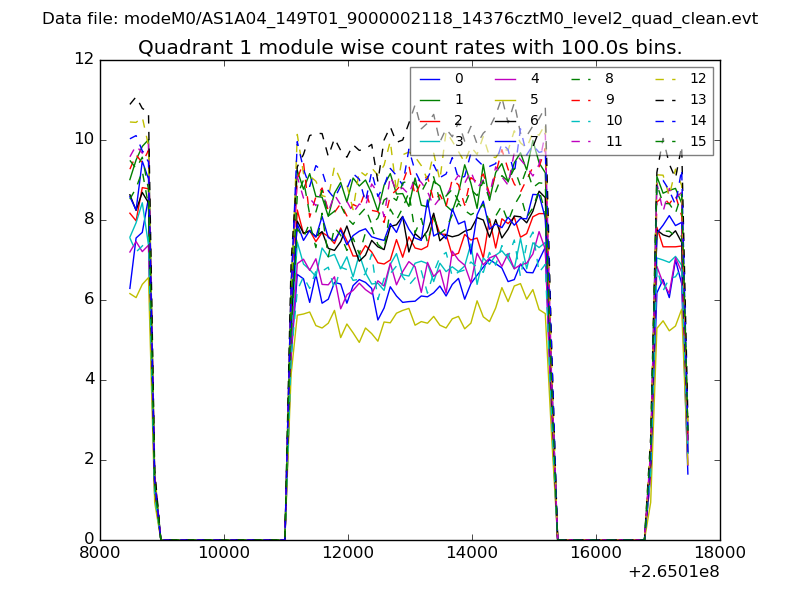 |
 |
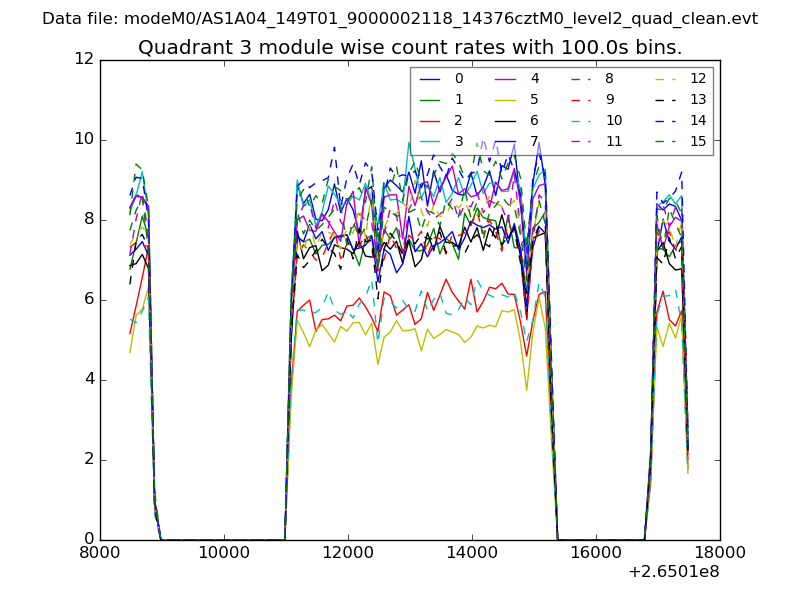
| Module-wise count rates for Quadrant C Data is divided into 100 sec bins |
 |
 |
| Module-wise count rates for Quadrant D Data is divided into 100 sec bins |
 |
 |
| Parameter | Plot |
|---|---|
| CZT HV Monitor |  |
| D_VDD | 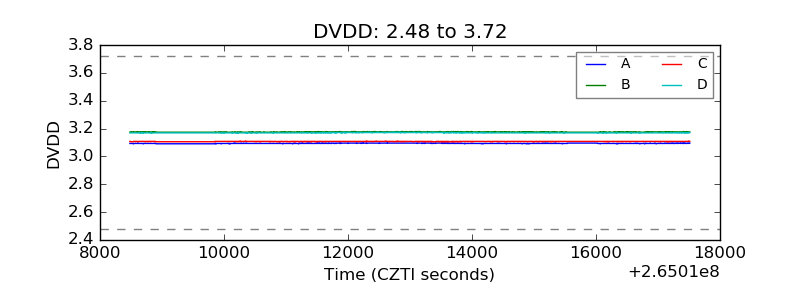 |
| Temperature 1 | 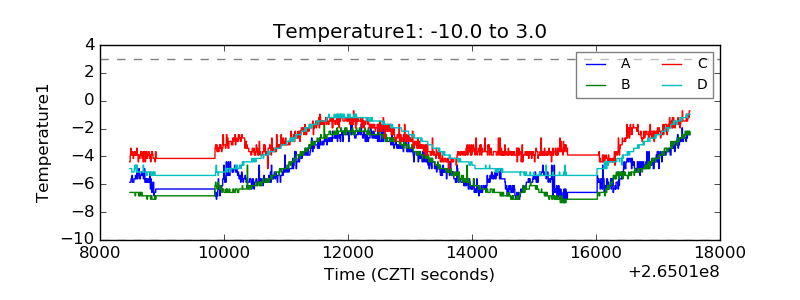 |
| Veto HV Monitor | 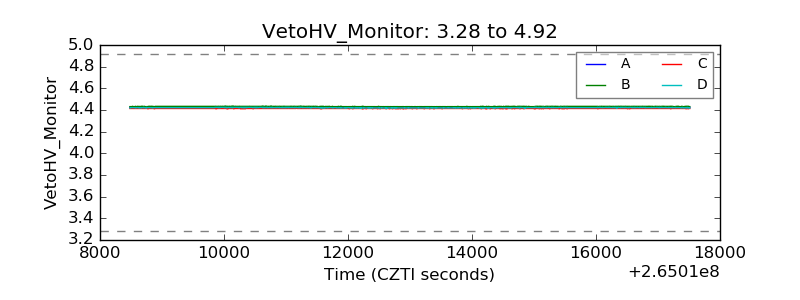 |
| Veto LLD | 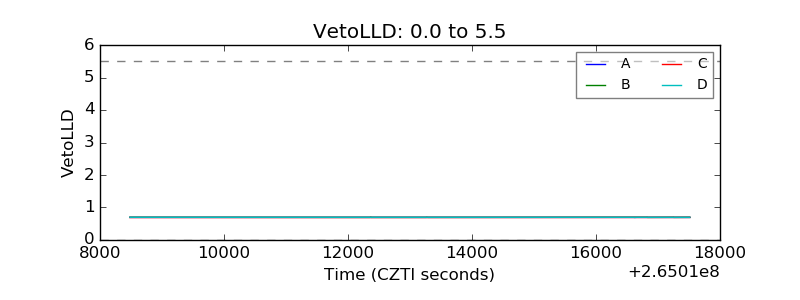 |
| Alpha Counter | 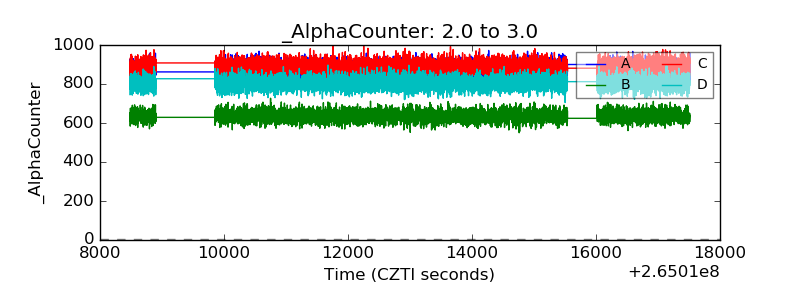 |
| _CPM_Rate | 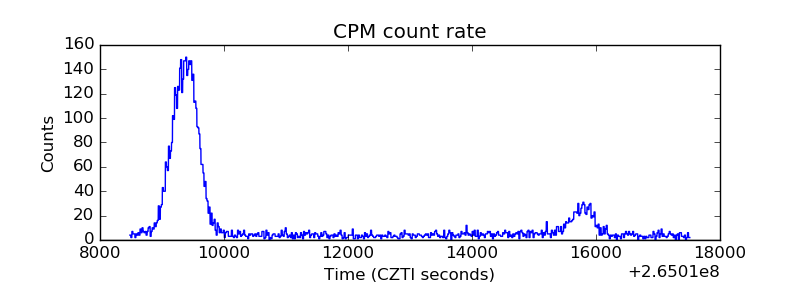 |
| CZT Counter | 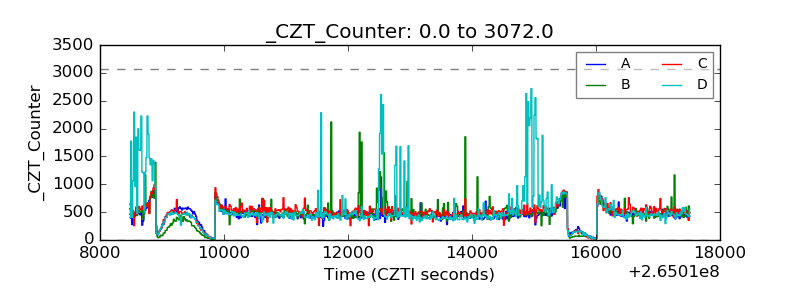 |
| +2.5 Volts monitor |  |
| +5 Volts monitor |  |
| _ROLL_ROT | 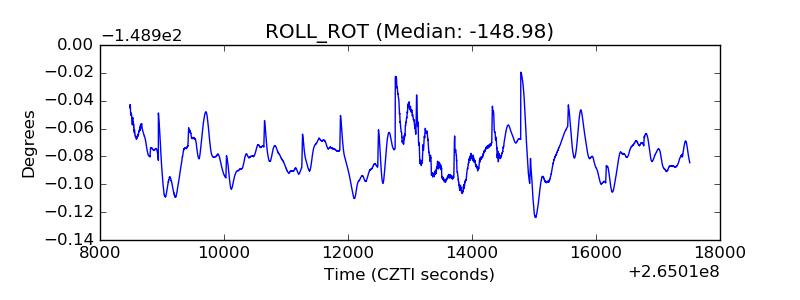 |
| _Roll_DEC | 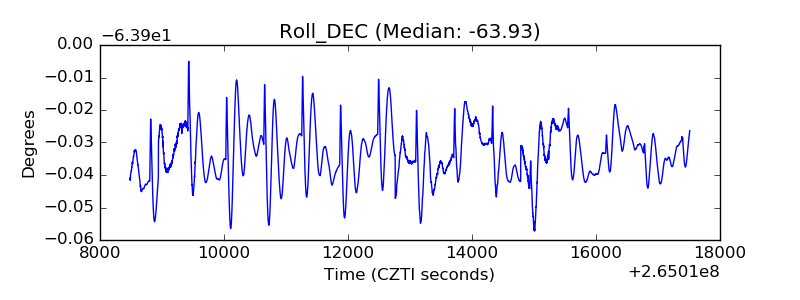 |
| _Roll_RA | 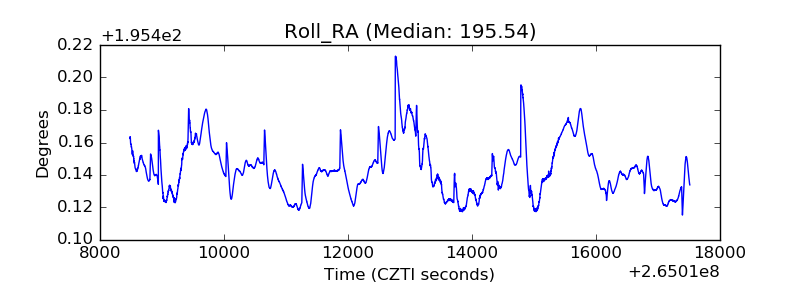 |
| Veto Counter | 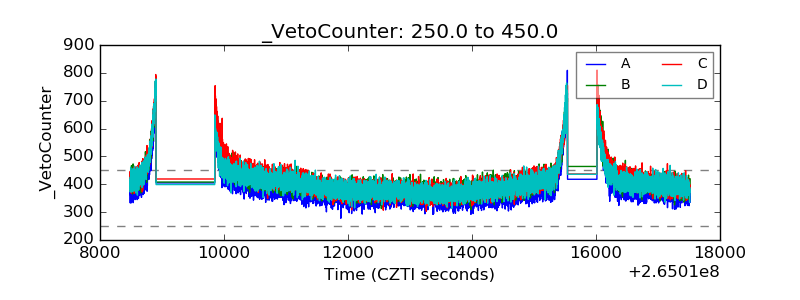 |