| Param | Original file | Final file |
|---|---|---|
| Filename | modeM0/AS1A04_149T01_9000002118_14382cztM0_level2.evt | modeM0/AS1A04_149T01_9000002118_14382cztM0_level2_quad_clean.evt |
| Size (bytes) | 548,187,840 | 95,489,280 |
| Size | 522.8 MB | 91.1 MB |
| Events in quadrant A | 3,067,693 | 642,112 |
| Events in quadrant B | 3,312,834 | 645,562 |
| Events in quadrant C | 3,923,395 | 622,581 |
| Events in quadrant D | 5,846,376 | 516,958 |
| Mode SS | |||
|---|---|---|---|
| Quadrant | BADHDUFLAG | Total packets | Discarded packets |
| A | 0 | 136 | 0 |
| B | 0 | 136 | 0 |
| C | 0 | 136 | 0 |
| D | 0 | 136 | 0 |
| Mode M0 | |||
|---|---|---|---|
| Quadrant | BADHDUFLAG | Total packets | Discarded packets |
| A | 0 | 13610 | 3 |
| B | 0 | 14284 | 2 |
| C | 0 | 16268 | 2 |
| D | 0 | 22012 | 2 |
| Mode M9 | |||
|---|---|---|---|
| Quadrant | BADHDUFLAG | Total packets | Discarded packets |
| A | 0 | 19 | 0 |
| B | 0 | 19 | 0 |
| C | 0 | 19 | 0 |
| D | 0 | 19 | 0 |
| Quadrant | Total seconds | Saturated seconds | Saturation percentage |
|---|---|---|---|
| A | 6660 | 27 | 0.405405% |
| B | 6660 | 42 | 0.630631% |
| C | 6660 | 17 | 0.255255% |
| D | 6660 | 1148 | 17.237237% |
Noise dominated data is calculated using 1-second bins in cleaned event files. If a bin has >2000 counts, and if more than 50% of those come from <1% of pixels, then it is considered to be noise-dominated and hence unusable.
| Quadrant | # 1 sec bins | Bins with >0 counts | Bins with >2000 counts | High rate bins dominated by noise | Noise dominated (total time) | Noise dominated (detector-on time) | Marked lightcurve |
|---|---|---|---|---|---|---|---|
| A | 8476 | 6662 | 3 | 3 | 0.04% | 0.05% | 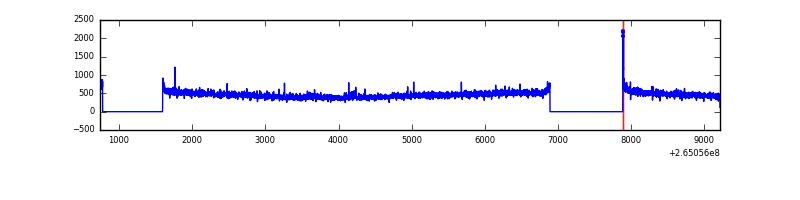 |
| B | 8476 | 6663 | 4 | 4 | 0.05% | 0.06% | 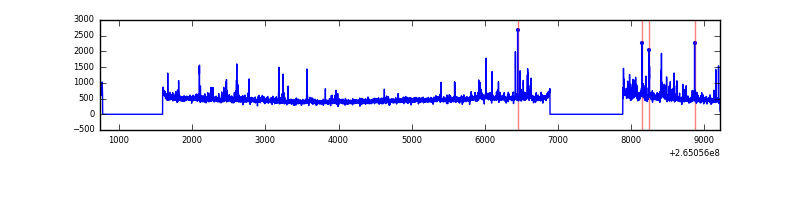 |
| C | 8476 | 6663 | 2 | 2 | 0.02% | 0.03% | 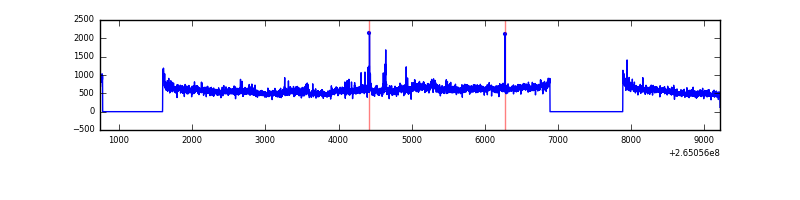 |
| D | 8475 | 6662 | 1111 | 1111 | 13.11% | 16.68% | 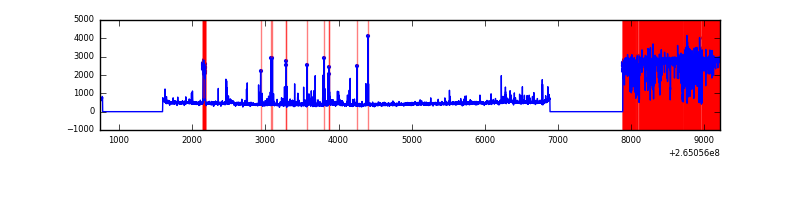 |
Top three noisy pixels from each quadrant. If the there are fewer than three noisy pixels in the level2.evt file, extra rows are filled as -1
| Pixel properties | Quadrant properties | ||||||
|---|---|---|---|---|---|---|---|
| Quadrant | DetID | PixID | Counts | Sigma | Mean | Median | Sigma |
| A | 8 | 15 | 38889 | 238.06 | 781 | 763 | 160.2 |
| A | 4 | 2 | 11625 | 67.82 | 781 | 763 | 160.2 |
| A | 0 | 226 | 6967 | 38.74 | 781 | 763 | 160.2 |
| B | 10 | 245 | 63478 | 415.09 | 784 | 763 | 151.1 |
| B | 0 | 229 | 45594 | 296.72 | 784 | 763 | 151.1 |
| B | 0 | 219 | 40559 | 263.4 | 784 | 763 | 151.1 |
| C | 3 | 233 | 973242 | 5599.42 | 750 | 754 | 173.7 |
| C | 3 | 232 | 7713 | 40.07 | 750 | 754 | 173.7 |
| C | 8 | 128 | 7317 | 37.79 | 750 | 754 | 173.7 |
| D | 1 | 52 | 2933714 | 16701.06 | 672 | 654 | 175.6 |
| D | 2 | 120 | 113164 | 640.64 | 672 | 654 | 175.6 |
| D | 12 | 110 | 95488 | 539.99 | 672 | 654 | 175.6 |
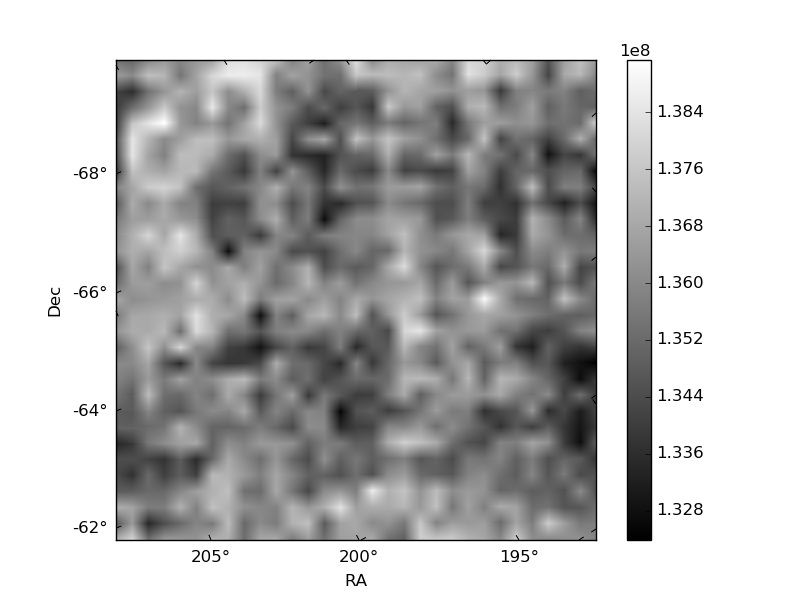
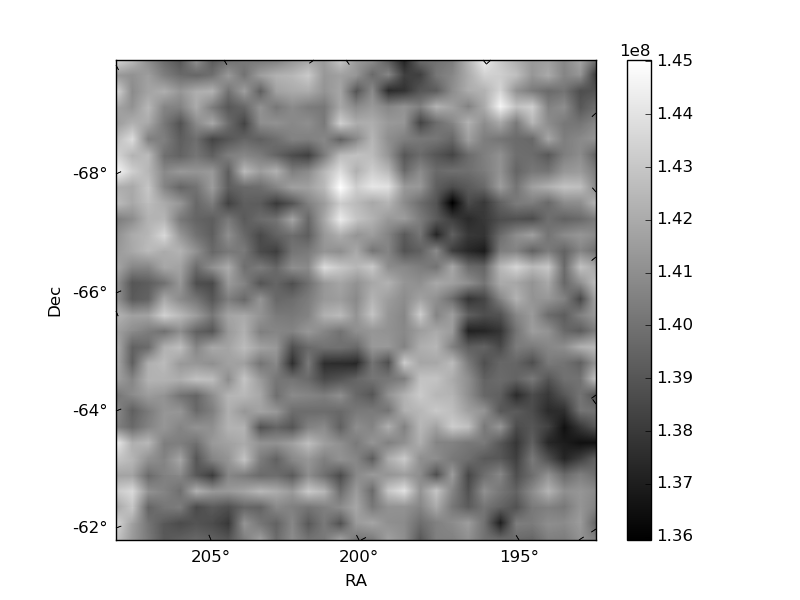
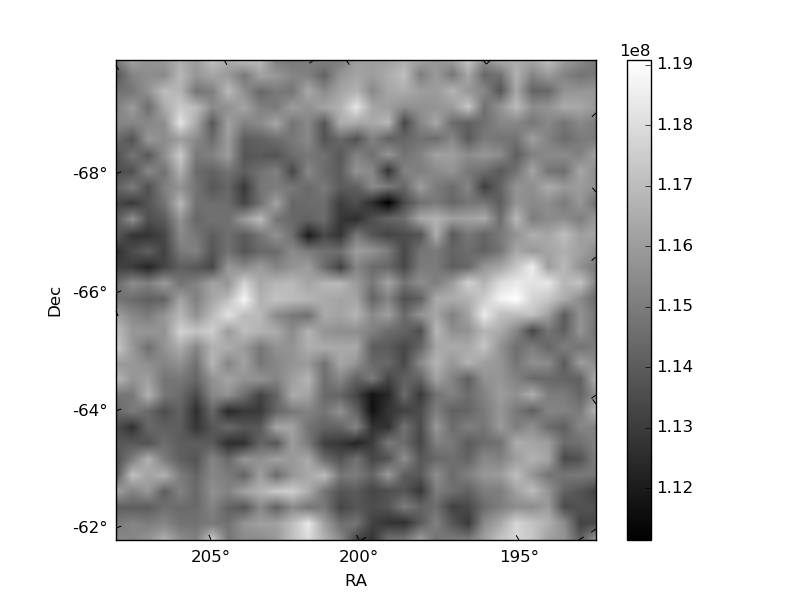
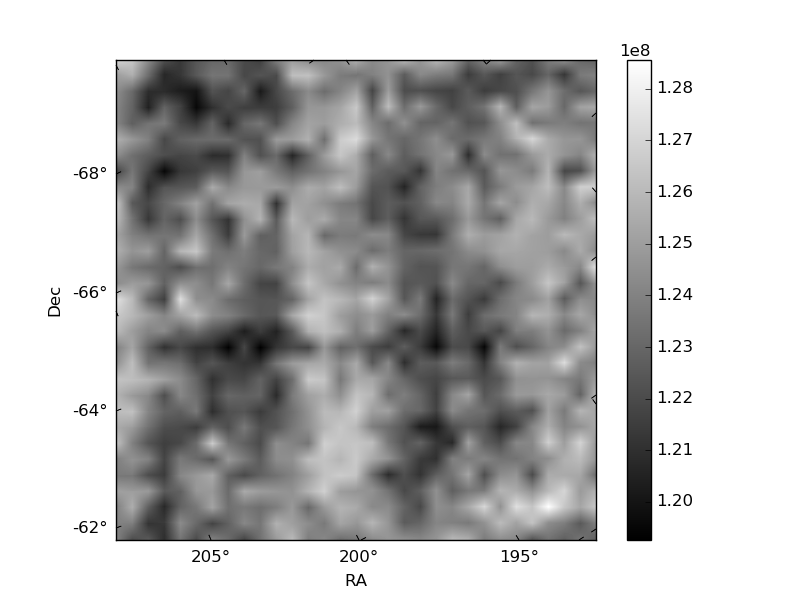
Histogram calculated using DETX and DETY for each event in the final _common_clean file
| Quadrant A | 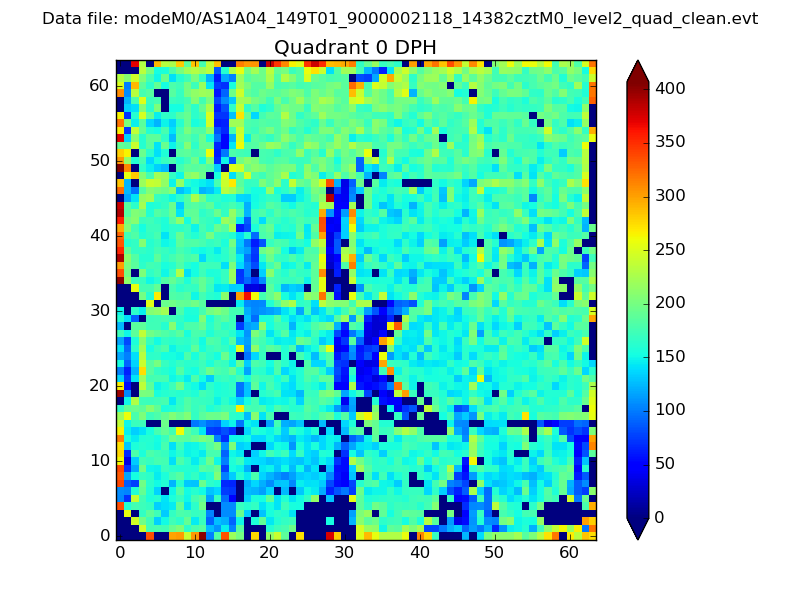 |
 |
Quadrant B |
|---|---|---|---|
| Quadrant D |  |
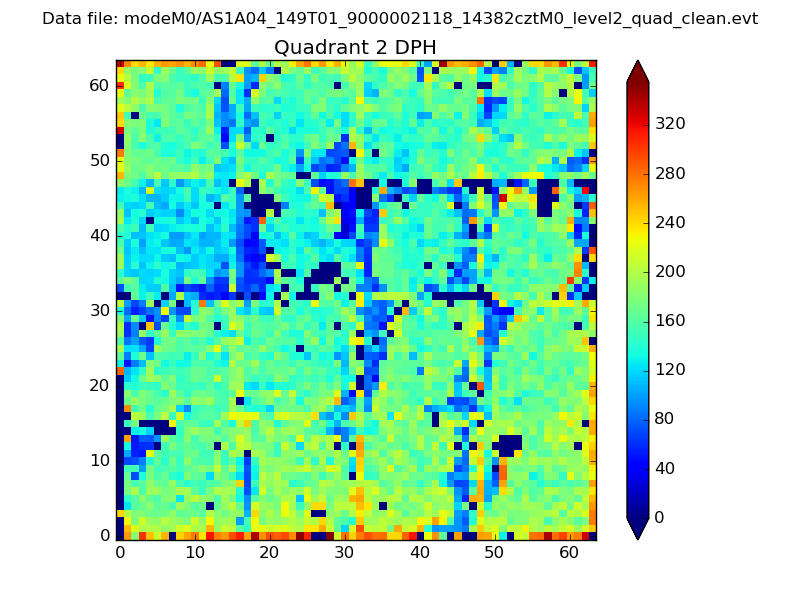 |
Quadrant C |
| Plot type | Count rate plots | Images |
|---|---|---|
| Comparison with Poisson distribution Blue bars denote a histogram of data divided into 1 sec bins. Red curve is a Poisson curve with rate = median count rate of data. |
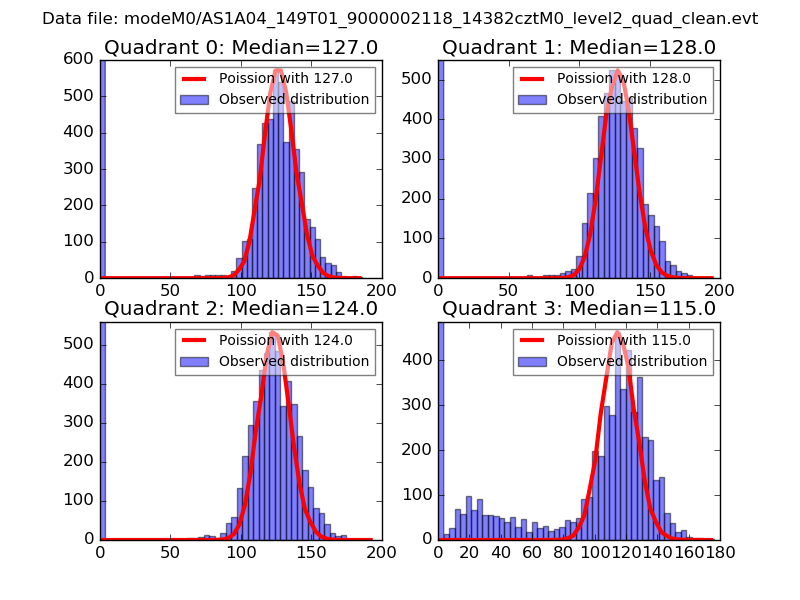 |
 |
| Quadrant-wise count rates Data is divided into 100 sec bins |
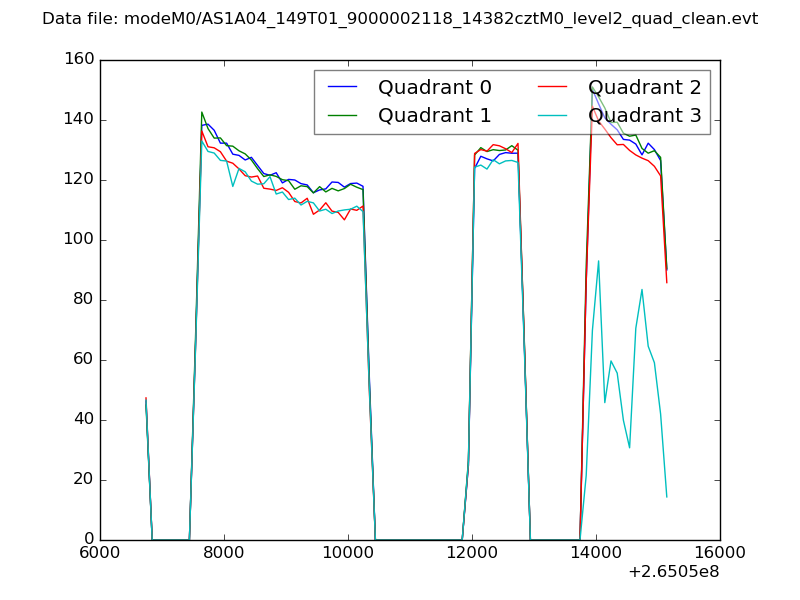 |
|
| Module-wise count rates for Quadrant A Data is divided into 100 sec bins |
 |
 |
| Module-wise count rates for Quadrant B Data is divided into 100 sec bins |
 |
 |
| Module-wise count rates for Quadrant C Data is divided into 100 sec bins |
 |
 |
| Module-wise count rates for Quadrant D Data is divided into 100 sec bins |
 |
 |
| Parameter | Plot |
|---|---|
| CZT HV Monitor |  |
| D_VDD | 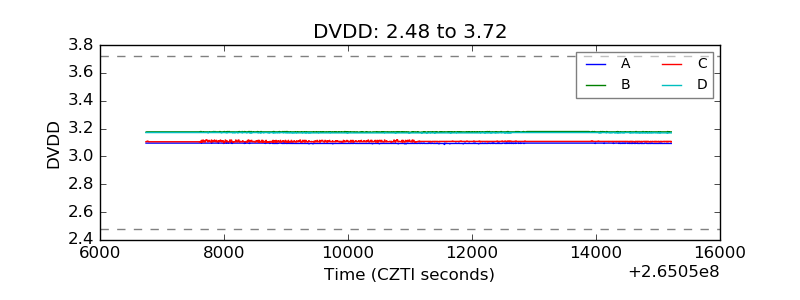 |
| Temperature 1 | 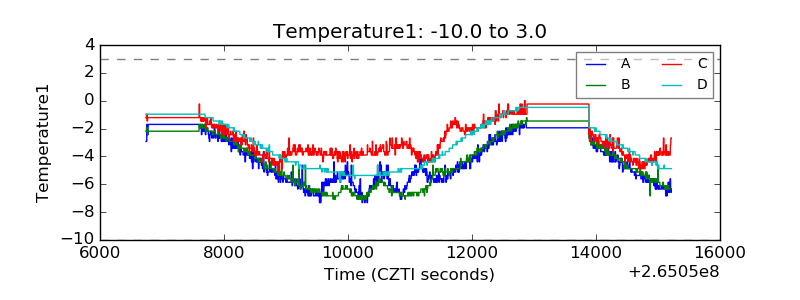 |
| Veto HV Monitor | 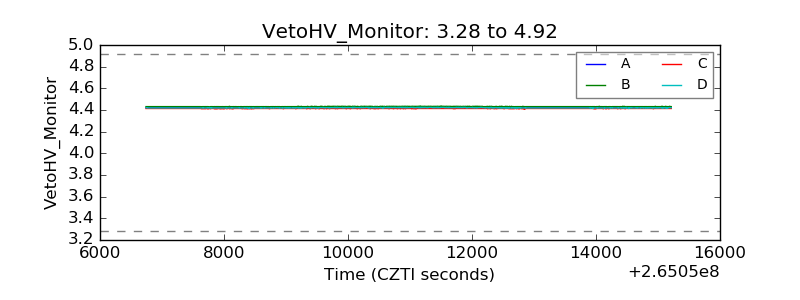 |
| Veto LLD | 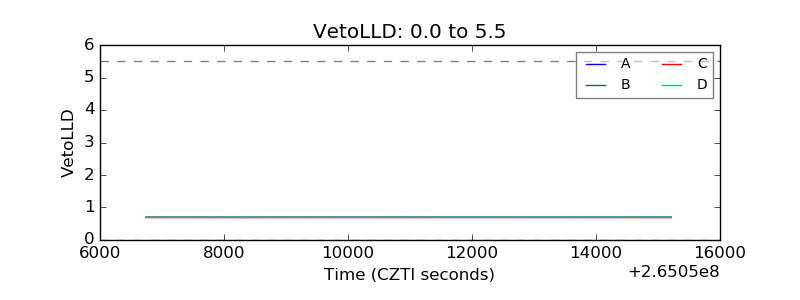 |
| Alpha Counter | 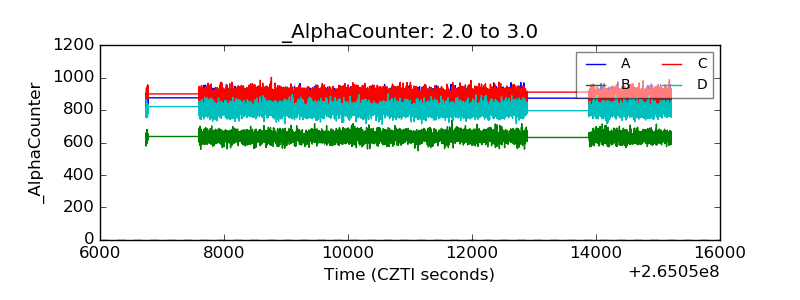 |
| _CPM_Rate | 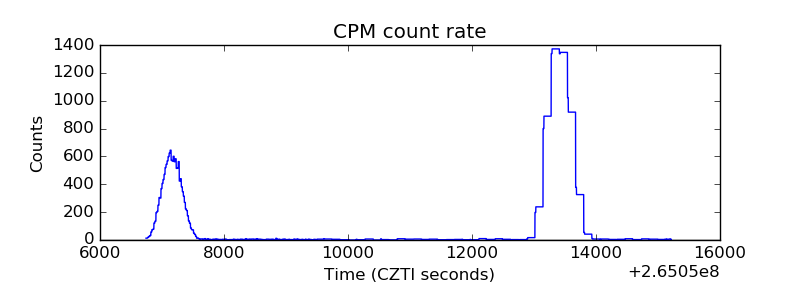 |
| CZT Counter | 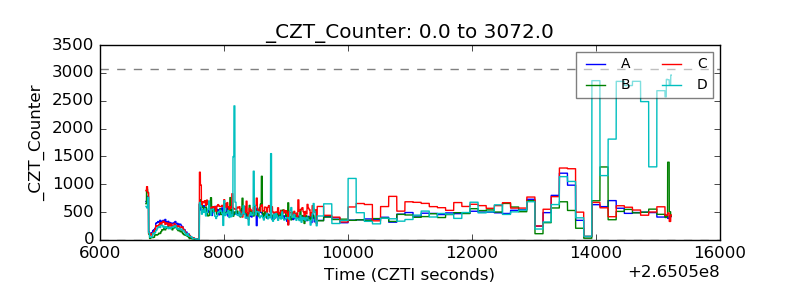 |
| +2.5 Volts monitor | 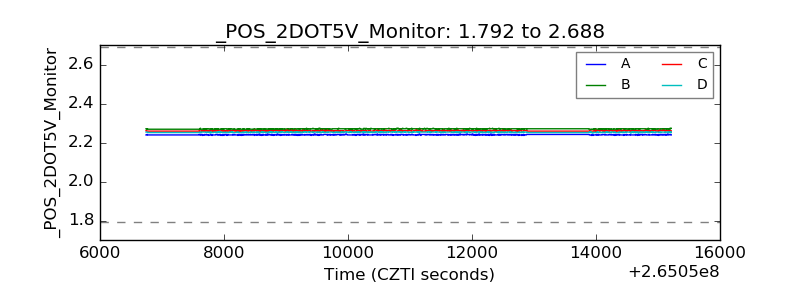 |
| +5 Volts monitor | 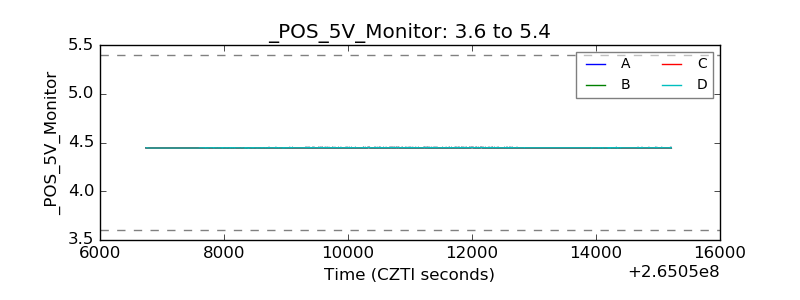 |
| _ROLL_ROT | 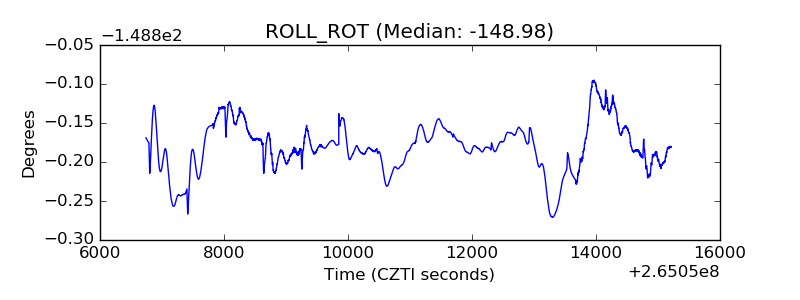 |
| _Roll_DEC | 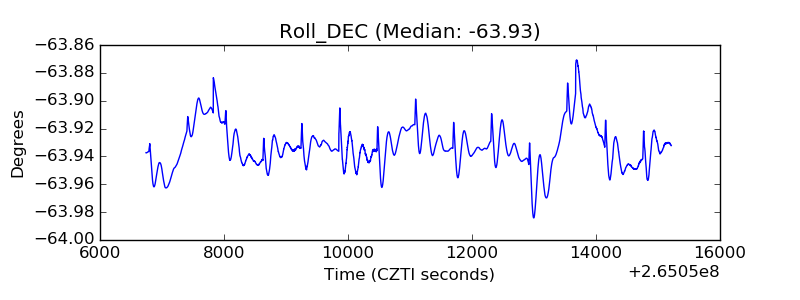 |
| _Roll_RA | 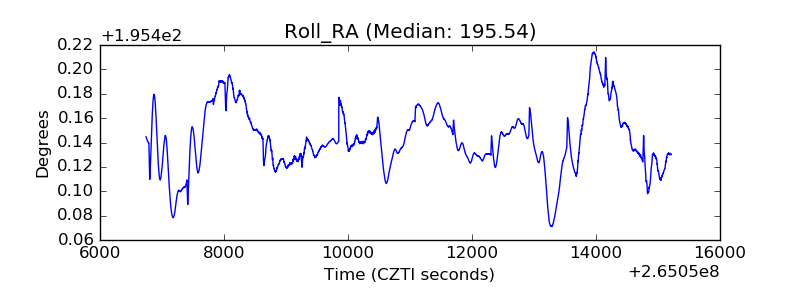 |
| Veto Counter | 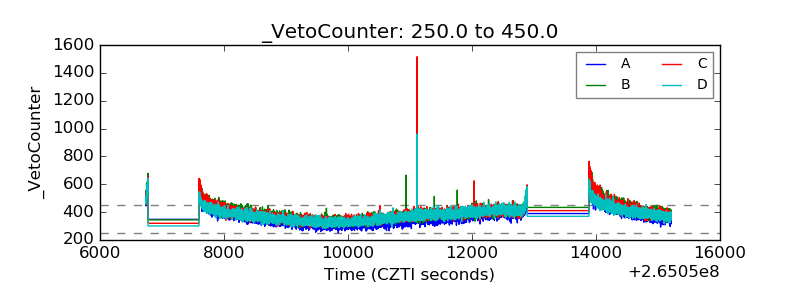 |