| Param | Original file | Final file |
|---|---|---|
| Filename | modeM0/AS1A04_149T01_9000002118_14383cztM0_level2.evt | modeM0/AS1A04_149T01_9000002118_14383cztM0_level2_quad_clean.evt |
| Size (bytes) | 208,722,240 | 26,619,840 |
| Size | 199.1 MB | 25.4 MB |
| Events in quadrant A | 730,858 | 205,104 |
| Events in quadrant B | 845,050 | 207,157 |
| Events in quadrant C | 829,009 | 198,626 |
| Events in quadrant D | 3,810,022 | 81,020 |
| Mode SS | |||
|---|---|---|---|
| Quadrant | BADHDUFLAG | Total packets | Discarded packets |
| A | 0 | 32 | 0 |
| B | 0 | 32 | 0 |
| C | 0 | 32 | 0 |
| D | 0 | 32 | 0 |
| Mode M0 | |||
|---|---|---|---|
| Quadrant | BADHDUFLAG | Total packets | Discarded packets |
| A | 0 | 3162 | 1 |
| B | 0 | 3525 | 1 |
| C | 0 | 3470 | 1 |
| D | 0 | 12277 | 1 |
| Mode M9 | |||
|---|---|---|---|
| Quadrant | BADHDUFLAG | Total packets | Discarded packets |
| A | 0 | 7 | 0 |
| B | 0 | 7 | 0 |
| C | 0 | 7 | 0 |
| D | 0 | 8 | 0 |
| Quadrant | Total seconds | Saturated seconds | Saturation percentage |
|---|---|---|---|
| A | 1524 | 8 | 0.524934% |
| B | 1524 | 11 | 0.721785% |
| C | 1524 | 3 | 0.196850% |
| D | 1524 | 1299 | 85.236220% |
Noise dominated data is calculated using 1-second bins in cleaned event files. If a bin has >2000 counts, and if more than 50% of those come from <1% of pixels, then it is considered to be noise-dominated and hence unusable.
| Quadrant | # 1 sec bins | Bins with >0 counts | Bins with >2000 counts | High rate bins dominated by noise | Noise dominated (total time) | Noise dominated (detector-on time) | Marked lightcurve |
|---|---|---|---|---|---|---|---|
| A | 1525 | 1525 | 3 | 3 | 0.20% | 0.20% | 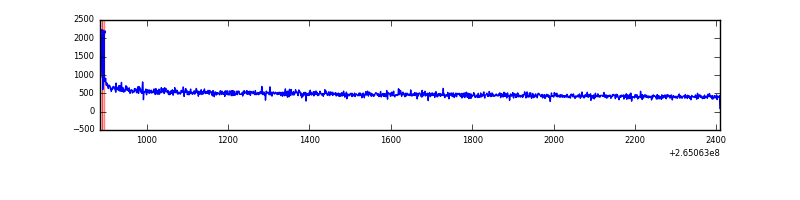 |
| B | 1525 | 1525 | 3 | 3 | 0.20% | 0.20% | 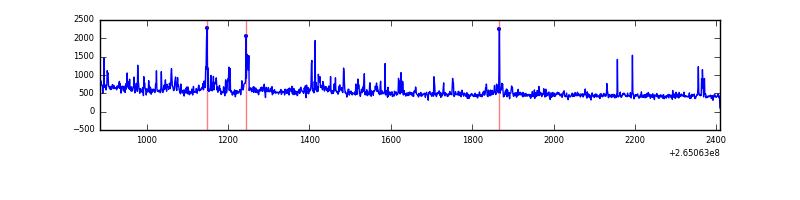 |
| C | 1525 | 1525 | 0 | 0 | 0.00% | 0.00% | 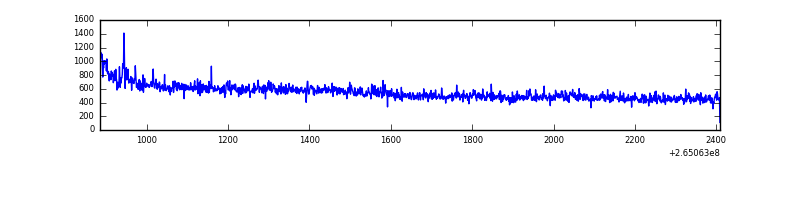 |
| D | 1524 | 1524 | 1264 | 1264 | 82.94% | 82.94% | 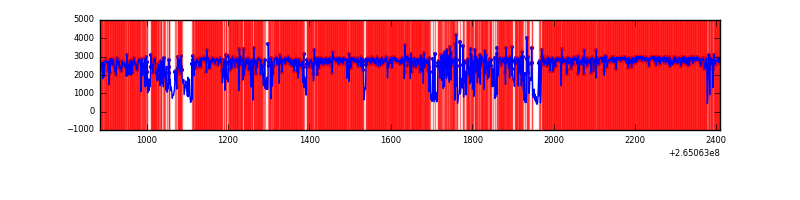 |
Top three noisy pixels from each quadrant. If the there are fewer than three noisy pixels in the level2.evt file, extra rows are filled as -1
| Pixel properties | Quadrant properties | ||||||
|---|---|---|---|---|---|---|---|
| Quadrant | DetID | PixID | Counts | Sigma | Mean | Median | Sigma |
| A | 4 | 2 | 8190 | 199.14 | 185 | 181 | 40.2 |
| A | 8 | 15 | 6046 | 145.83 | 185 | 181 | 40.2 |
| A | 2 | 242 | 1936 | 43.64 | 185 | 181 | 40.2 |
| B | 0 | 229 | 32682 | 851.38 | 187 | 183 | 38.2 |
| B | 10 | 245 | 29050 | 756.23 | 187 | 183 | 38.2 |
| B | 0 | 219 | 17120 | 443.7 | 187 | 183 | 38.2 |
| C | 3 | 233 | 148872 | 3521.37 | 174 | 175 | 42.2 |
| C | 13 | 61 | 1252 | 25.51 | 174 | 175 | 42.2 |
| C | 10 | 22 | 820 | 15.27 | 174 | 175 | 42.2 |
| D | 1 | 52 | 3439939 | 146368.62 | 88 | 85 | 23.5 |
| D | 2 | 120 | 8797 | 370.7 | 88 | 85 | 23.5 |
| D | 8 | 195 | 7791 | 327.9 | 88 | 85 | 23.5 |
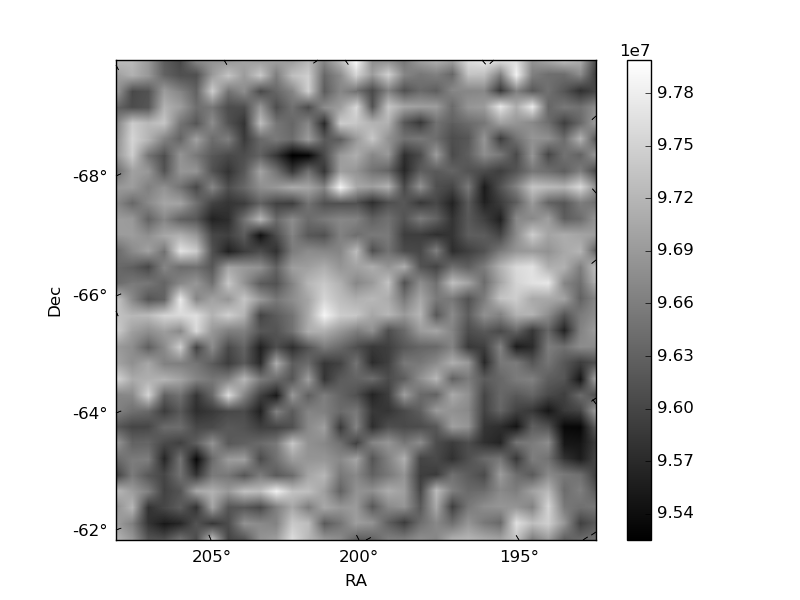
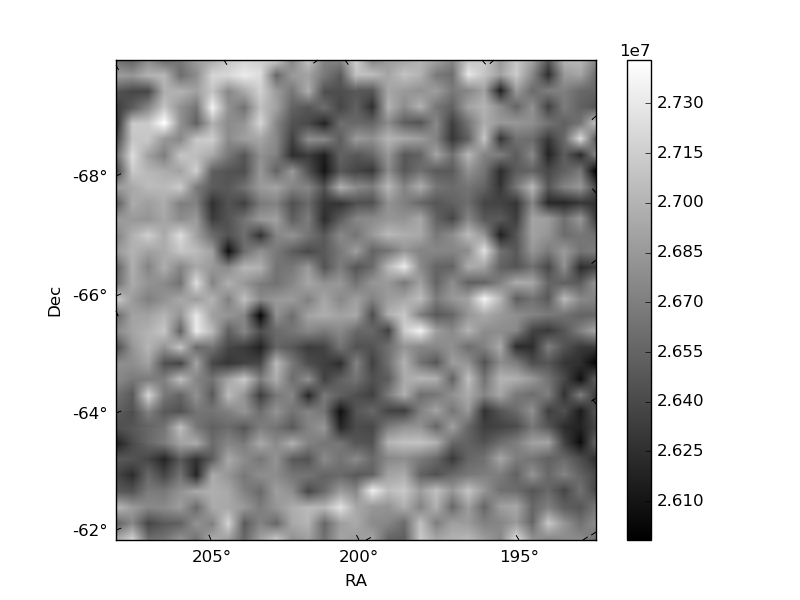
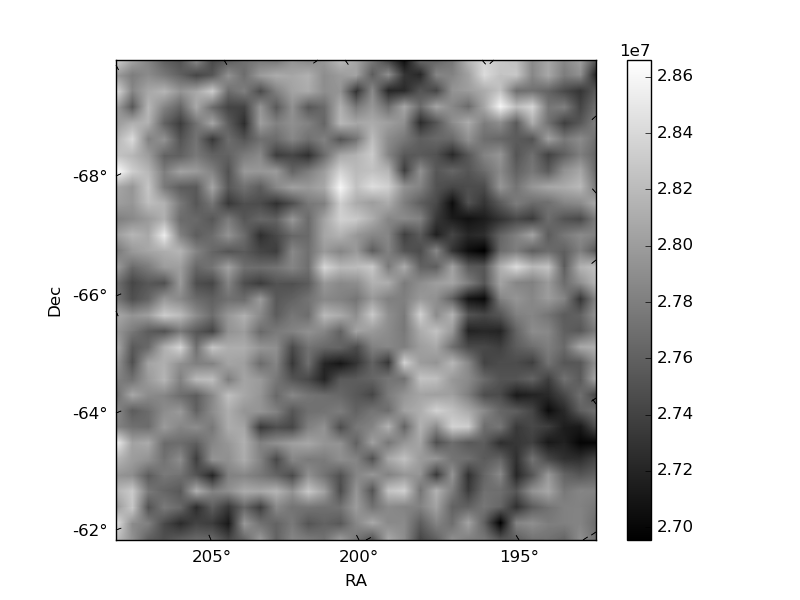
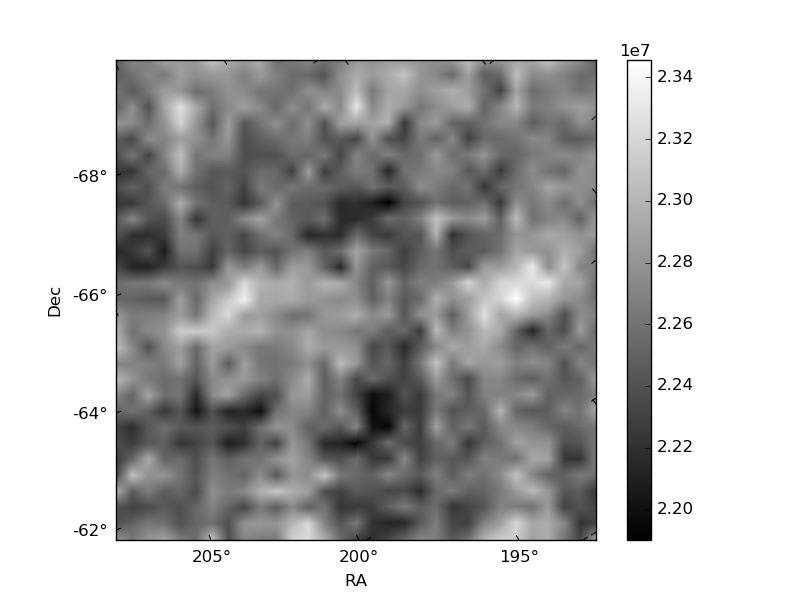
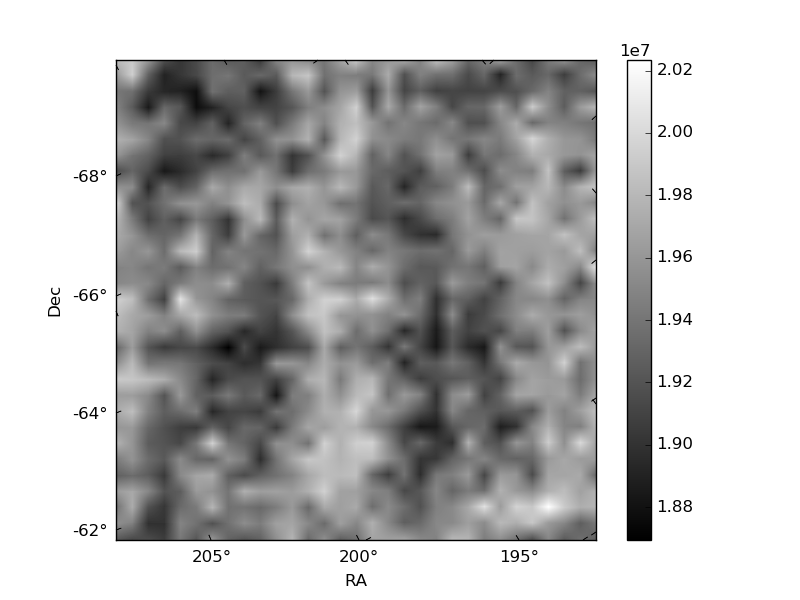
Histogram calculated using DETX and DETY for each event in the final _common_clean file
| Quadrant A | 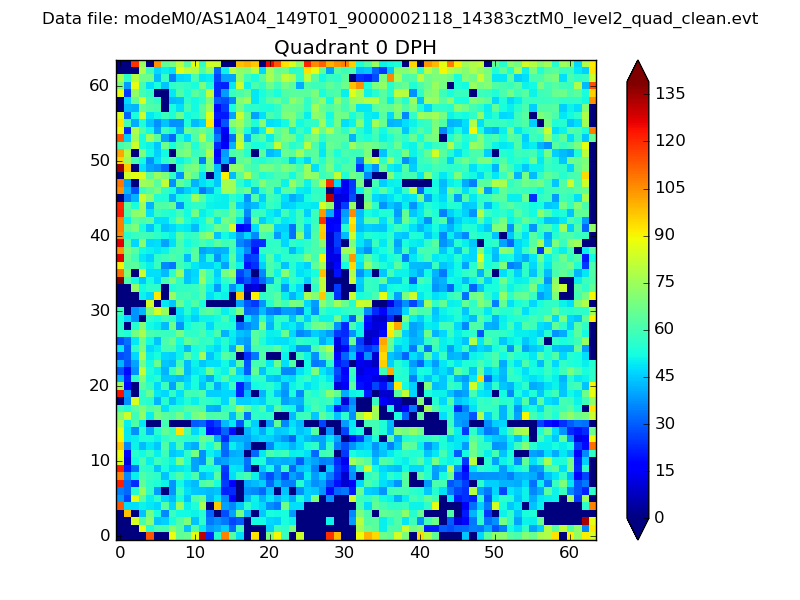 |
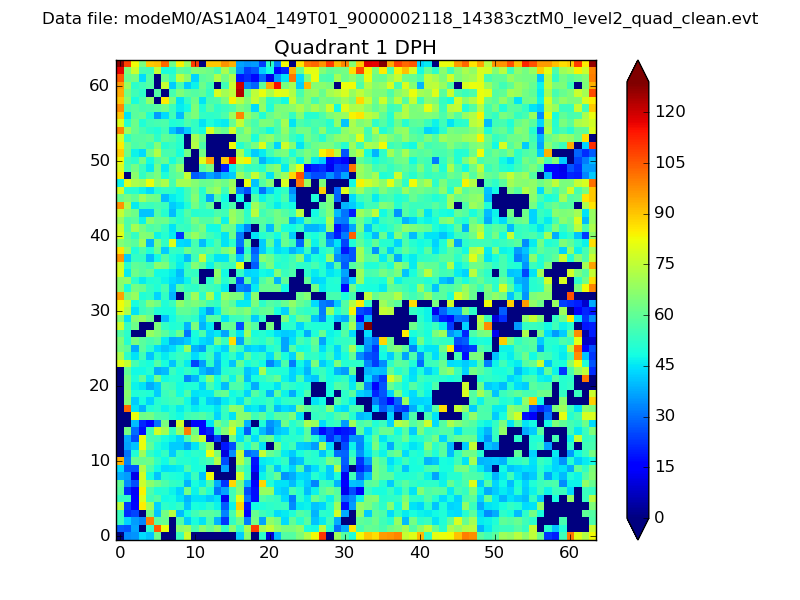 |
Quadrant B |
|---|---|---|---|
| Quadrant D |  |
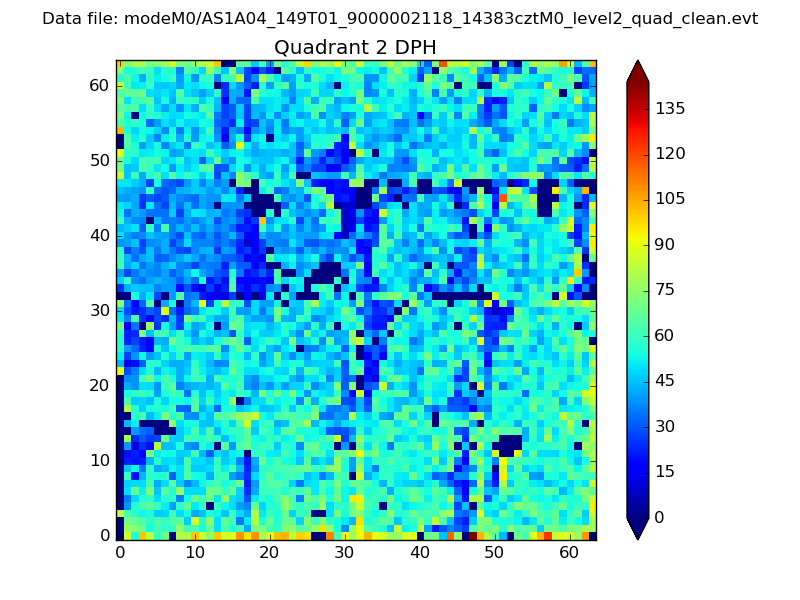 |
Quadrant C |
| Plot type | Count rate plots | Images |
|---|---|---|
| Comparison with Poisson distribution Blue bars denote a histogram of data divided into 1 sec bins. Red curve is a Poisson curve with rate = median count rate of data. |
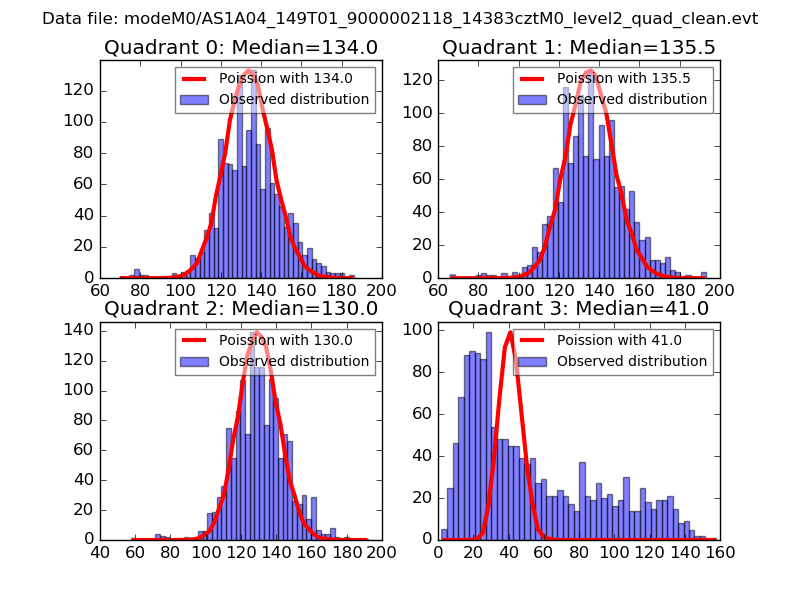 |
 |
| Quadrant-wise count rates Data is divided into 100 sec bins |
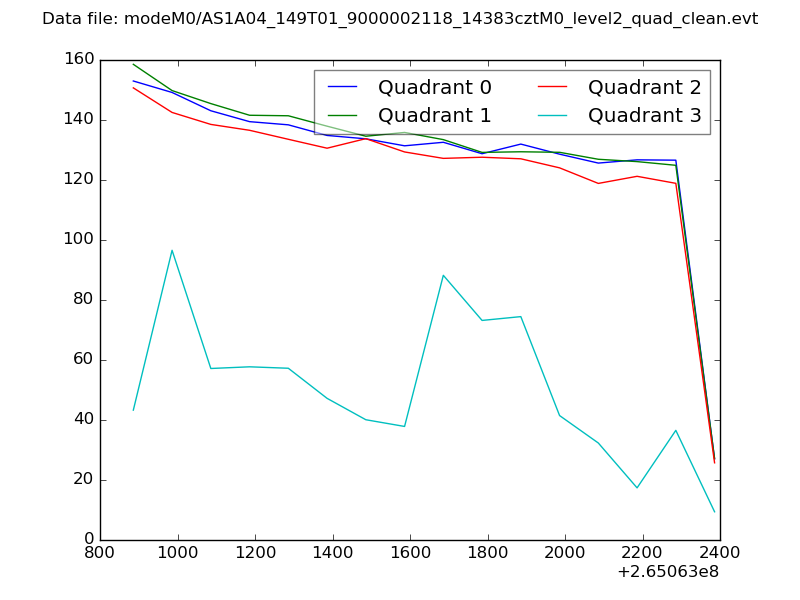 |
|
| Module-wise count rates for Quadrant A Data is divided into 100 sec bins |
 |
 |
| Module-wise count rates for Quadrant B Data is divided into 100 sec bins |
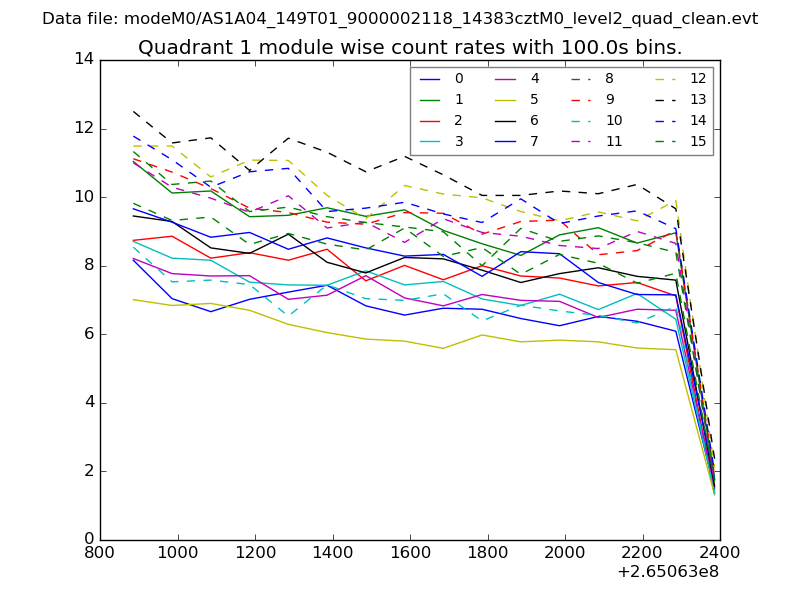 |
 |
| Module-wise count rates for Quadrant C Data is divided into 100 sec bins |
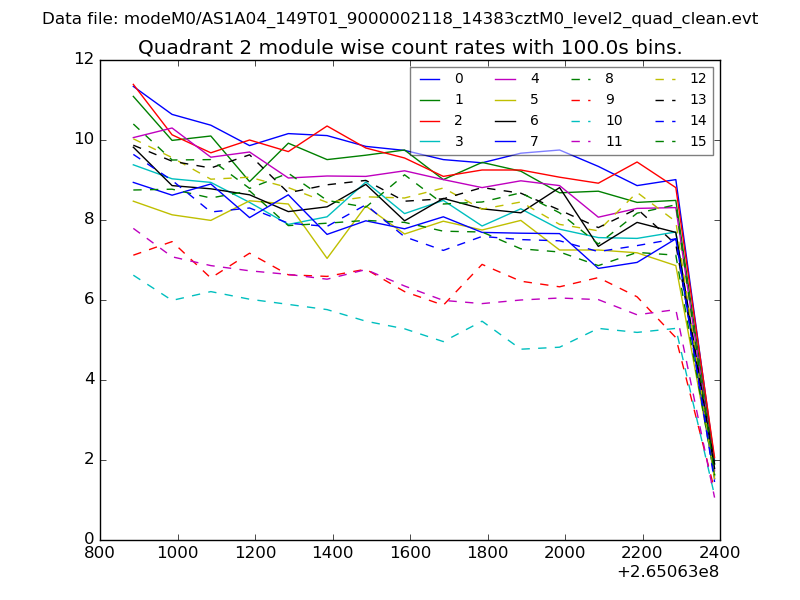 |
 |
| Module-wise count rates for Quadrant D Data is divided into 100 sec bins |
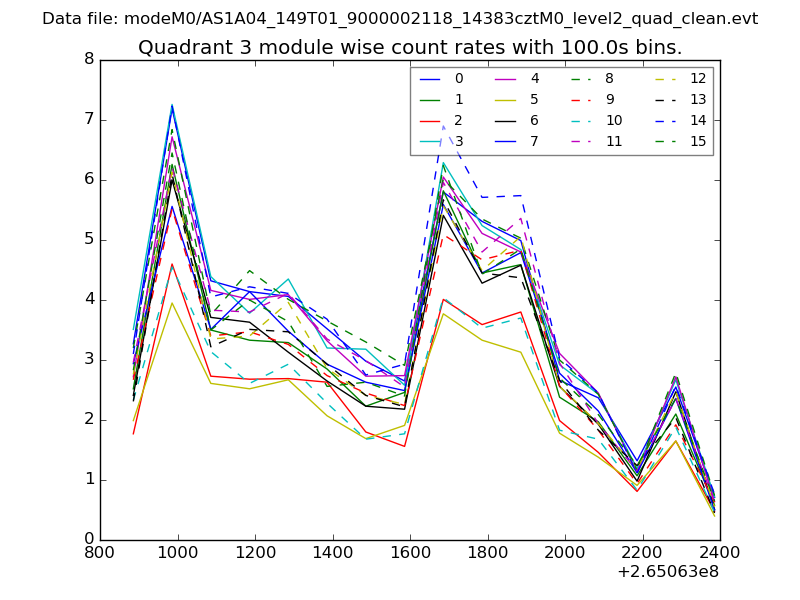 |
 |
| Parameter | Plot |
|---|---|
| CZT HV Monitor |  |
| D_VDD | 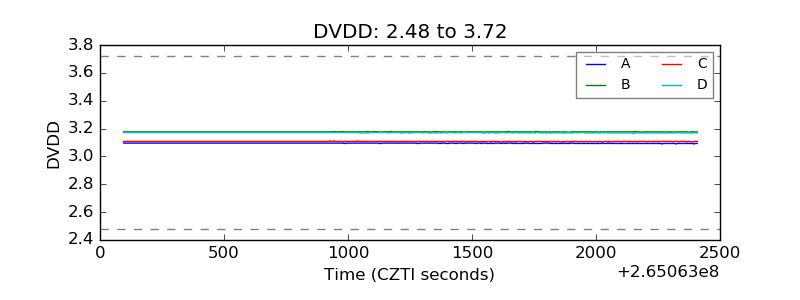 |
| Temperature 1 | 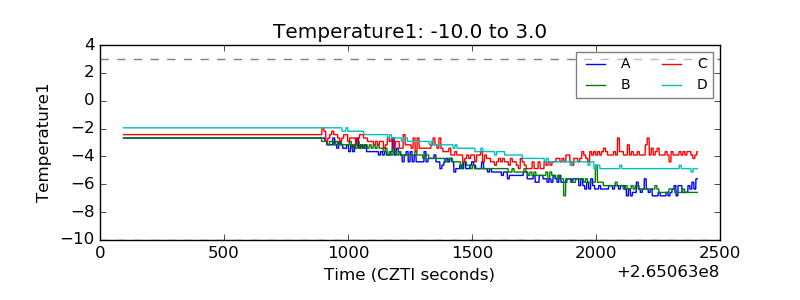 |
| Veto HV Monitor | 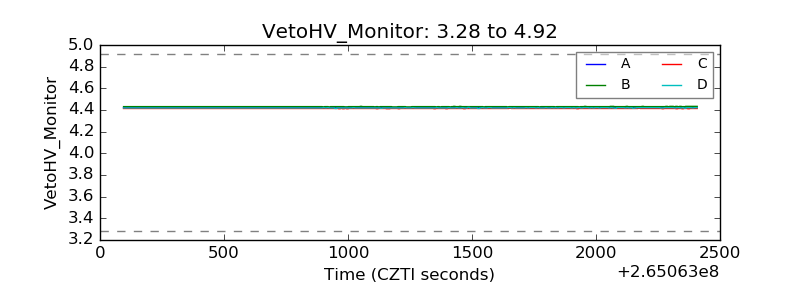 |
| Veto LLD | 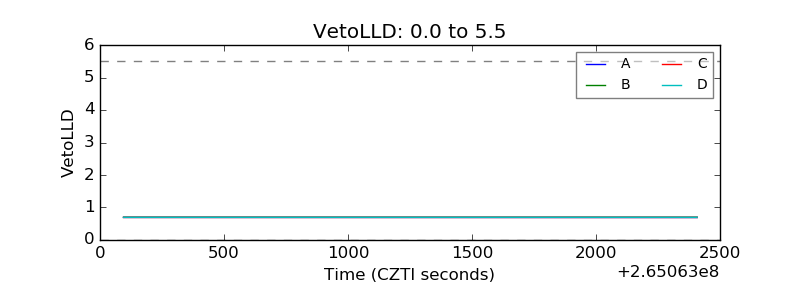 |
| Alpha Counter | 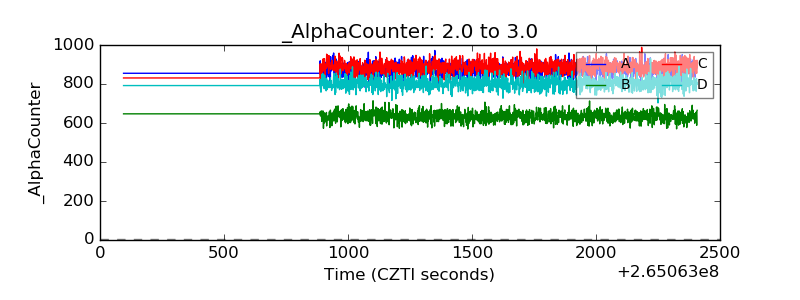 |
| _CPM_Rate | 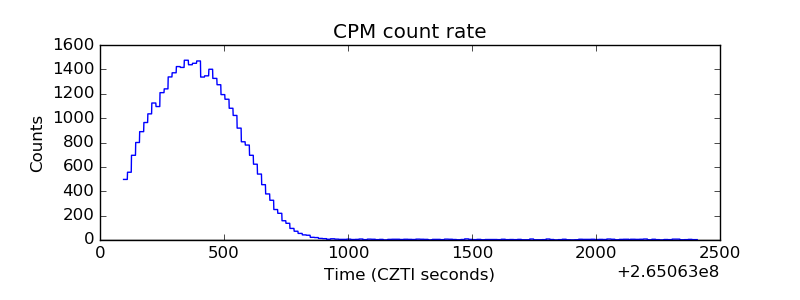 |
| CZT Counter | 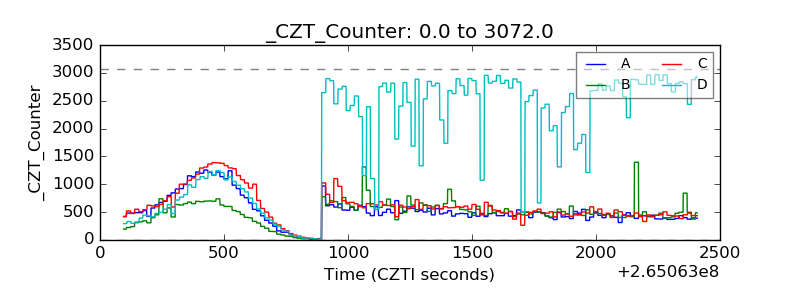 |
| +2.5 Volts monitor |  |
| +5 Volts monitor | 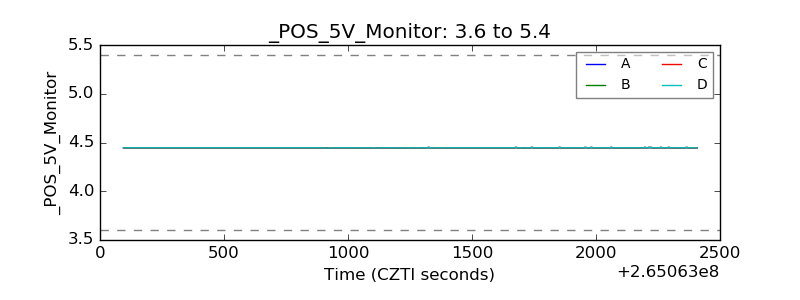 |
| _ROLL_ROT | 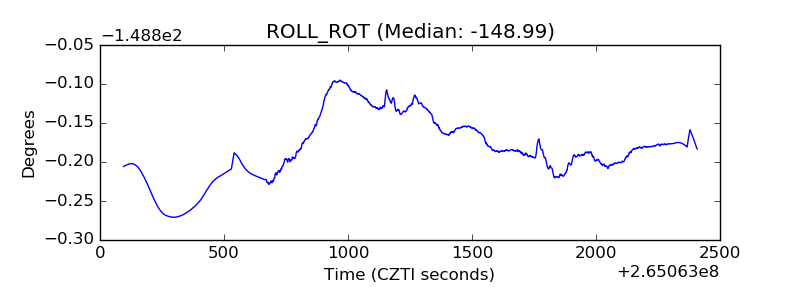 |
| _Roll_DEC | 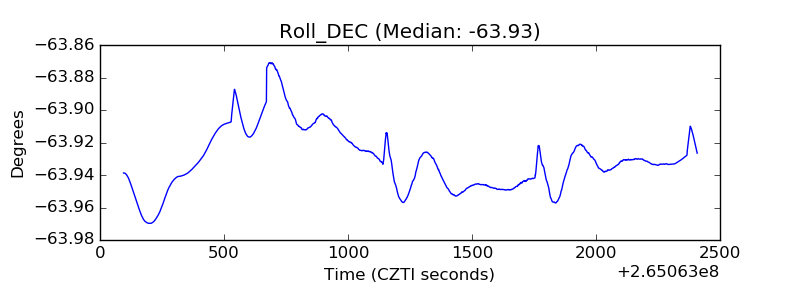 |
| _Roll_RA | 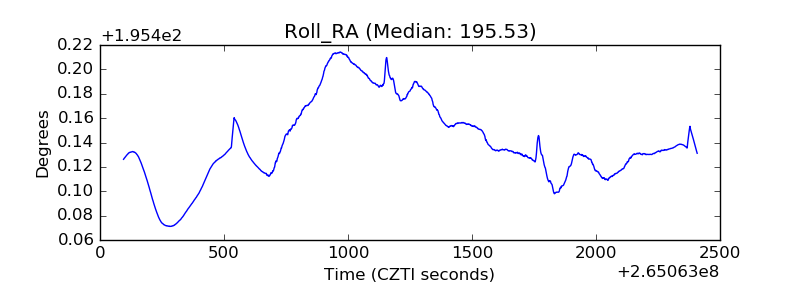 |
| Veto Counter | 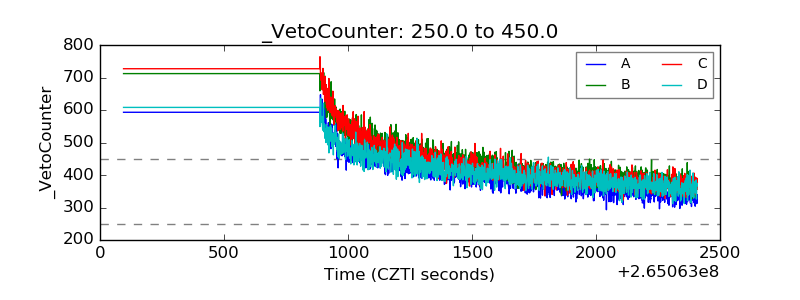 |