| Param | Original file | Final file |
|---|---|---|
| Filename | modeM0/AS1T02_046T01_9000002116cztM0_level2.fits | modeM0/AS1T02_046T01_9000002116cztM0_level2_quad_clean.evt |
| Size (bytes) | 140,137,920 | 147,818,880 |
| Size | 133.6 MB | 141.0 MB |
| Events in quadrant A | 851,330 | 915,076 |
| Events in quadrant B | 809,016 | 901,080 |
| Events in quadrant C | 826,242 | 835,225 |
| Events in quadrant D | 719,452 | 786,851 |
| Mode M9 | |||
|---|---|---|---|
| Quadrant | BADHDUFLAG | Total packets | Discarded packets |
| A | 0 | 23 | 0 |
| B | 0 | 23 | 0 |
| C | 0 | 23 | 0 |
| D | 0 | 23 | 0 |
| Mode SS | |||
|---|---|---|---|
| Quadrant | BADHDUFLAG | Total packets | Discarded packets |
| A | 0 | 306 | 0 |
| B | 0 | 306 | 0 |
| C | 0 | 306 | 0 |
| D | 0 | 306 | 0 |
| Mode M0 | |||
|---|---|---|---|
| Quadrant | BADHDUFLAG | Total packets | Discarded packets |
| A | 0 | 30908 | 0 |
| B | 0 | 34026 | 0 |
| C | 0 | 33592 | 0 |
| D | 0 | 35116 | 0 |
| Quadrant | Total seconds | Saturated seconds | Saturation percentage |
|---|---|---|---|
| A | 15045 | 157 | 1.043536% |
| B | 15045 | 402 | 2.671984% |
| C | 15045 | 133 | 0.884015% |
| D | 15045 | 472 | 3.137255% |
Noise dominated data is calculated using 1-second bins in cleaned event files. If a bin has >2000 counts, and if more than 50% of those come from <1% of pixels, then it is considered to be noise-dominated and hence unusable.
| Quadrant | # 1 sec bins | Bins with >0 counts | Bins with >2000 counts | High rate bins dominated by noise | Noise dominated (total time) | Noise dominated (detector-on time) | Marked lightcurve |
|---|---|---|---|---|---|---|---|
| A | 17235 | 15042 | 0 | 0 | 0.00% | 0.00% |  |
| B | 17235 | 15039 | 0 | 0 | 0.00% | 0.00% |  |
| C | 17235 | 15042 | 0 | 0 | 0.00% | 0.00% |  |
| D | 17235 | 14942 | 0 | 0 | 0.00% | 0.00% |  |
Top three noisy pixels from each quadrant. If the there are fewer than three noisy pixels in the level2.evt file, extra rows are filled as -1
| Pixel properties | Quadrant properties | ||||||
|---|---|---|---|---|---|---|---|
| Quadrant | DetID | PixID | Counts | Sigma | Mean | Median | Sigma |
| A | 0 | 29 | 807 | 10.48 | 221 | 207 | 57.3 |
| A | 7 | 110 | 725 | 9.05 | 221 | 207 | 57.3 |
| A | 9 | 19 | 648 | 7.7 | 221 | 207 | 57.3 |
| B | 2 | 9 | 685 | 10.63 | 213 | 202 | 45.4 |
| B | 5 | 225 | 583 | 8.39 | 213 | 202 | 45.4 |
| B | 3 | 17 | 555 | 7.77 | 213 | 202 | 45.4 |
| C | 12 | 241 | 589 | 6.58 | 218 | 202 | 58.8 |
| C | 9 | 188 | 566 | 6.19 | 218 | 202 | 58.8 |
| C | 3 | 126 | 550 | 5.92 | 218 | 202 | 58.8 |
| D | 3 | 159 | 513 | 5.74 | 205 | 186 | 56.9 |
| D | 15 | 46 | 511 | 5.71 | 205 | 186 | 56.9 |
| D | 6 | 231 | 509 | 5.67 | 205 | 186 | 56.9 |
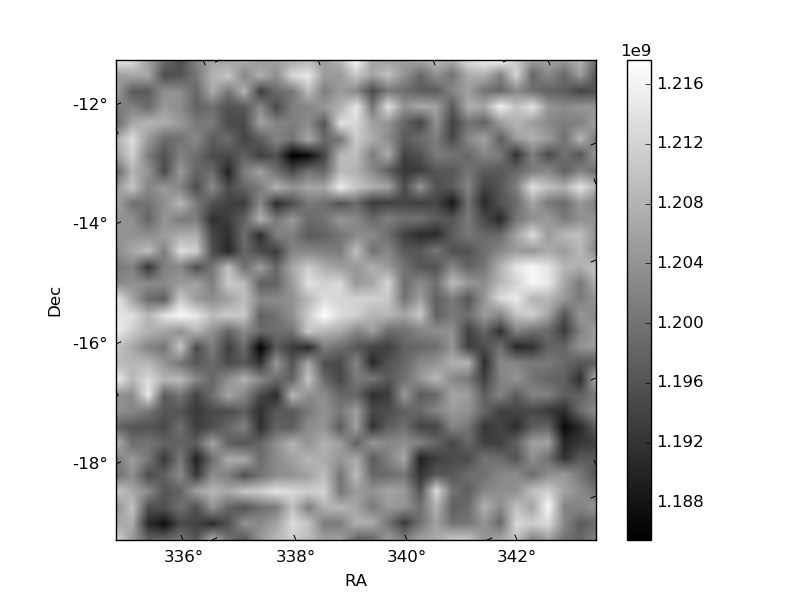
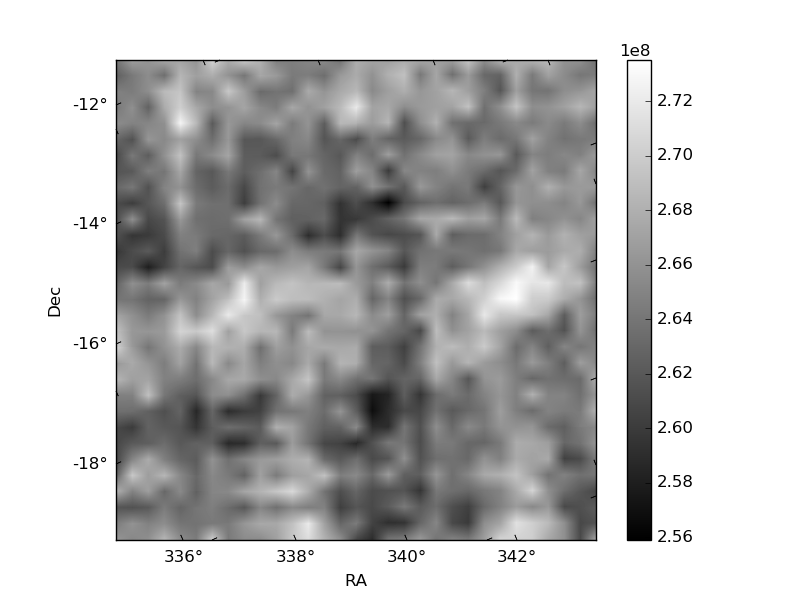
Histogram calculated using DETX and DETY for each event in the final _common_clean file
| Quadrant A |  |
 |
Quadrant B |
|---|---|---|---|
| Quadrant D |  |
 |
Quadrant C |
| Plot type | Count rate plots | Images |
|---|---|---|
| Comparison with Poisson distribution Blue bars denote a histogram of data divided into 1 sec bins. Red curve is a Poisson curve with rate = median count rate of data. |
 |
 |
| Quadrant-wise count rates Data is divided into 100 sec bins |
 |
|
| Module-wise count rates for Quadrant A Data is divided into 100 sec bins |
 |
 |
| Module-wise count rates for Quadrant B Data is divided into 100 sec bins |
 |
 |
| Module-wise count rates for Quadrant C Data is divided into 100 sec bins |
 |
 |
| Module-wise count rates for Quadrant D Data is divided into 100 sec bins |
 |
 |
| Parameter | Plot |
|---|---|
| CZT HV Monitor |  |
| D_VDD |  |
| Temperature 1 |  |
| Veto HV Monitor |  |
| Veto LLD |  |
| Alpha Counter |  |
| _CPM_Rate |  |
| CZT Counter | 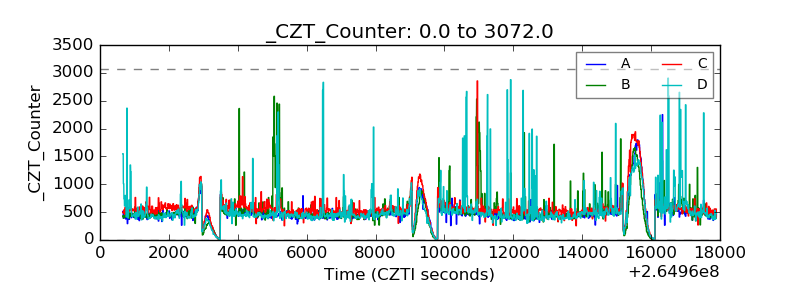 |
| +2.5 Volts monitor |  |
| +5 Volts monitor |  |
| _ROLL_ROT |  |
| _Roll_DEC |  |
| _Roll_RA | 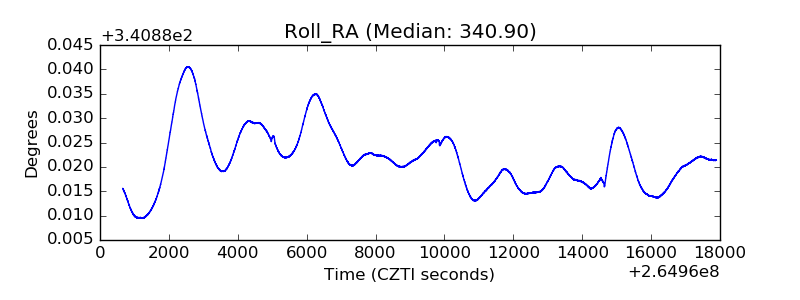 |
| Veto Counter |  |