| Param | Original file | Final file |
|---|---|---|
| Filename | modeM0/AS1T02_046T01_9000002116_14367cztM0_level2.evt | modeM0/AS1T02_046T01_9000002116_14367cztM0_level2_quad_clean.evt |
| Size (bytes) | 478,802,880 | 82,840,320 |
| Size | 456.6 MB | 79.0 MB |
| Events in quadrant A | 3,059,795 | 528,462 |
| Events in quadrant B | 3,589,721 | 526,093 |
| Events in quadrant C | 3,479,810 | 508,562 |
| Events in quadrant D | 3,935,962 | 498,309 |
| Mode M9 | |||
|---|---|---|---|
| Quadrant | BADHDUFLAG | Total packets | Discarded packets |
| A | 0 | 10 | 0 |
| B | 0 | 10 | 0 |
| C | 0 | 10 | 0 |
| D | 0 | 10 | 0 |
| Mode SS | |||
|---|---|---|---|
| Quadrant | BADHDUFLAG | Total packets | Discarded packets |
| A | 0 | 128 | 0 |
| B | 0 | 128 | 0 |
| C | 0 | 128 | 0 |
| D | 0 | 128 | 0 |
| Mode M0 | |||
|---|---|---|---|
| Quadrant | BADHDUFLAG | Total packets | Discarded packets |
| A | 0 | 13177 | 2 |
| B | 0 | 14805 | 1 |
| C | 0 | 13961 | 1 |
| D | 0 | 16050 | 1 |
| Quadrant | Total seconds | Saturated seconds | Saturation percentage |
|---|---|---|---|
| A | 6416 | 39 | 0.607855% |
| B | 6416 | 126 | 1.963840% |
| C | 6416 | 28 | 0.436409% |
| D | 6416 | 316 | 4.925187% |
Noise dominated data is calculated using 1-second bins in cleaned event files. If a bin has >2000 counts, and if more than 50% of those come from <1% of pixels, then it is considered to be noise-dominated and hence unusable.
| Quadrant | # 1 sec bins | Bins with >0 counts | Bins with >2000 counts | High rate bins dominated by noise | Noise dominated (total time) | Noise dominated (detector-on time) | Marked lightcurve |
|---|---|---|---|---|---|---|---|
| A | 7337 | 6418 | 3 | 3 | 0.04% | 0.05% | 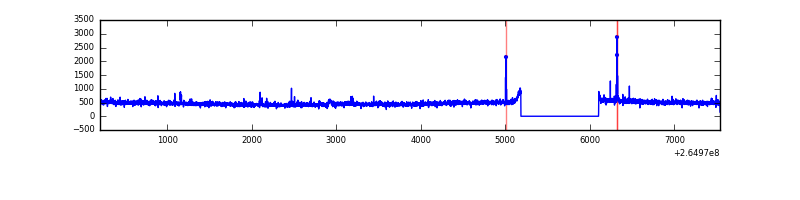 |
| B | 7337 | 6417 | 55 | 55 | 0.75% | 0.86% | 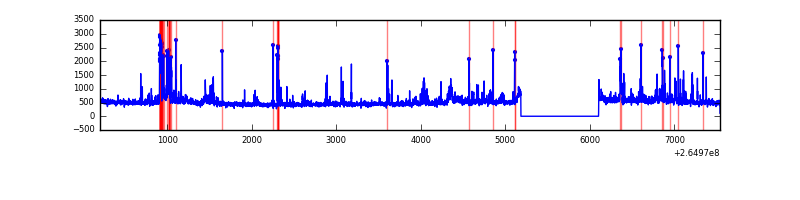 |
| C | 7337 | 6417 | 2 | 2 | 0.03% | 0.03% | 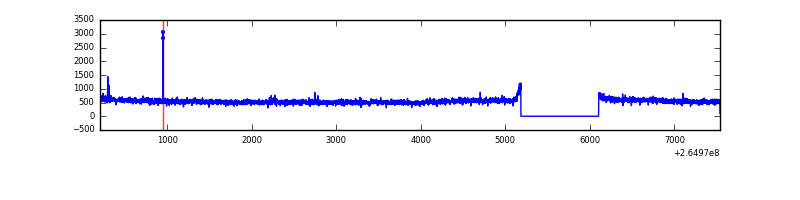 |
| D | 7337 | 6417 | 250 | 250 | 3.41% | 3.90% | 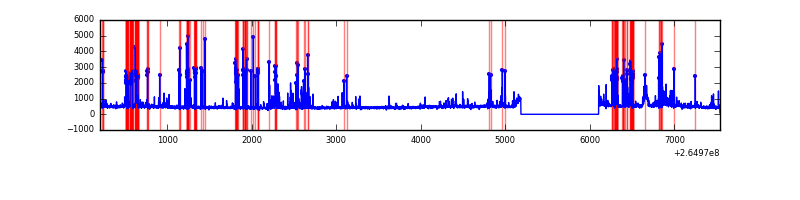 |
Top three noisy pixels from each quadrant. If the there are fewer than three noisy pixels in the level2.evt file, extra rows are filled as -1
| Pixel properties | Quadrant properties | ||||||
|---|---|---|---|---|---|---|---|
| Quadrant | DetID | PixID | Counts | Sigma | Mean | Median | Sigma |
| A | 12 | 189 | 44203 | 272.68 | 776 | 759 | 159.3 |
| A | 15 | 69 | 17031 | 102.13 | 776 | 759 | 159.3 |
| A | 8 | 15 | 8193 | 46.66 | 776 | 759 | 159.3 |
| B | 0 | 182 | 207063 | 1381.9 | 769 | 751 | 149.3 |
| B | 0 | 229 | 199700 | 1332.58 | 769 | 751 | 149.3 |
| B | 0 | 245 | 48700 | 321.17 | 769 | 751 | 149.3 |
| C | 3 | 233 | 551022 | 3143.89 | 747 | 751 | 175.0 |
| C | 10 | 22 | 10641 | 56.5 | 747 | 751 | 175.0 |
| C | 13 | 61 | 5316 | 26.08 | 747 | 751 | 175.0 |
| D | 1 | 52 | 815404 | 4672.62 | 728 | 711 | 174.4 |
| D | 2 | 120 | 185843 | 1061.81 | 728 | 711 | 174.4 |
| D | 10 | 172 | 57818 | 327.53 | 728 | 711 | 174.4 |
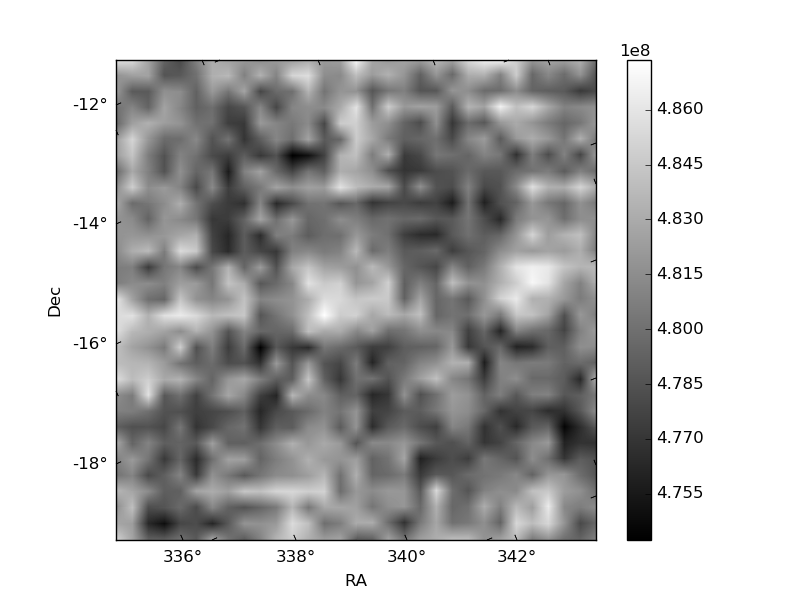
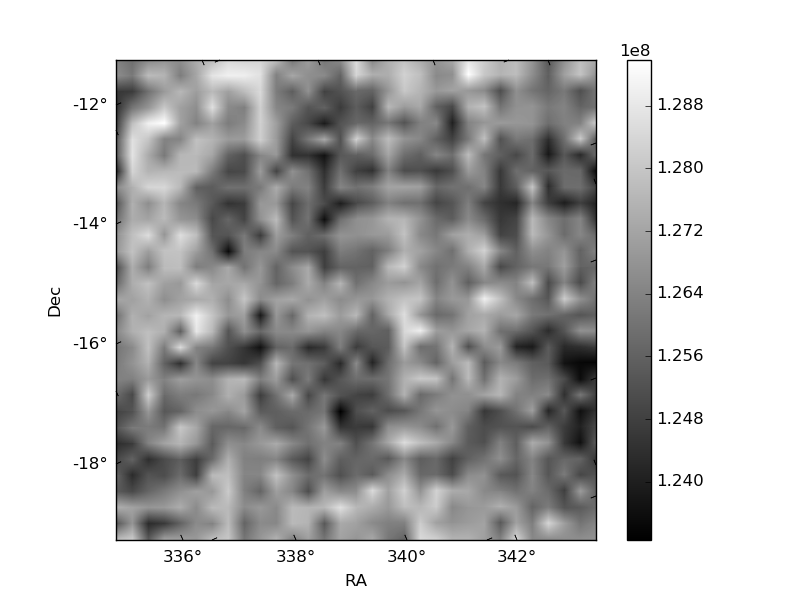
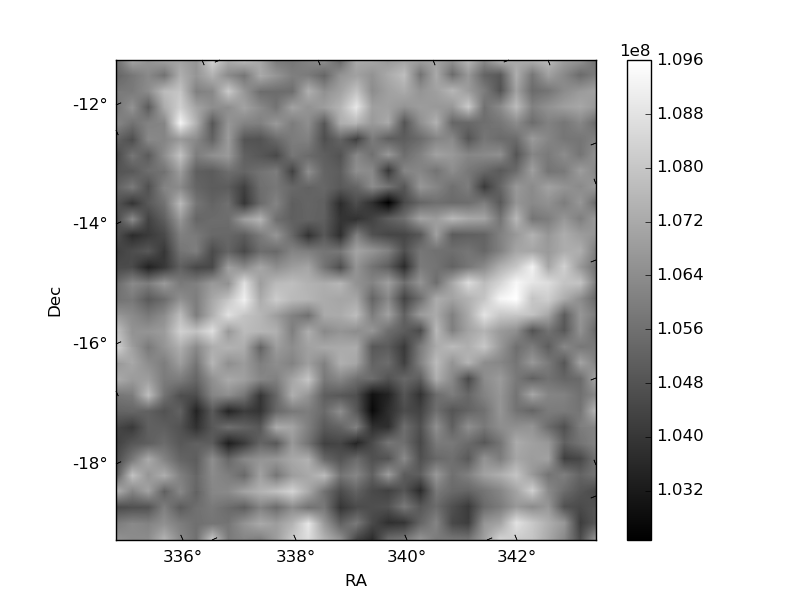
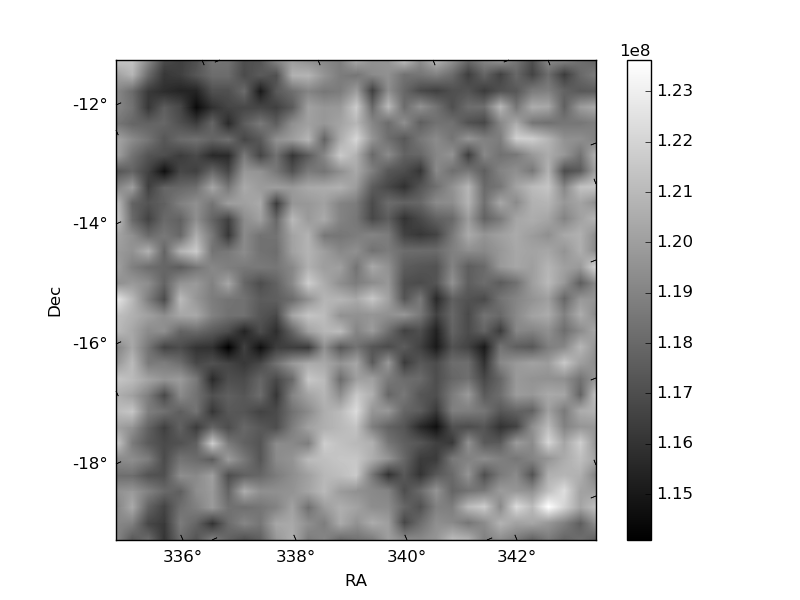
Histogram calculated using DETX and DETY for each event in the final _common_clean file
| Quadrant A | 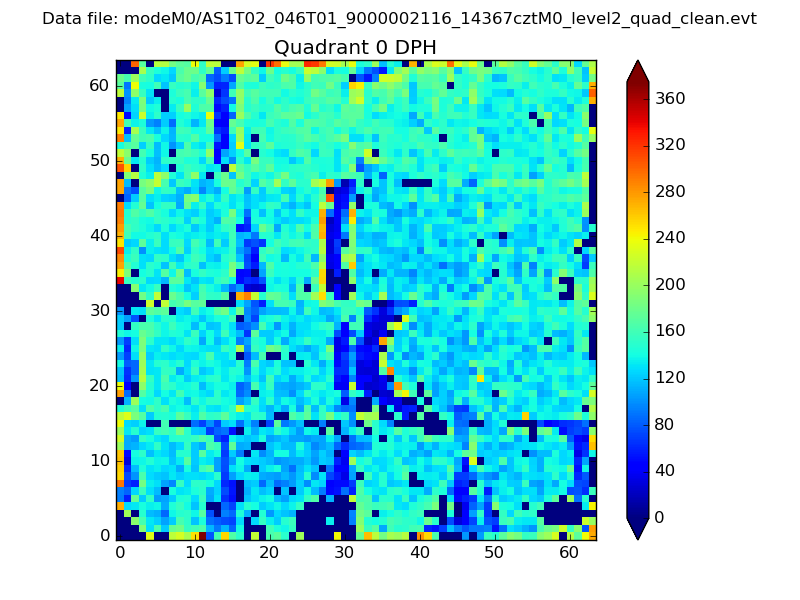 |
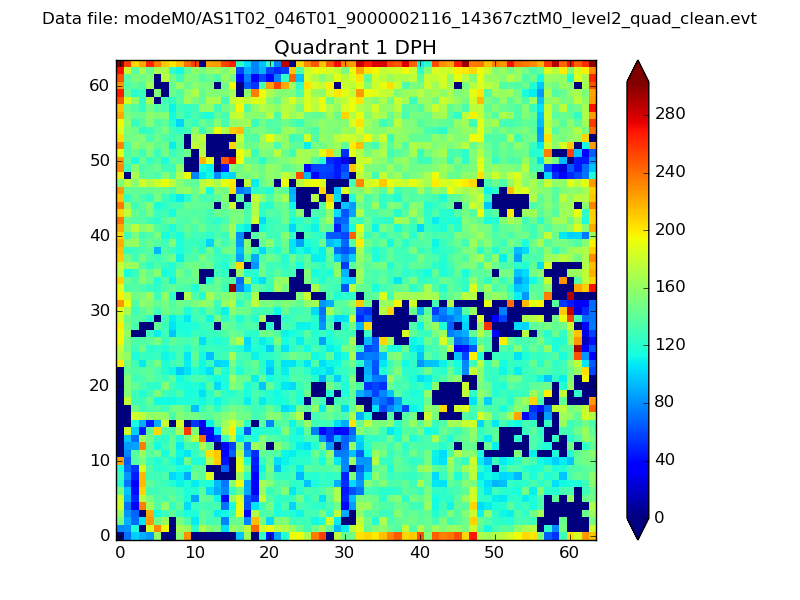 |
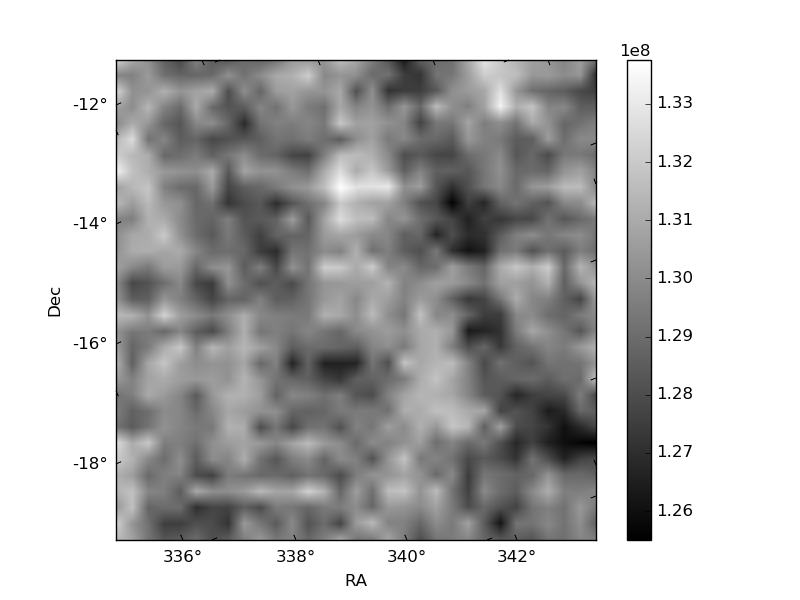
Quadrant B |
|---|---|---|---|
| Quadrant D | 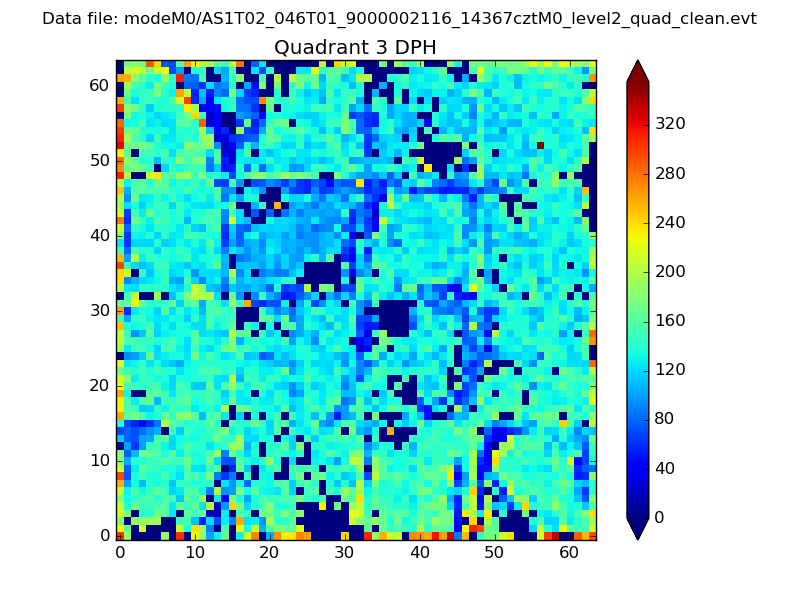 |
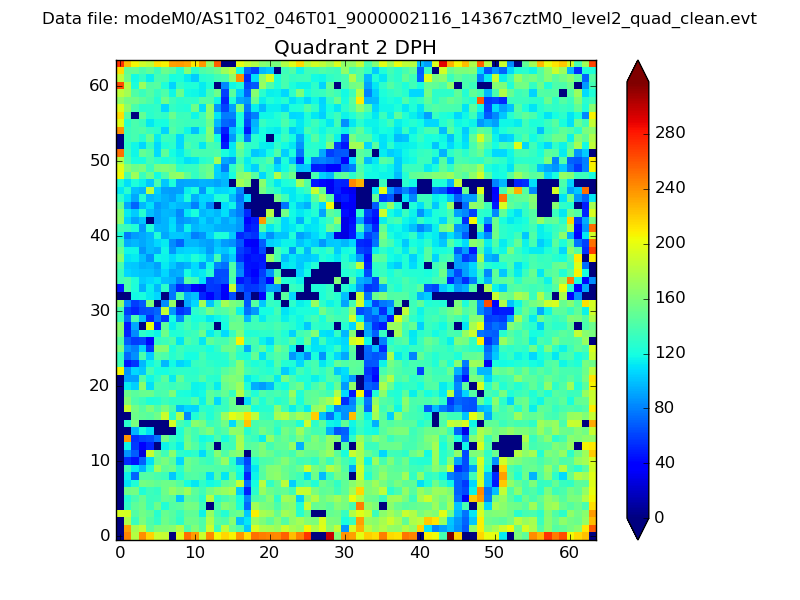 |
Quadrant C |
| Plot type | Count rate plots | Images |
|---|---|---|
| Comparison with Poisson distribution Blue bars denote a histogram of data divided into 1 sec bins. Red curve is a Poisson curve with rate = median count rate of data. |
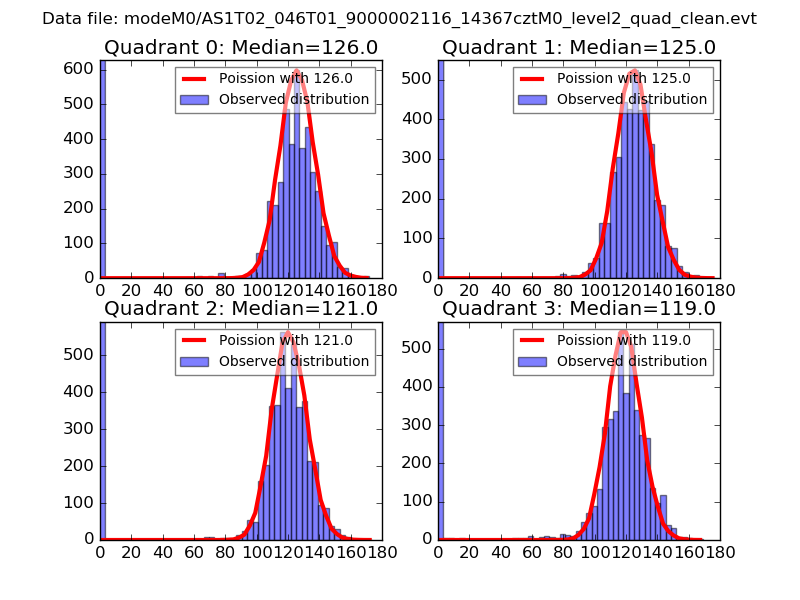 |
 |
| Quadrant-wise count rates Data is divided into 100 sec bins |
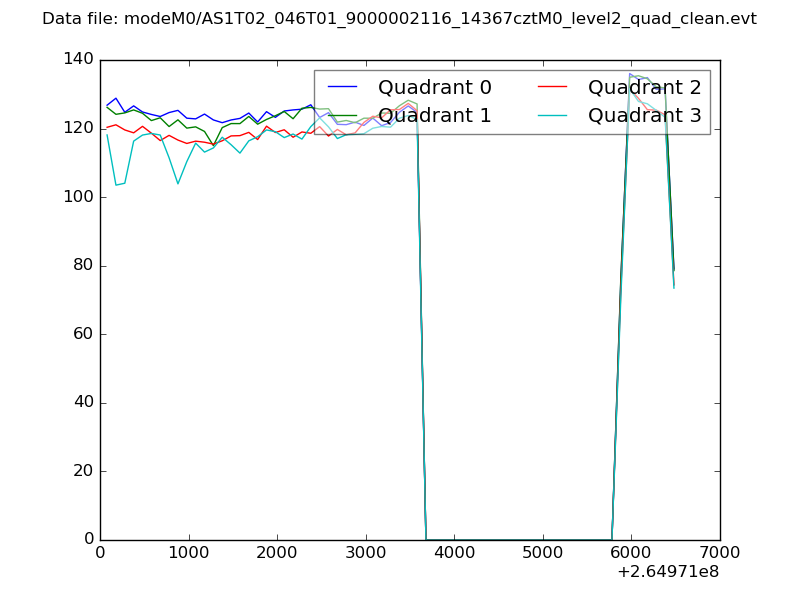 |
|
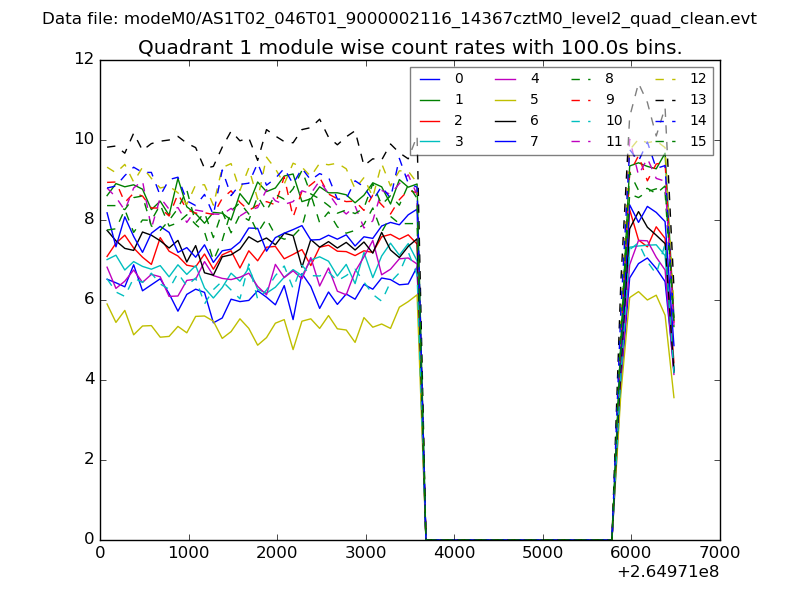
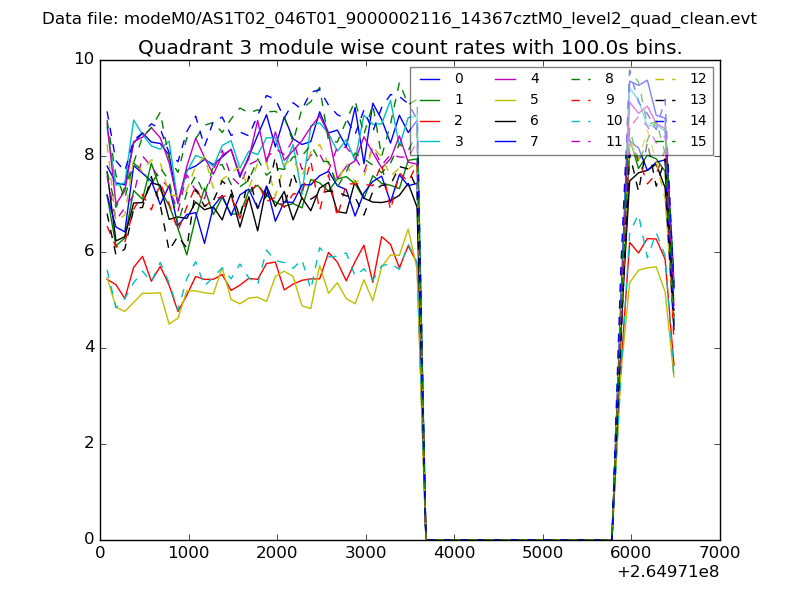
| Module-wise count rates for Quadrant A Data is divided into 100 sec bins |
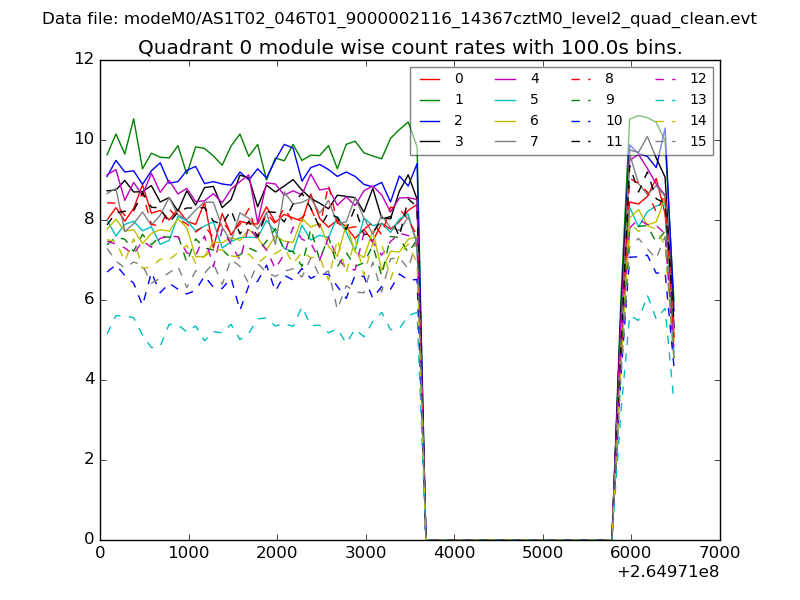 |
 |
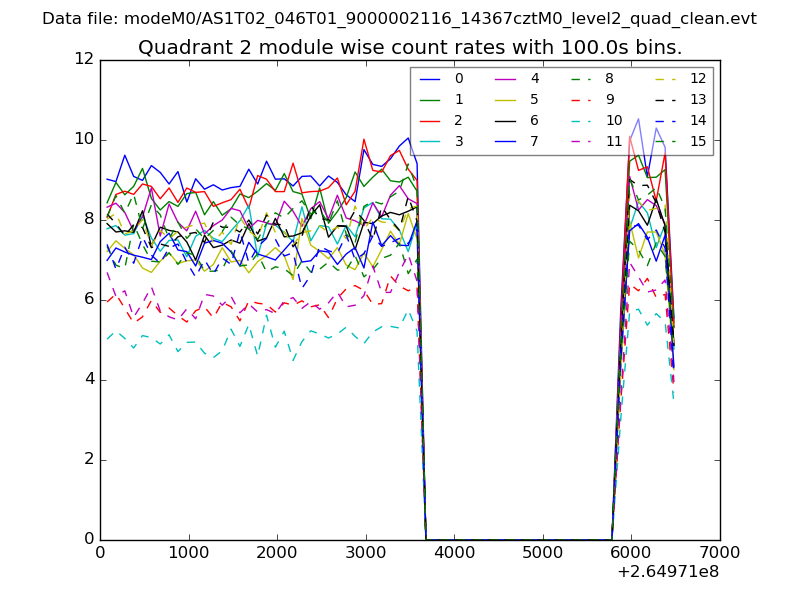
| Module-wise count rates for Quadrant B Data is divided into 100 sec bins |
 |
 |
| Module-wise count rates for Quadrant C Data is divided into 100 sec bins |
 |
 |
| Module-wise count rates for Quadrant D Data is divided into 100 sec bins |
 |
 |
| Parameter | Plot |
|---|---|
| CZT HV Monitor | 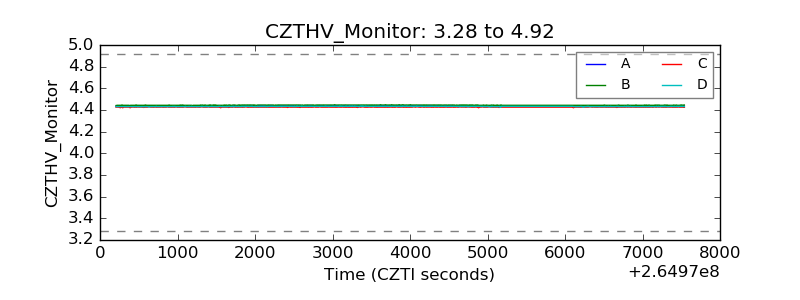 |
| D_VDD | 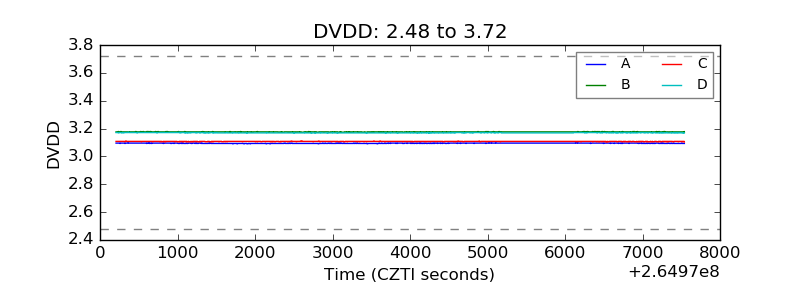 |
| Temperature 1 | 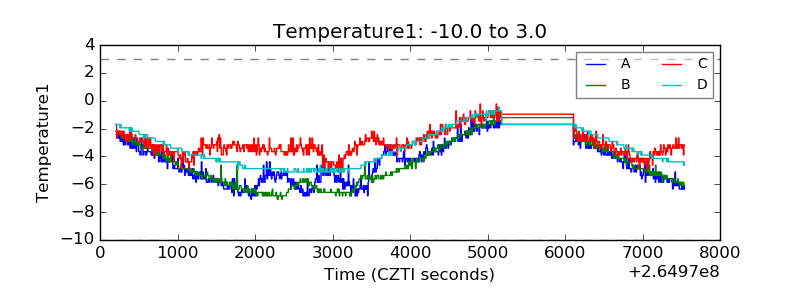 |
| Veto HV Monitor | 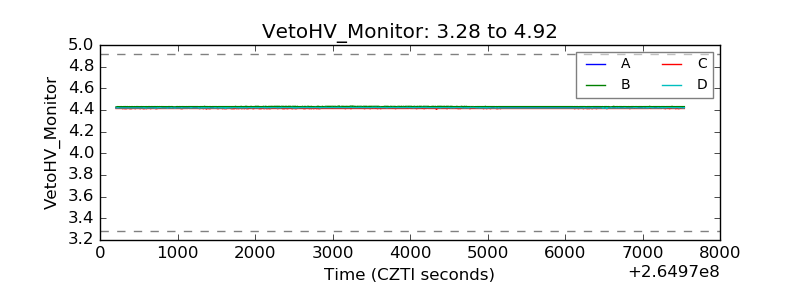 |
| Veto LLD | 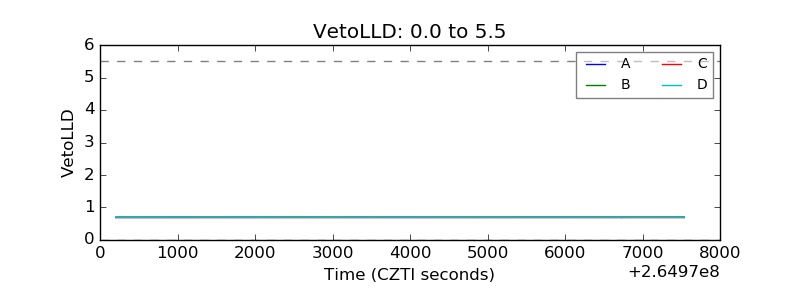 |
| Alpha Counter | 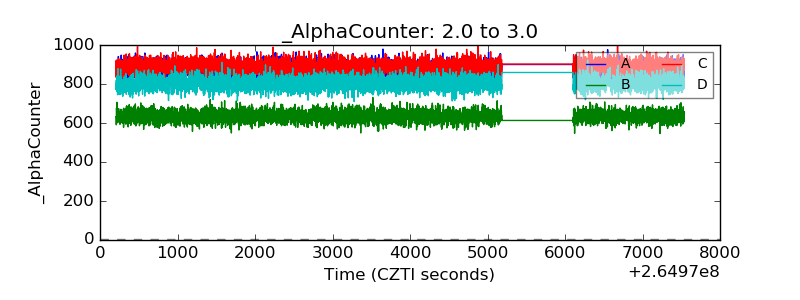 |
| _CPM_Rate | 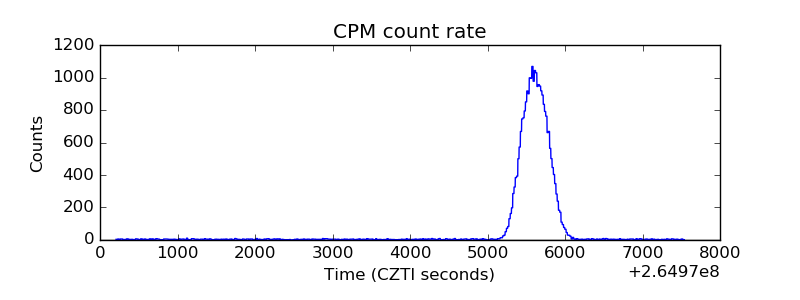 |
| CZT Counter | 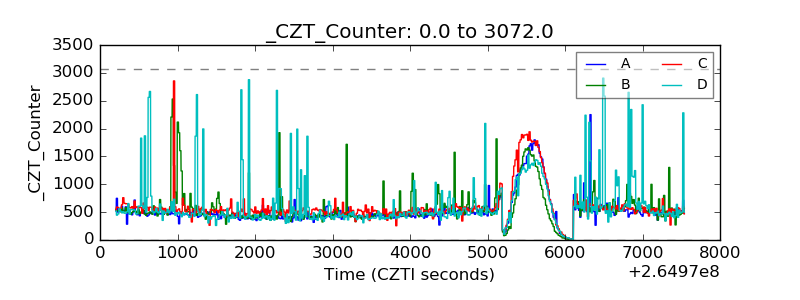 |
| +2.5 Volts monitor |  |
| +5 Volts monitor |  |
| _ROLL_ROT | 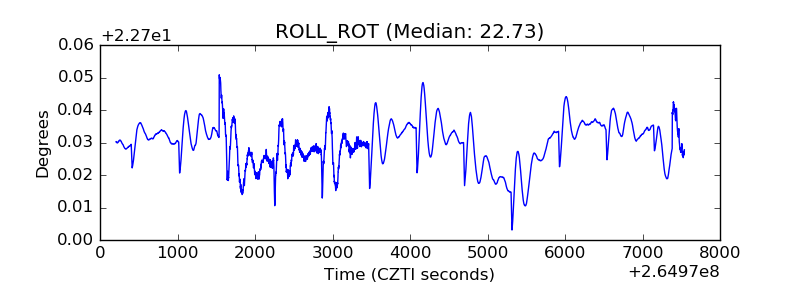 |
| _Roll_DEC | 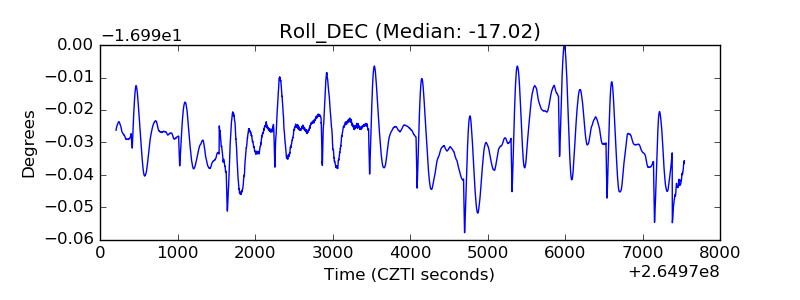 |
| _Roll_RA |  |
| Veto Counter | 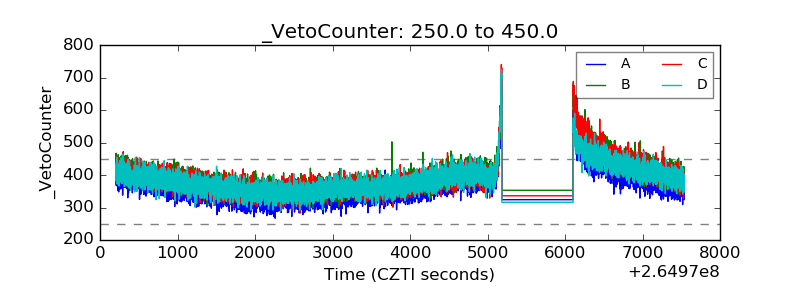 |