| Param | Original file | Final file |
|---|---|---|
| Filename | modeM0/AS1T02_046T01_9000002116_14368cztM0_level2.evt | modeM0/AS1T02_046T01_9000002116_14368cztM0_level2_quad_clean.evt |
| Size (bytes) | 141,220,800 | 20,733,120 |
| Size | 134.7 MB | 19.8 MB |
| Events in quadrant A | 914,152 | 127,035 |
| Events in quadrant B | 1,043,582 | 127,282 |
| Events in quadrant C | 990,425 | 121,442 |
| Events in quadrant D | 1,205,210 | 120,980 |
| Mode SS | |||
|---|---|---|---|
| Quadrant | BADHDUFLAG | Total packets | Discarded packets |
| A | 0 | 36 | 0 |
| B | 0 | 36 | 0 |
| C | 0 | 36 | 0 |
| D | 0 | 36 | 0 |
| Mode M0 | |||
|---|---|---|---|
| Quadrant | BADHDUFLAG | Total packets | Discarded packets |
| A | 0 | 3758 | 1 |
| B | 0 | 4231 | 1 |
| C | 0 | 4029 | 1 |
| D | 0 | 4774 | 1 |
| Quadrant | Total seconds | Saturated seconds | Saturation percentage |
|---|---|---|---|
| A | 1779 | 11 | 0.618325% |
| B | 1779 | 26 | 1.461495% |
| C | 1779 | 2 | 0.112423% |
| D | 1779 | 87 | 4.890388% |
Noise dominated data is calculated using 1-second bins in cleaned event files. If a bin has >2000 counts, and if more than 50% of those come from <1% of pixels, then it is considered to be noise-dominated and hence unusable.
| Quadrant | # 1 sec bins | Bins with >0 counts | Bins with >2000 counts | High rate bins dominated by noise | Noise dominated (total time) | Noise dominated (detector-on time) | Marked lightcurve |
|---|---|---|---|---|---|---|---|
| A | 1780 | 1780 | 2 | 2 | 0.11% | 0.11% | 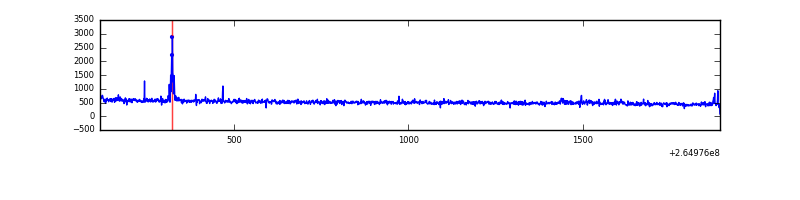 |
| B | 1780 | 1780 | 8 | 8 | 0.45% | 0.45% | 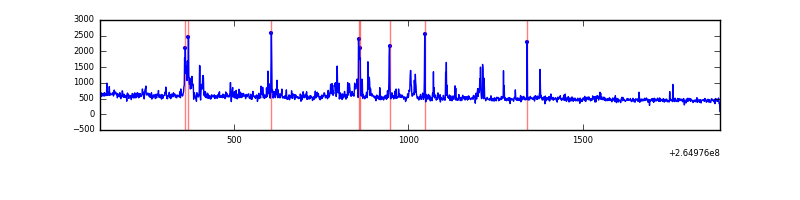 |
| C | 1780 | 1780 | 0 | 0 | 0.00% | 0.00% | 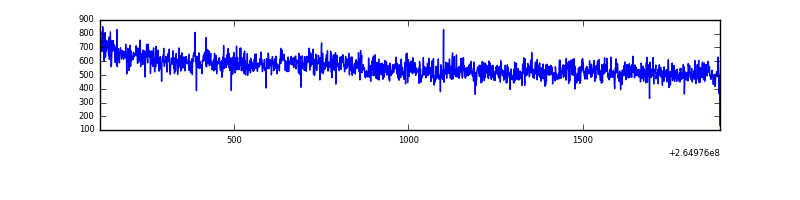 |
| D | 1780 | 1780 | 73 | 73 | 4.10% | 4.10% | 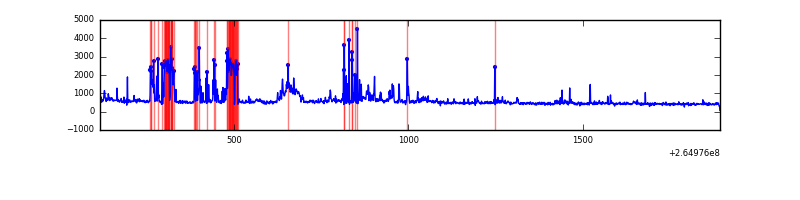 |
Top three noisy pixels from each quadrant. If the there are fewer than three noisy pixels in the level2.evt file, extra rows are filled as -1
| Pixel properties | Quadrant properties | ||||||
|---|---|---|---|---|---|---|---|
| Quadrant | DetID | PixID | Counts | Sigma | Mean | Median | Sigma |
| A | 15 | 69 | 16570 | 335.15 | 228 | 224 | 48.8 |
| A | 12 | 189 | 9351 | 187.13 | 228 | 224 | 48.8 |
| A | 8 | 15 | 3587 | 68.95 | 228 | 224 | 48.8 |
| B | 0 | 229 | 51316 | 1121.38 | 228 | 222 | 45.6 |
| B | 0 | 182 | 48252 | 1054.14 | 228 | 222 | 45.6 |
| B | 0 | 190 | 27065 | 589.14 | 228 | 222 | 45.6 |
| C | 3 | 233 | 131508 | 2461.01 | 220 | 221 | 53.3 |
| C | 13 | 61 | 1608 | 26.0 | 220 | 221 | 53.3 |
| C | 10 | 22 | 672 | 8.45 | 220 | 221 | 53.3 |
| D | 1 | 52 | 296338 | 5618.61 | 214 | 208 | 52.7 |
| D | 10 | 172 | 51373 | 970.78 | 214 | 208 | 52.7 |
| D | 2 | 120 | 37164 | 701.18 | 214 | 208 | 52.7 |
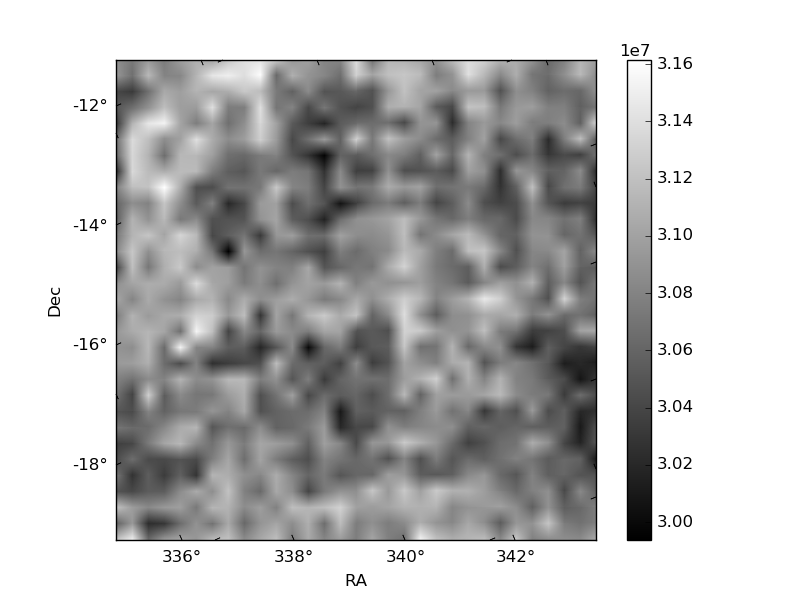
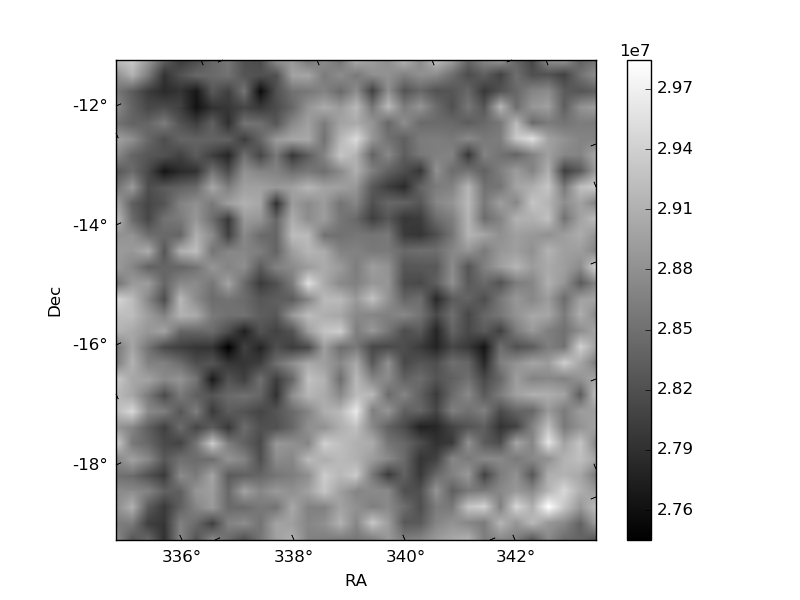
Histogram calculated using DETX and DETY for each event in the final _common_clean file
| Quadrant A | 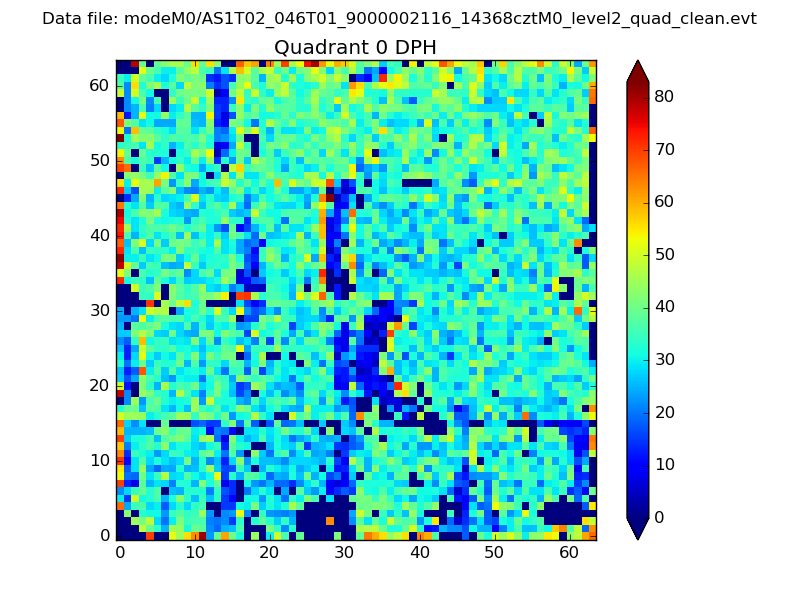 |
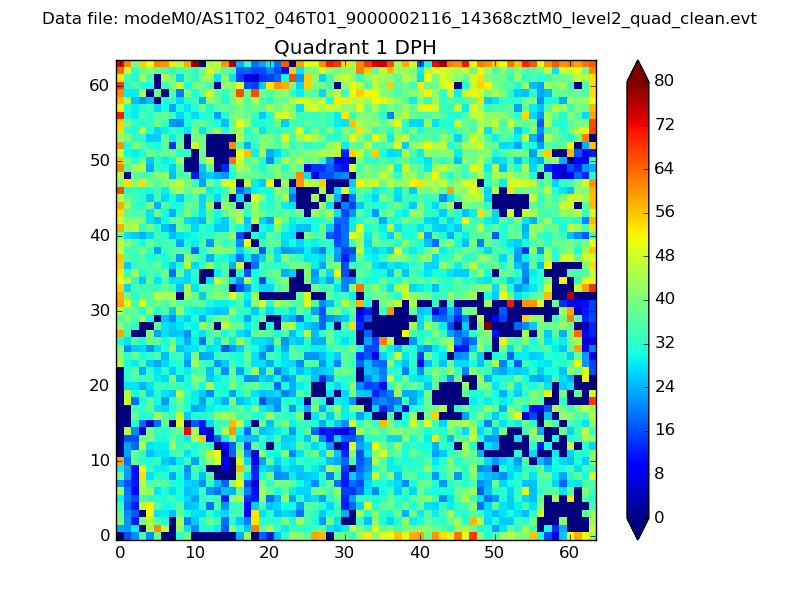 |
Quadrant B |
|---|---|---|---|
| Quadrant D |  |
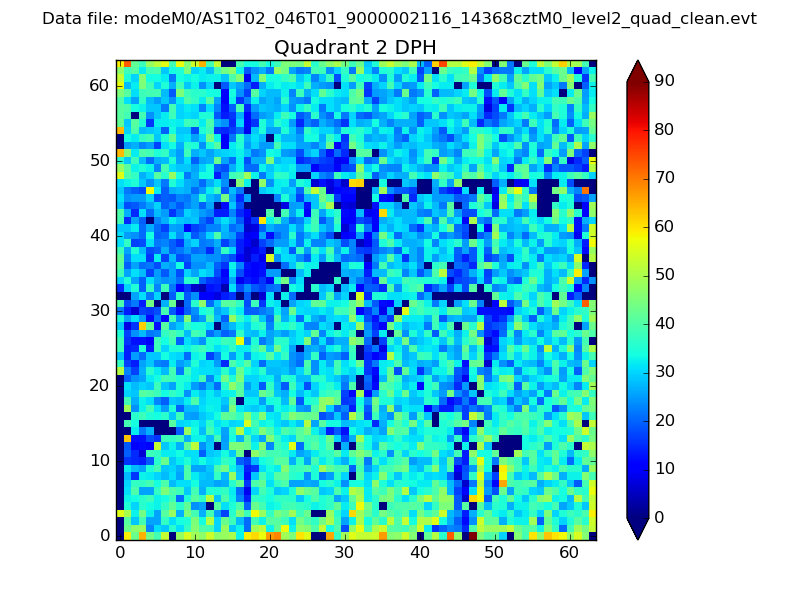 |
Quadrant C |
| Plot type | Count rate plots | Images |
|---|---|---|
| Comparison with Poisson distribution Blue bars denote a histogram of data divided into 1 sec bins. Red curve is a Poisson curve with rate = median count rate of data. |
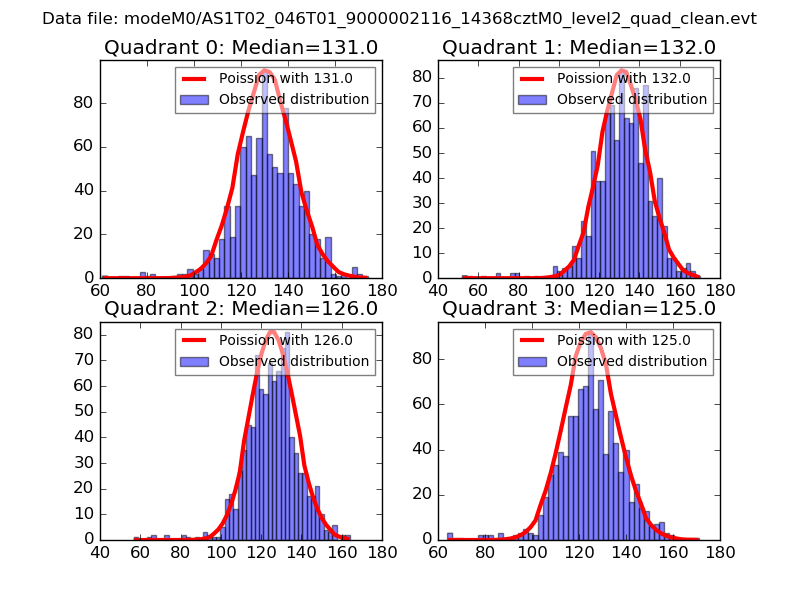 |
 |
| Quadrant-wise count rates Data is divided into 100 sec bins |
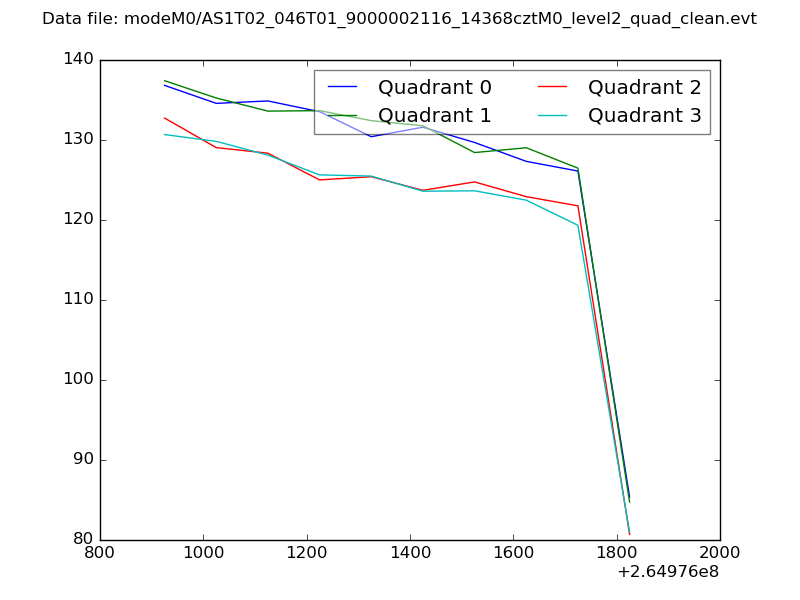 |
|
| Module-wise count rates for Quadrant A Data is divided into 100 sec bins |
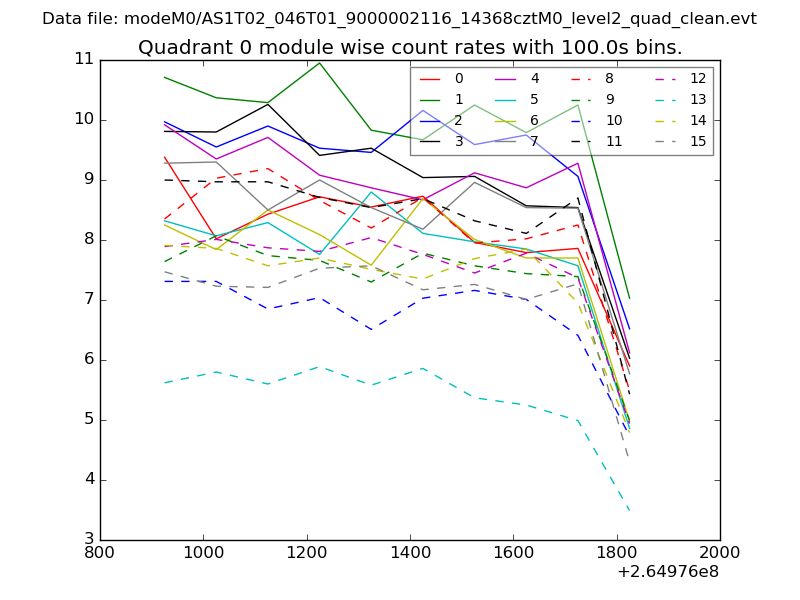 |
 |
| Module-wise count rates for Quadrant B Data is divided into 100 sec bins |
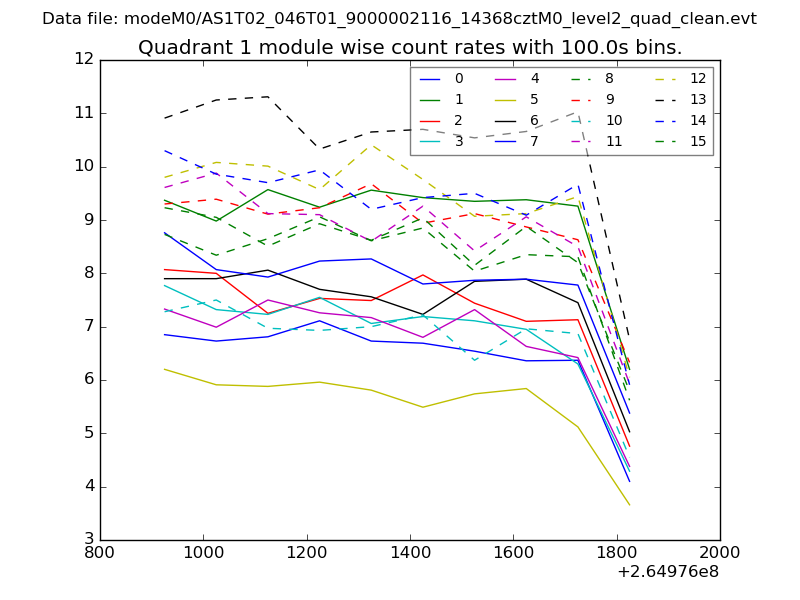 |
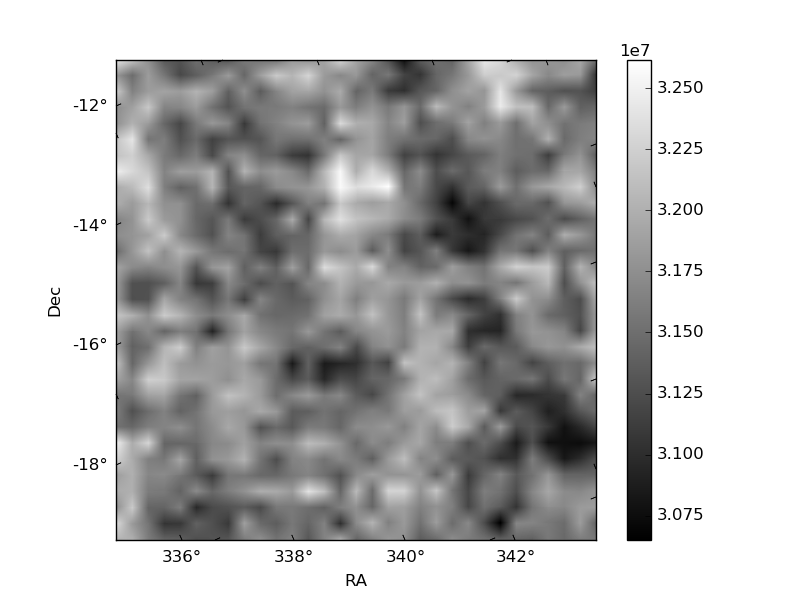 |
| Module-wise count rates for Quadrant C Data is divided into 100 sec bins |
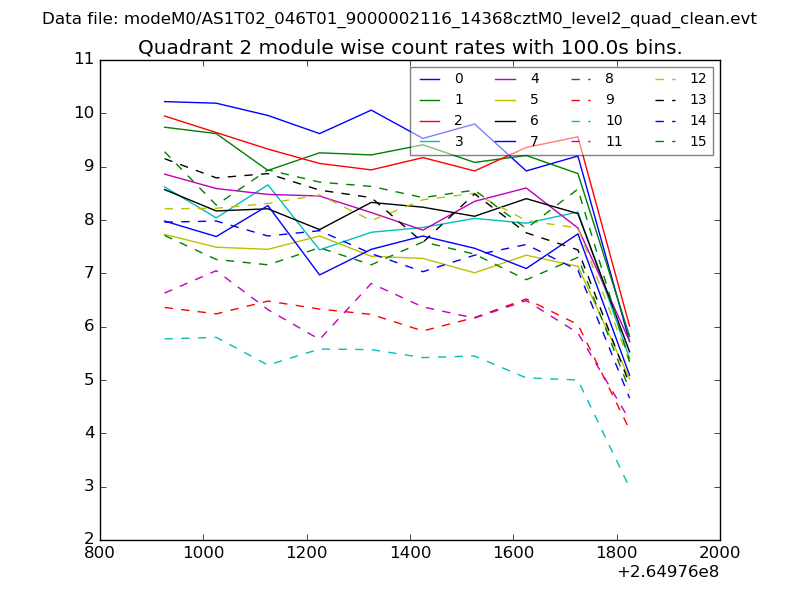 |
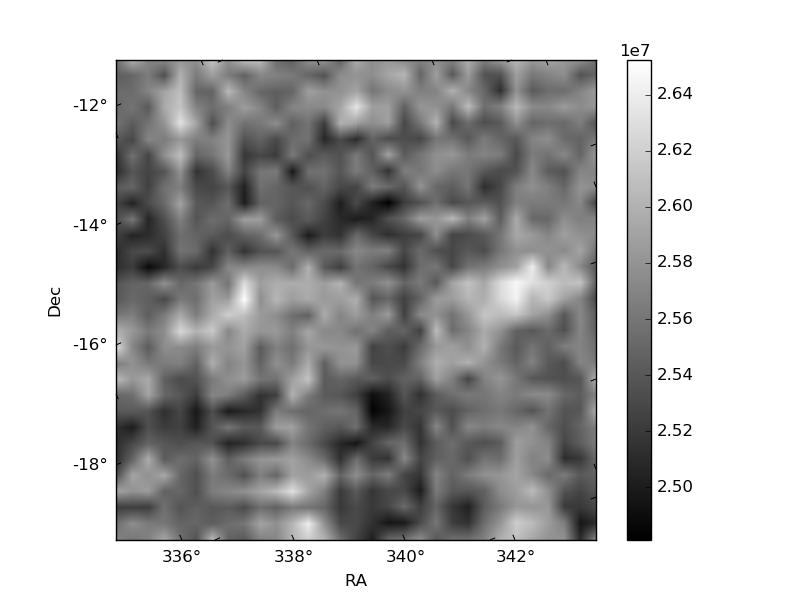 |
| Module-wise count rates for Quadrant D Data is divided into 100 sec bins |
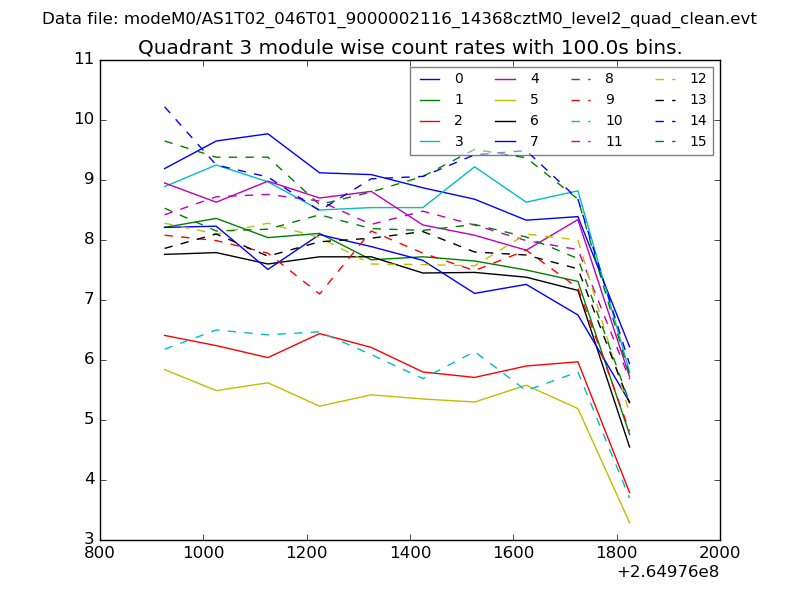 |
 |
| Parameter | Plot |
|---|---|
| CZT HV Monitor | 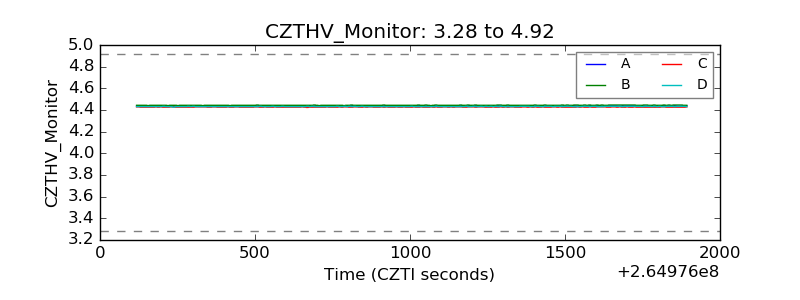 |
| D_VDD | 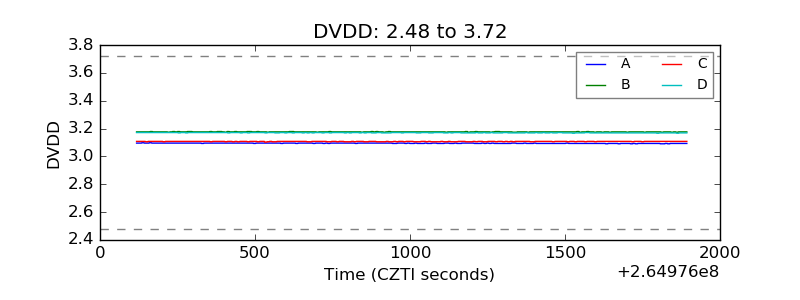 |
| Temperature 1 | 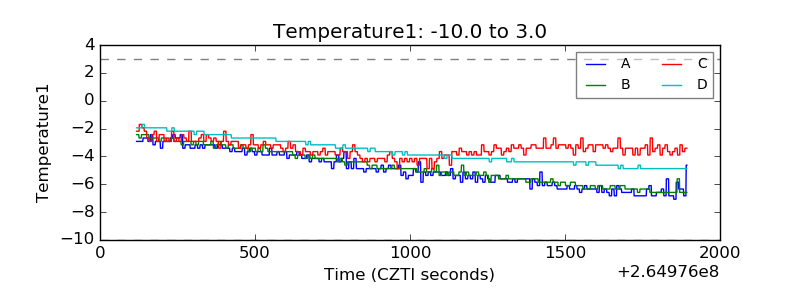 |
| Veto HV Monitor | 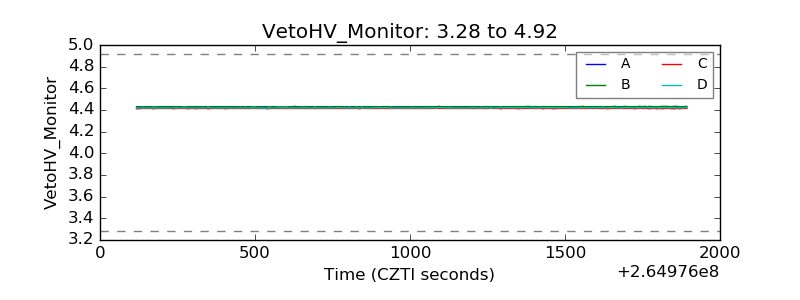 |
| Veto LLD | 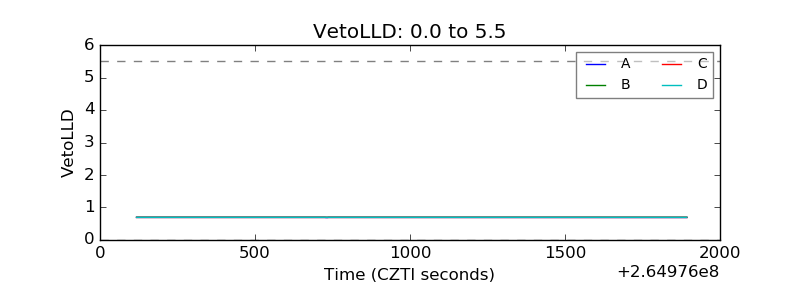 |
| Alpha Counter | 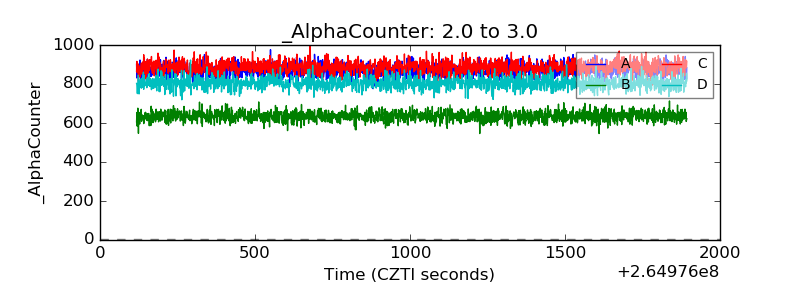 |
| _CPM_Rate | 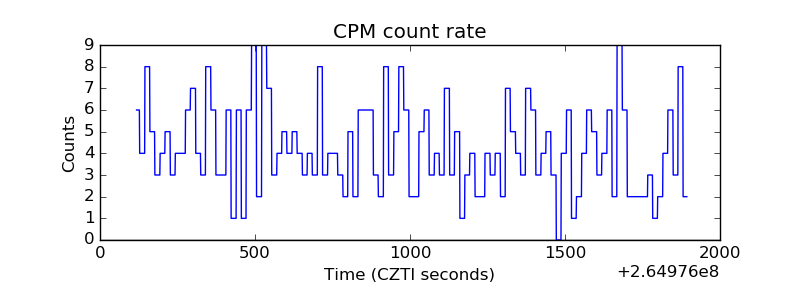 |
| CZT Counter | 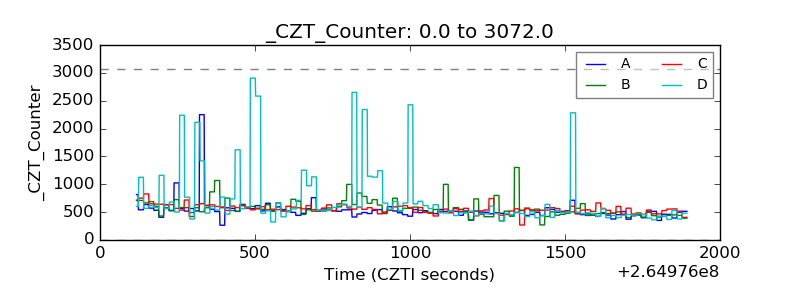 |
| +2.5 Volts monitor |  |
| +5 Volts monitor |  |
| _ROLL_ROT | 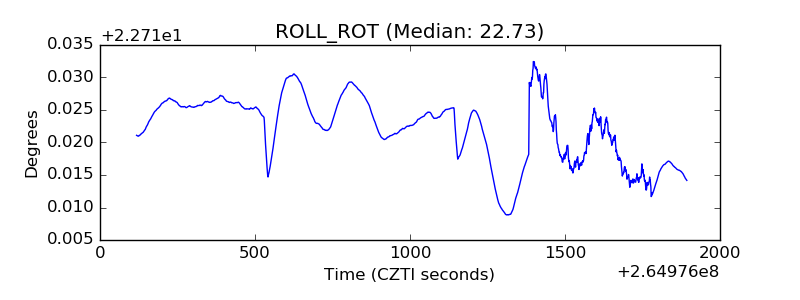 |
| _Roll_DEC | 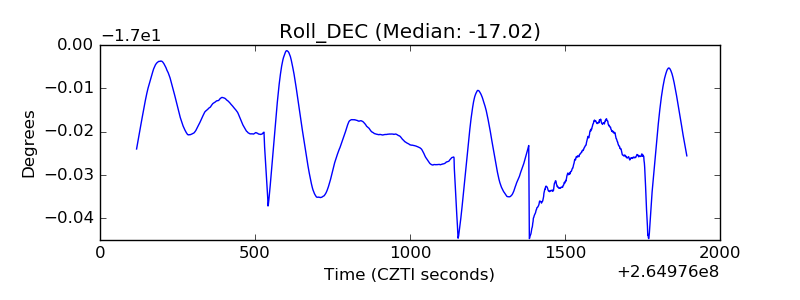 |
| _Roll_RA |  |
| Veto Counter | 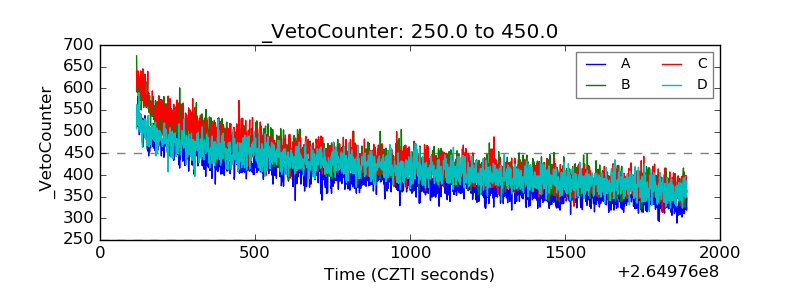 |