| Param | Original file | Final file |
|---|---|---|
| Filename | modeM0/AS1G08_075T01_9000002120cztM0_level2.fits | modeM0/AS1G08_075T01_9000002120cztM0_level2_quad_clean.evt |
| Size (bytes) | 376,090,560 | 285,068,160 |
| Size | 358.7 MB | 271.9 MB |
| Events in quadrant A | 2,348,170 | 1,622,222 |
| Events in quadrant B | 2,224,078 | 1,544,766 |
| Events in quadrant C | 2,285,424 | 1,494,766 |
| Events in quadrant D | 1,820,754 | 1,261,806 |
| Mode SS | |||
|---|---|---|---|
| Quadrant | BADHDUFLAG | Total packets | Discarded packets |
| A | 0 | 806 | 0 |
| B | 0 | 806 | 0 |
| C | 0 | 806 | 0 |
| D | 0 | 806 | 0 |
| Mode M0 | |||
|---|---|---|---|
| Quadrant | BADHDUFLAG | Total packets | Discarded packets |
| A | 0 | 82718 | 0 |
| B | 0 | 94408 | 0 |
| C | 0 | 92560 | 0 |
| D | 0 | 127961 | 0 |
| Mode M9 | |||
|---|---|---|---|
| Quadrant | BADHDUFLAG | Total packets | Discarded packets |
| A | 0 | 55 | 0 |
| B | 0 | 55 | 0 |
| C | 0 | 55 | 0 |
| D | 0 | 55 | 0 |
| Quadrant | Total seconds | Saturated seconds | Saturation percentage |
|---|---|---|---|
| A | 39426 | 815 | 2.067164% |
| B | 39426 | 1798 | 4.560442% |
| C | 39426 | 655 | 1.661340% |
| D | 39426 | 6067 | 15.388322% |
Noise dominated data is calculated using 1-second bins in cleaned event files. If a bin has >2000 counts, and if more than 50% of those come from <1% of pixels, then it is considered to be noise-dominated and hence unusable.
| Quadrant | # 1 sec bins | Bins with >0 counts | Bins with >2000 counts | High rate bins dominated by noise | Noise dominated (total time) | Noise dominated (detector-on time) | Marked lightcurve |
|---|---|---|---|---|---|---|---|
| A | 56148 | 39422 | 0 | 0 | 0.00% | 0.00% | 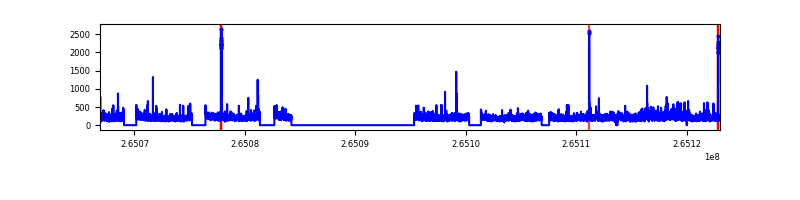 |
| B | 56148 | 39421 | 0 | 0 | 0.00% | 0.00% | 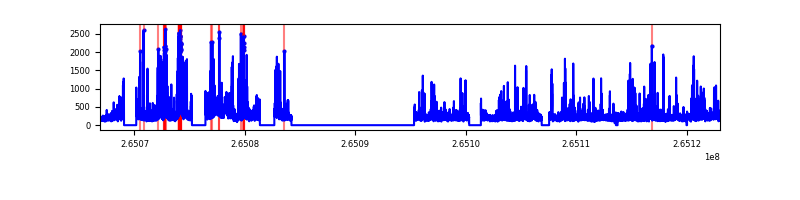 |
| C | 56148 | 39424 | 0 | 0 | 0.00% | 0.00% |  |
| D | 56148 | 39226 | 0 | 0 | 0.00% | 0.00% | 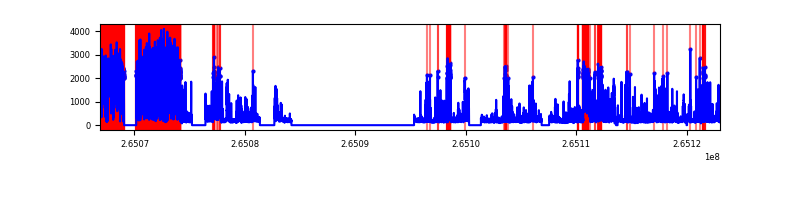 |
Top three noisy pixels from each quadrant. If the there are fewer than three noisy pixels in the level2.evt file, extra rows are filled as -1
| Pixel properties | Quadrant properties | ||||||
|---|---|---|---|---|---|---|---|
| Quadrant | DetID | PixID | Counts | Sigma | Mean | Median | Sigma |
| A | 0 | 29 | 2277 | 10.99 | 611 | 573 | 155.0 |
| A | 7 | 110 | 1916 | 8.66 | 611 | 573 | 155.0 |
| A | 0 | 30 | 1762 | 7.67 | 611 | 573 | 155.0 |
| B | 2 | 9 | 1887 | 11.28 | 587 | 560 | 117.7 |
| B | 3 | 80 | 1526 | 8.21 | 587 | 560 | 117.7 |
| B | 3 | 17 | 1462 | 7.66 | 587 | 560 | 117.7 |
| C | 1 | 81 | 1790 | 7.93 | 602 | 561 | 155.0 |
| C | 1 | 80 | 1761 | 7.74 | 602 | 561 | 155.0 |
| C | 12 | 241 | 1641 | 6.97 | 602 | 561 | 155.0 |
| D | 3 | 14 | 1366 | 6.4 | 519 | 472 | 139.6 |
| D | 6 | 231 | 1314 | 6.03 | 519 | 472 | 139.6 |
| D | 10 | 113 | 1285 | 5.82 | 519 | 472 | 139.6 |
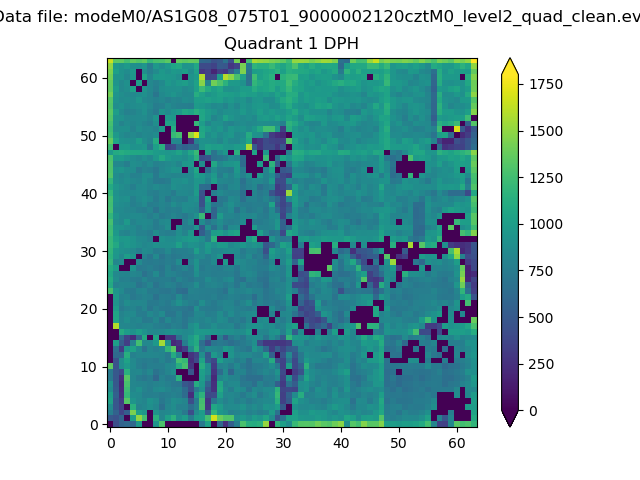
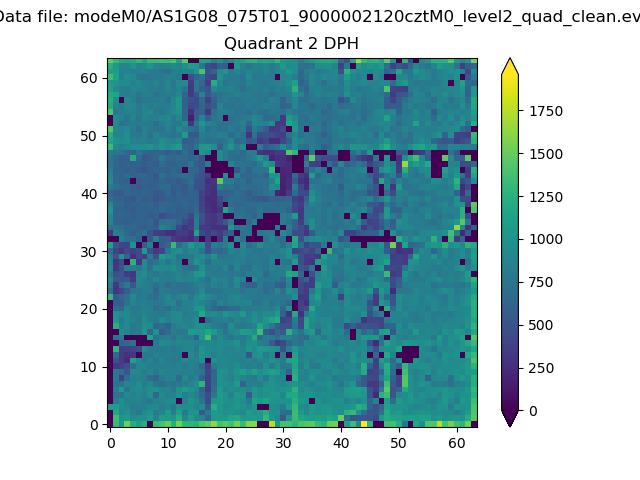
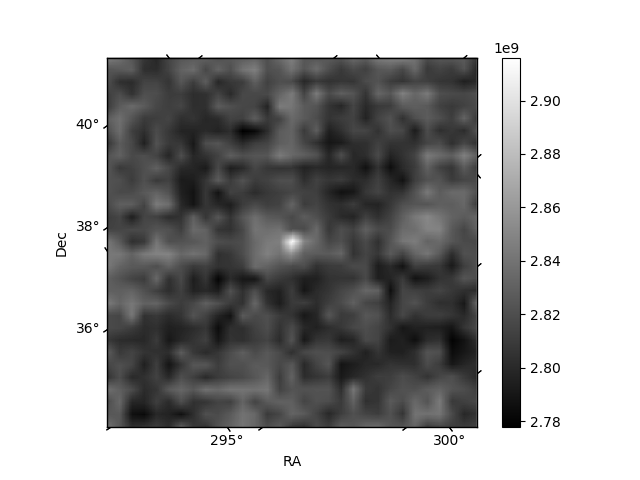
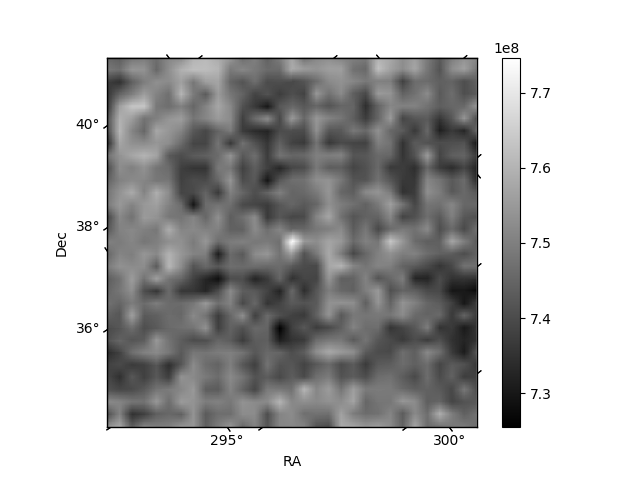
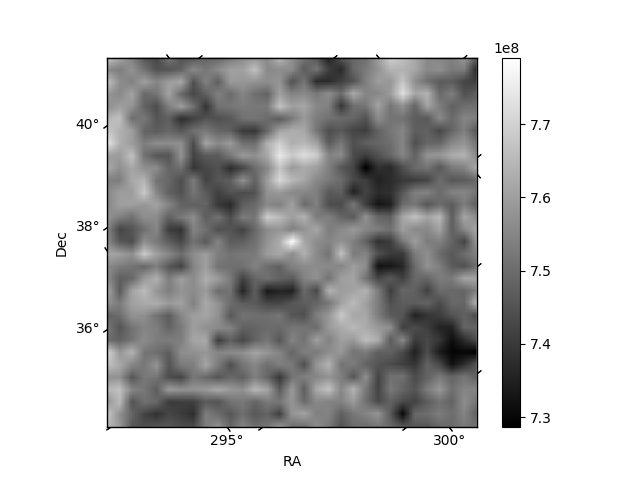
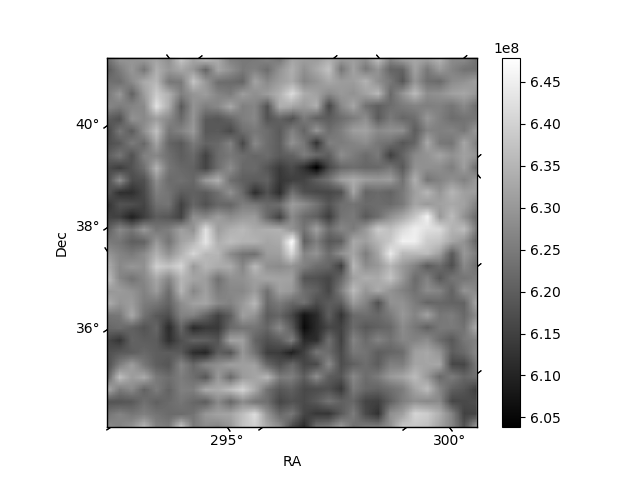
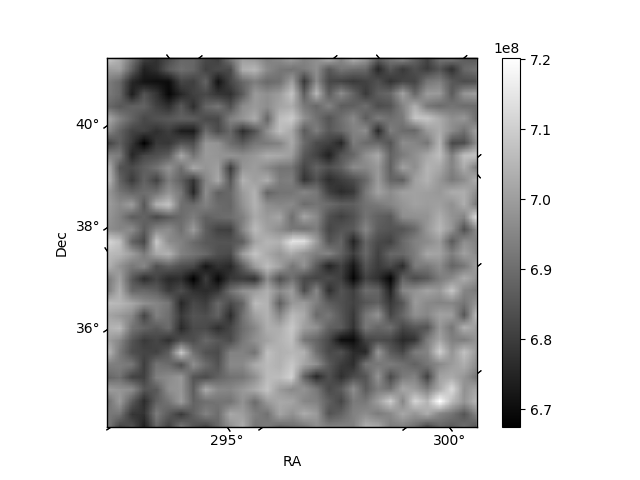
Histogram calculated using DETX and DETY for each event in the final _common_clean file
| Quadrant A | 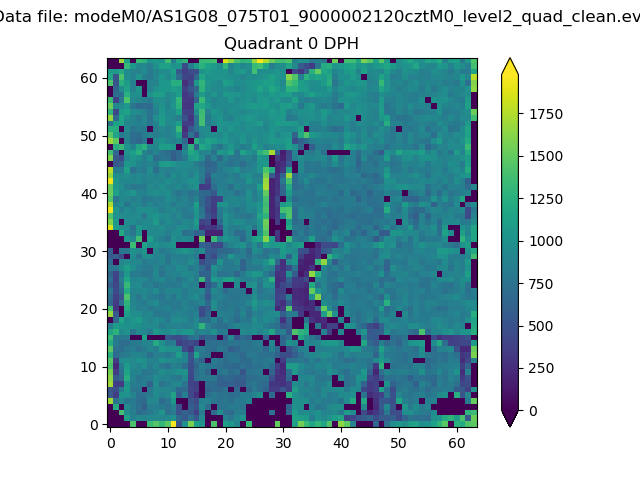 |
 |
Quadrant B |
|---|---|---|---|
| Quadrant D | 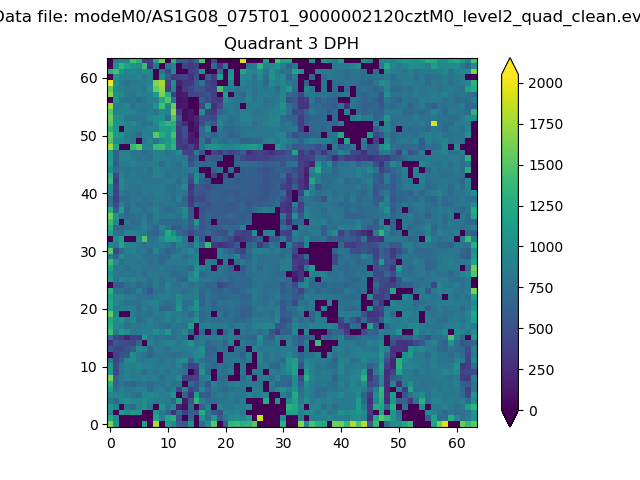 |
 |
Quadrant C |
| Plot type | Count rate plots | Images |
|---|---|---|
| Comparison with Poisson distribution Blue bars denote a histogram of data divided into 1 sec bins. Red curve is a Poisson curve with rate = median count rate of data. |
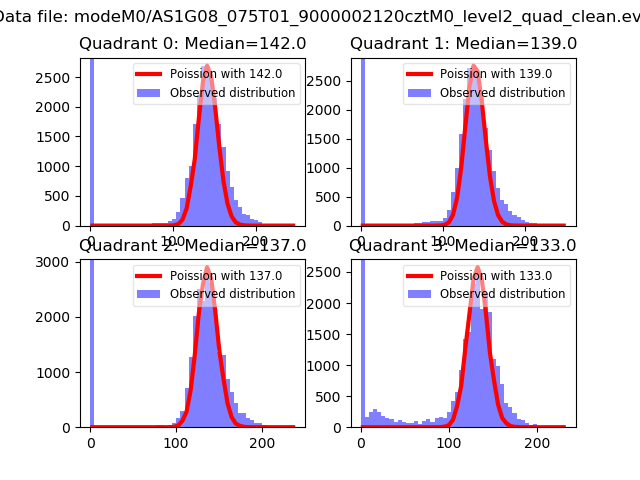 |
 |
| Quadrant-wise count rates Data is divided into 100 sec bins |
 |
|
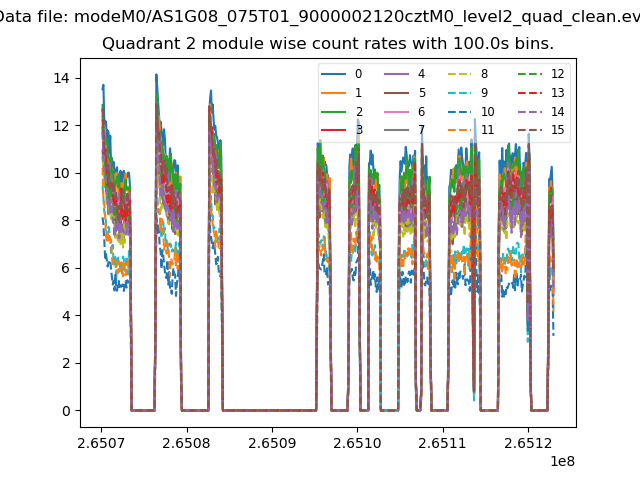
| Module-wise count rates for Quadrant A Data is divided into 100 sec bins |
 |
 |
| Module-wise count rates for Quadrant B Data is divided into 100 sec bins |
 |
 |
| Module-wise count rates for Quadrant C Data is divided into 100 sec bins |
 |
 |
| Module-wise count rates for Quadrant D Data is divided into 100 sec bins |
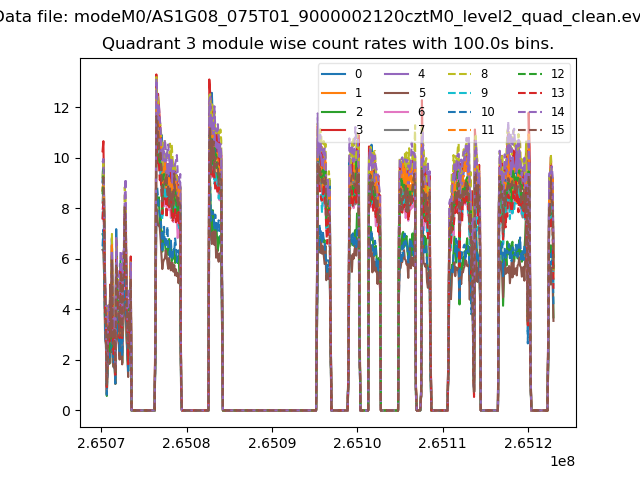 |
 |
| Parameter | Plot |
|---|---|
| CZT HV Monitor |  |
| D_VDD |  |
| Temperature 1 |  |
| Veto HV Monitor | 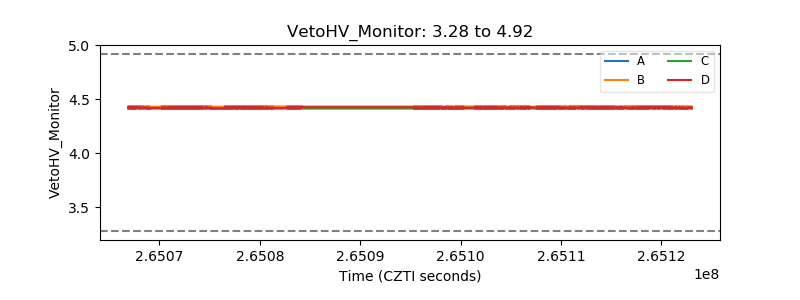 |
| Veto LLD | 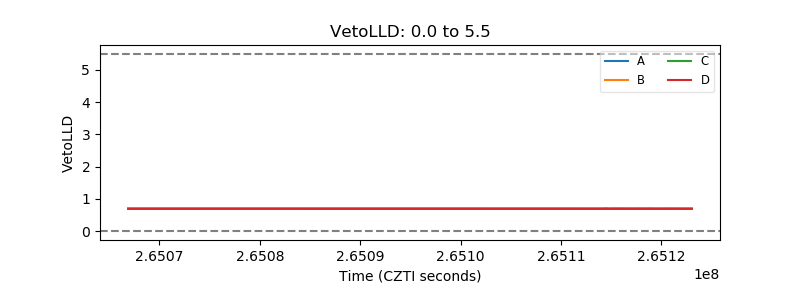 |
| Alpha Counter | 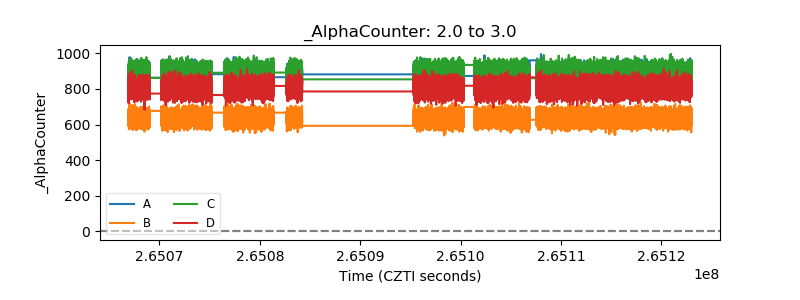 |
| _CPM_Rate | 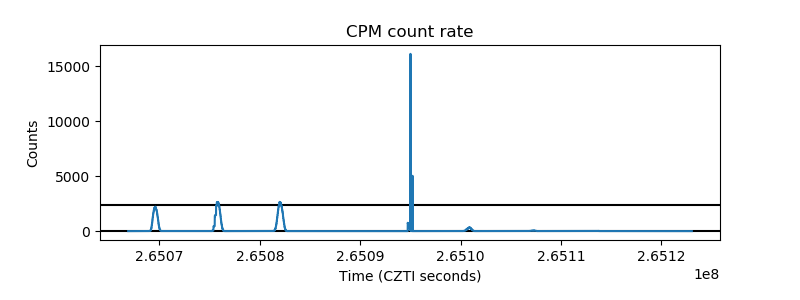 |
| CZT Counter |  |
| +2.5 Volts monitor |  |
| +5 Volts monitor | 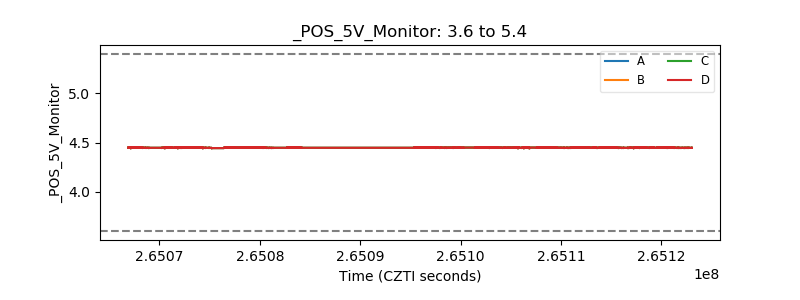 |
| _ROLL_ROT | 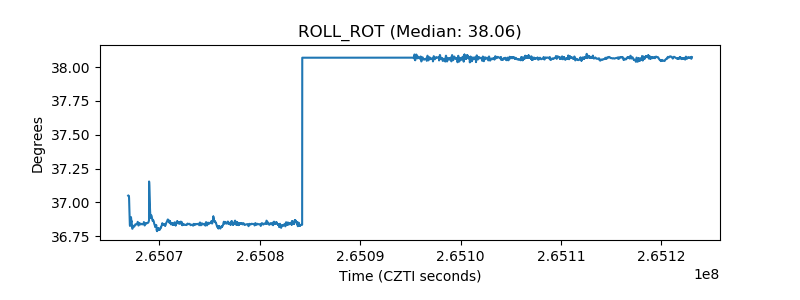 |
| _Roll_DEC | 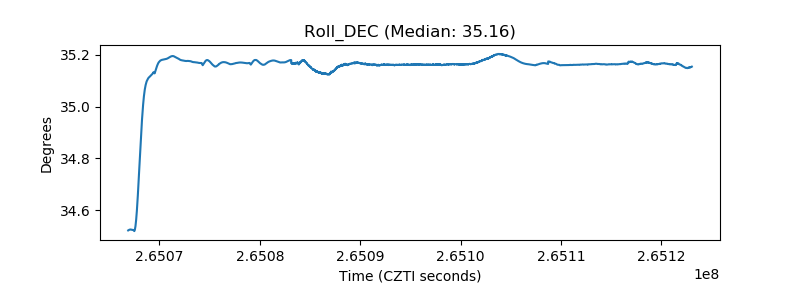 |
| _Roll_RA | 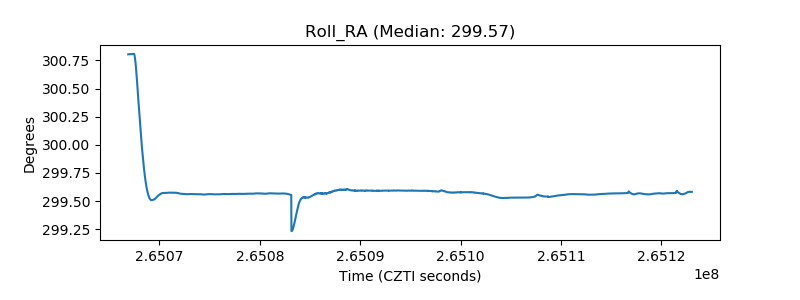 |
| Veto Counter | 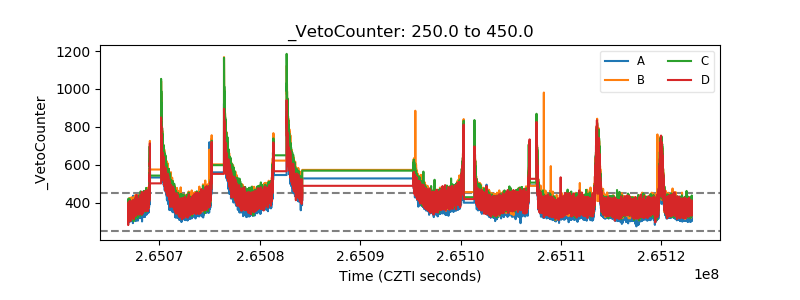 |