| Param | Original file | Final file |
|---|---|---|
| Filename | modeM0/AS1G08_075T01_9000002120_14386cztM0_level2.evt | modeM0/AS1G08_075T01_9000002120_14386cztM0_level2_quad_clean.evt |
| Size (bytes) | 527,670,720 | 104,048,640 |
| Size | 503.2 MB | 99.2 MB |
| Events in quadrant A | 3,308,315 | 693,179 |
| Events in quadrant B | 4,146,668 | 687,360 |
| Events in quadrant C | 4,043,282 | 669,122 |
| Events in quadrant D | 4,043,939 | 650,183 |
| Mode SS | |||
|---|---|---|---|
| Quadrant | BADHDUFLAG | Total packets | Discarded packets |
| A | 0 | 132 | 0 |
| B | 0 | 132 | 0 |
| C | 0 | 132 | 0 |
| D | 0 | 132 | 0 |
| Mode M0 | |||
|---|---|---|---|
| Quadrant | BADHDUFLAG | Total packets | Discarded packets |
| A | 0 | 13898 | 3 |
| B | 0 | 16670 | 2 |
| C | 0 | 16610 | 2 |
| D | 0 | 16445 | 2 |
| Mode M9 | |||
|---|---|---|---|
| Quadrant | BADHDUFLAG | Total packets | Discarded packets |
| A | 0 | 14 | 0 |
| B | 0 | 14 | 0 |
| C | 0 | 14 | 0 |
| D | 0 | 15 | 0 |
| Quadrant | Total seconds | Saturated seconds | Saturation percentage |
|---|---|---|---|
| A | 6468 | 55 | 0.850340% |
| B | 6468 | 144 | 2.226345% |
| C | 6468 | 31 | 0.479283% |
| D | 6468 | 99 | 1.530612% |
Noise dominated data is calculated using 1-second bins in cleaned event files. If a bin has >2000 counts, and if more than 50% of those come from <1% of pixels, then it is considered to be noise-dominated and hence unusable.
| Quadrant | # 1 sec bins | Bins with >0 counts | Bins with >2000 counts | High rate bins dominated by noise | Noise dominated (total time) | Noise dominated (detector-on time) | Marked lightcurve |
|---|---|---|---|---|---|---|---|
| A | 7784 | 6470 | 21 | 21 | 0.27% | 0.32% | 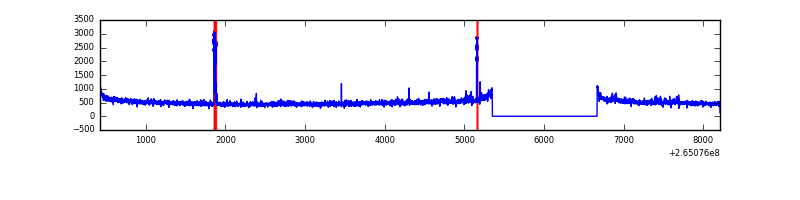 |
| B | 7784 | 6470 | 81 | 81 | 1.04% | 1.25% | 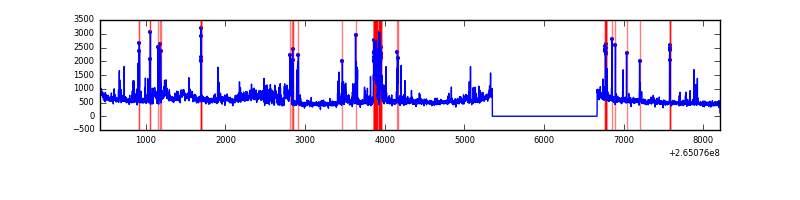 |
| C | 7784 | 6470 | 1 | 1 | 0.01% | 0.02% | 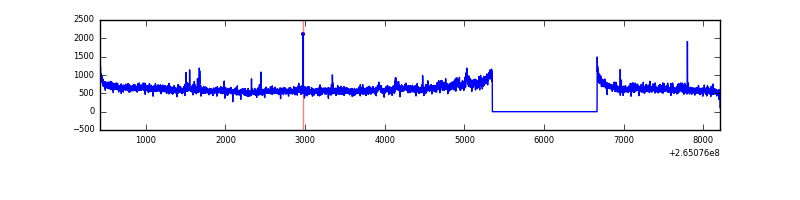 |
| D | 7784 | 6470 | 91 | 91 | 1.17% | 1.41% | 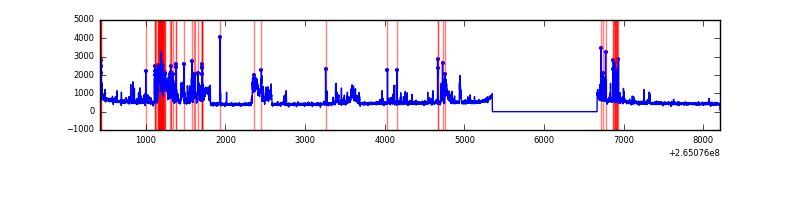 |
Top three noisy pixels from each quadrant. If the there are fewer than three noisy pixels in the level2.evt file, extra rows are filled as -1
| Pixel properties | Quadrant properties | ||||||
|---|---|---|---|---|---|---|---|
| Quadrant | DetID | PixID | Counts | Sigma | Mean | Median | Sigma |
| A | 8 | 15 | 55384 | 331.06 | 822 | 809 | 164.9 |
| A | 4 | 2 | 49490 | 295.3 | 822 | 809 | 164.9 |
| A | 15 | 69 | 25144 | 147.62 | 822 | 809 | 164.9 |
| B | 10 | 245 | 706545 | 4585.56 | 819 | 801 | 153.9 |
| B | 0 | 229 | 110062 | 709.92 | 819 | 801 | 153.9 |
| B | 4 | 173 | 102362 | 659.89 | 819 | 801 | 153.9 |
| C | 3 | 233 | 927084 | 5107.06 | 795 | 800 | 181.4 |
| C | 3 | 232 | 9518 | 48.07 | 795 | 800 | 181.4 |
| C | 14 | 234 | 6363 | 30.67 | 795 | 800 | 181.4 |
| D | 12 | 110 | 803282 | 3991.16 | 782 | 763 | 201.1 |
| D | 2 | 120 | 190586 | 944.04 | 782 | 763 | 201.1 |
| D | 10 | 199 | 32000 | 155.35 | 782 | 763 | 201.1 |
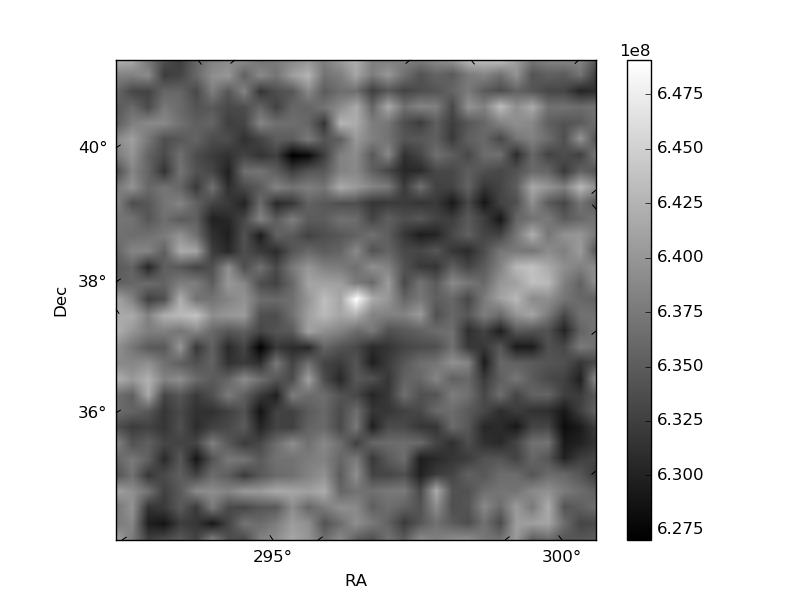
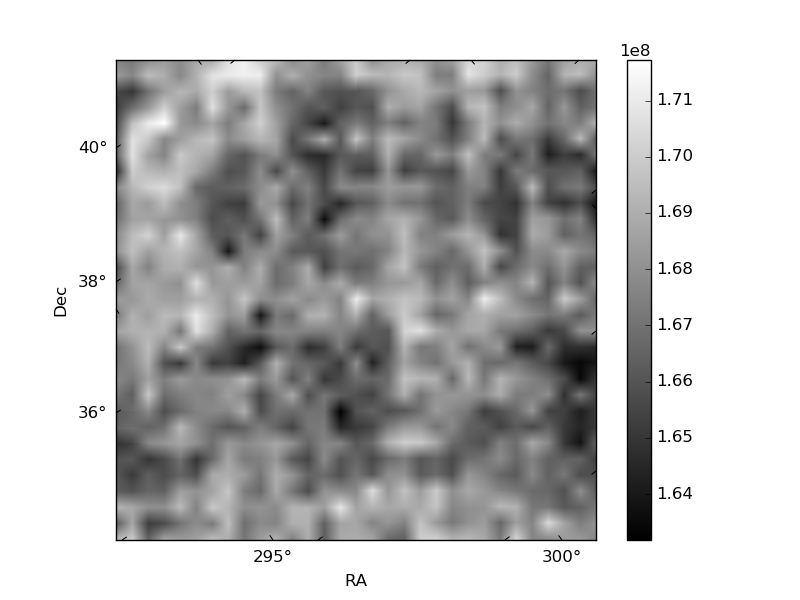
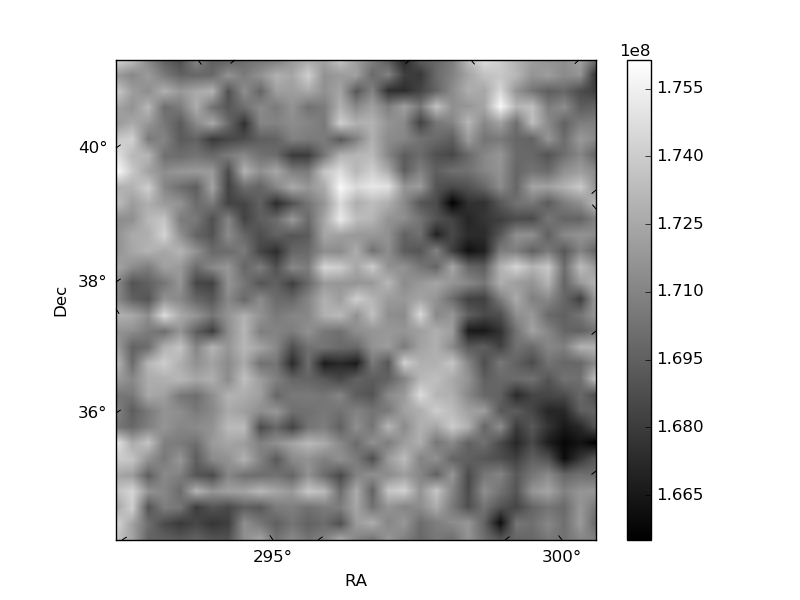
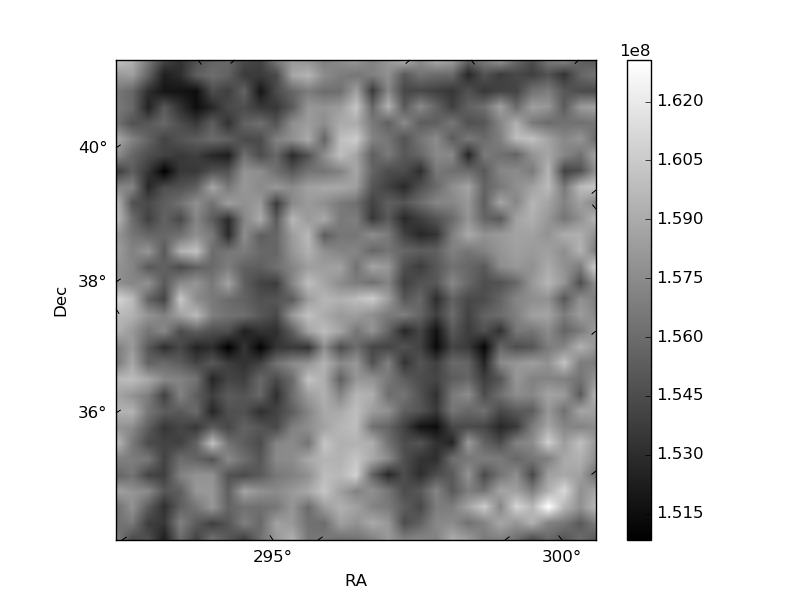
Histogram calculated using DETX and DETY for each event in the final _common_clean file
| Quadrant A | 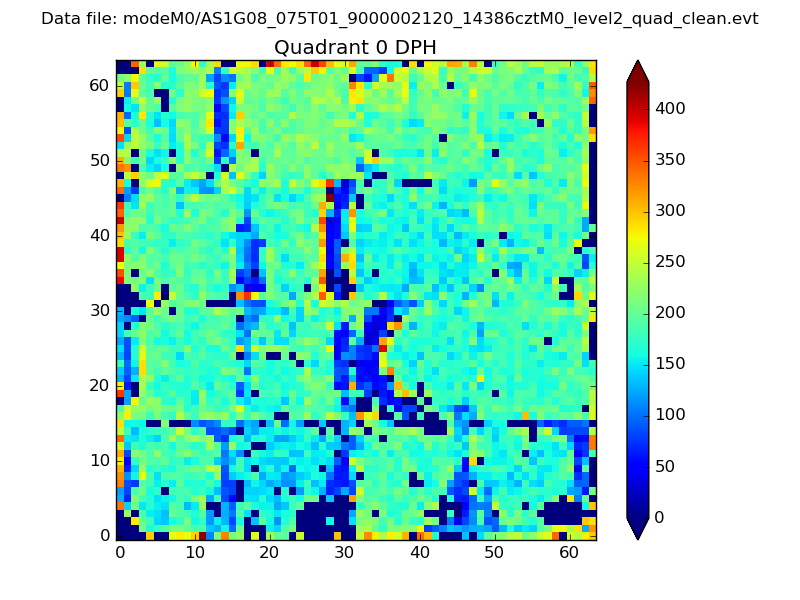 |
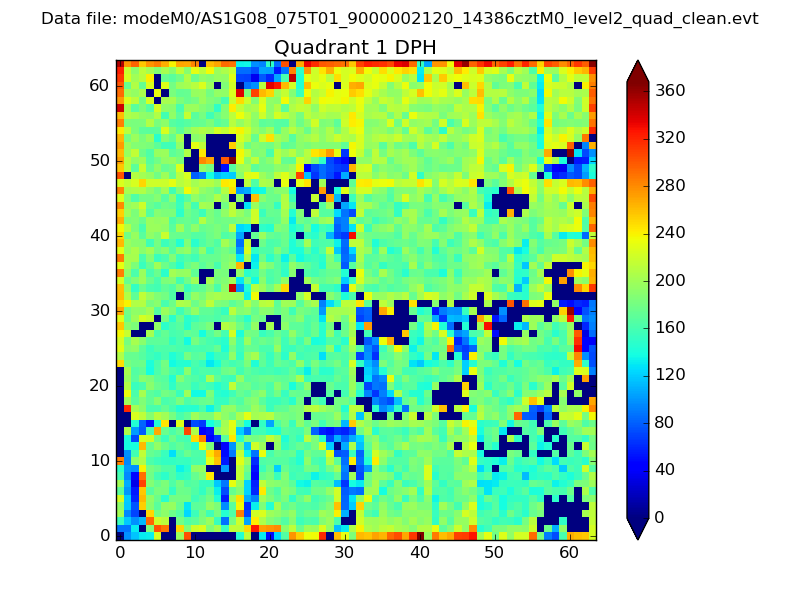 |
Quadrant B |
|---|---|---|---|
| Quadrant D | 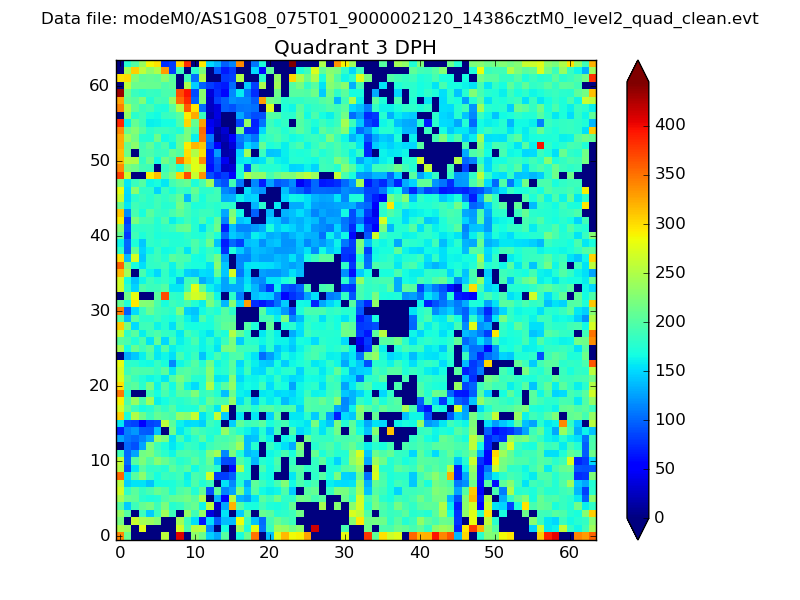 |
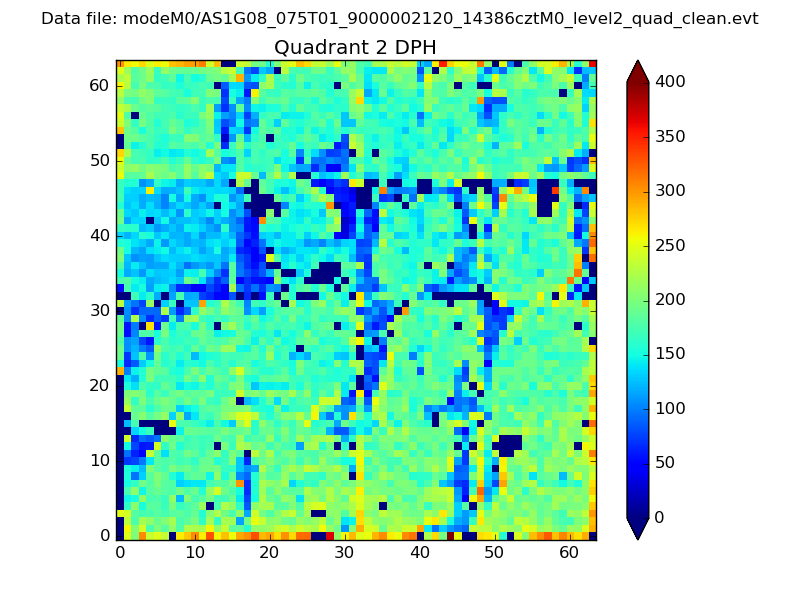 |
Quadrant C |
| Plot type | Count rate plots | Images |
|---|---|---|
| Comparison with Poisson distribution Blue bars denote a histogram of data divided into 1 sec bins. Red curve is a Poisson curve with rate = median count rate of data. |
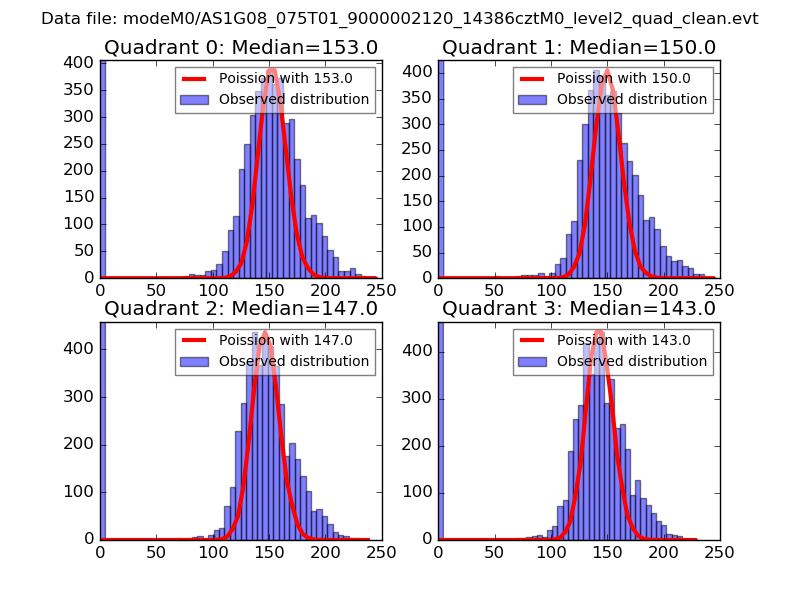 |
 |
| Quadrant-wise count rates Data is divided into 100 sec bins |
 |
|
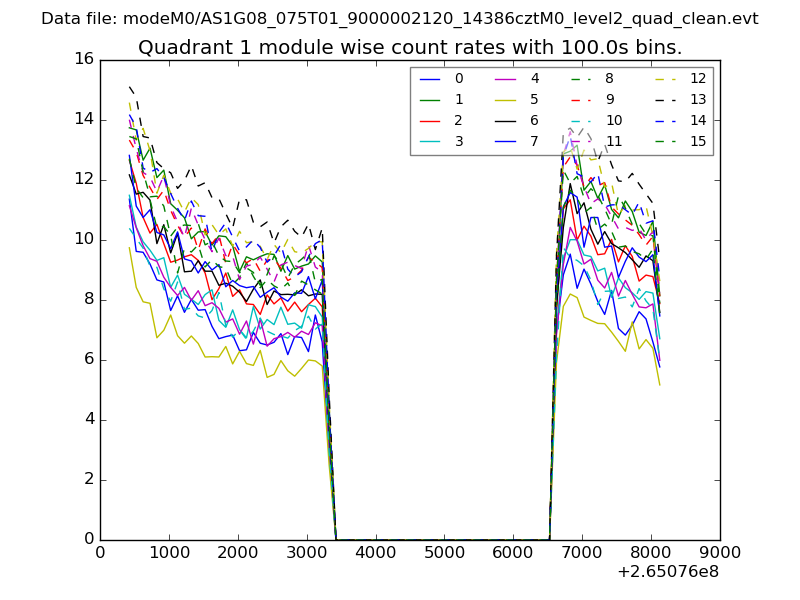
| Module-wise count rates for Quadrant A Data is divided into 100 sec bins |
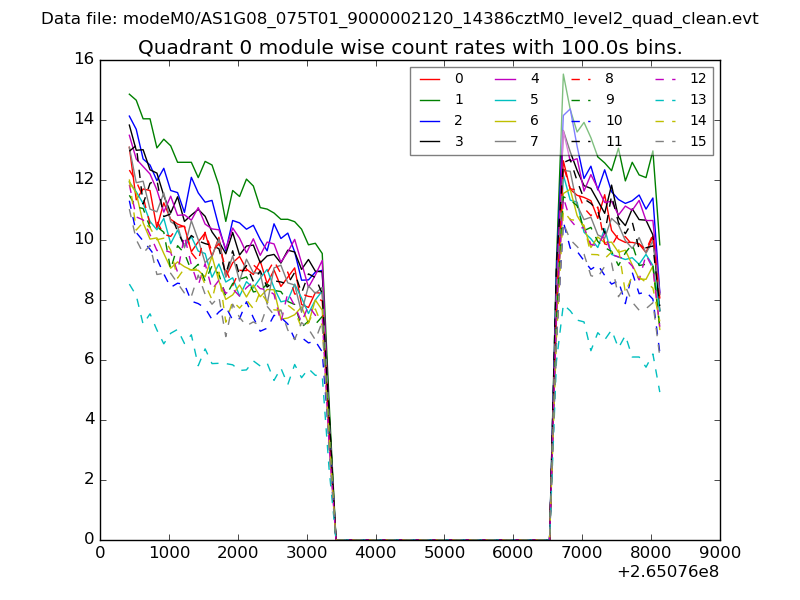 |
 |
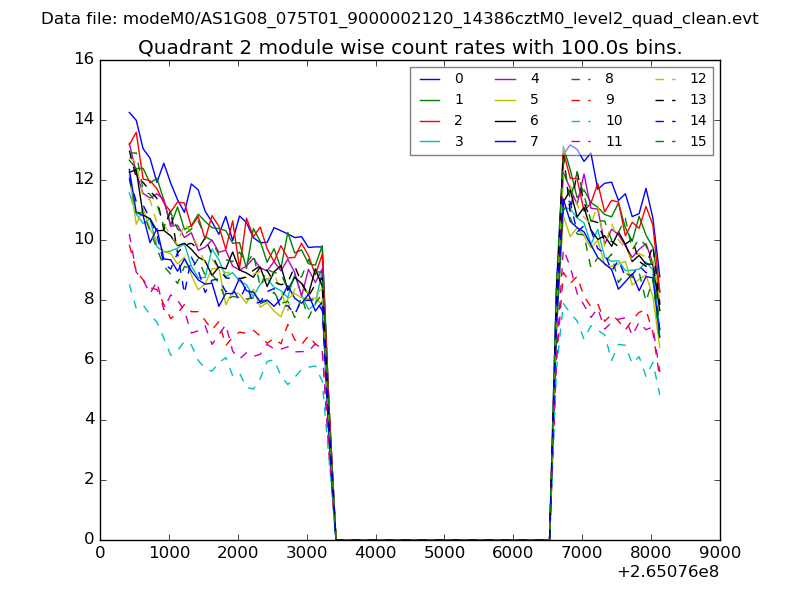
| Module-wise count rates for Quadrant B Data is divided into 100 sec bins |
 |
 |
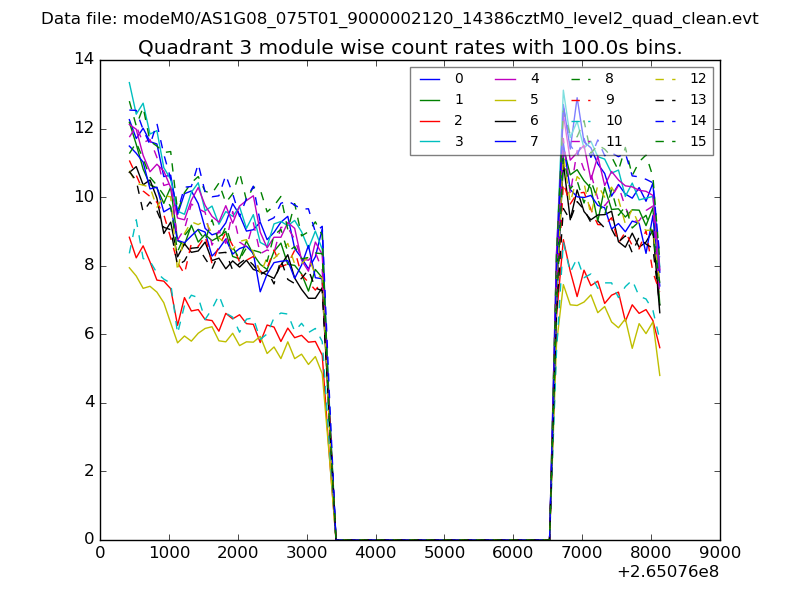
| Module-wise count rates for Quadrant C Data is divided into 100 sec bins |
 |
 |
| Module-wise count rates for Quadrant D Data is divided into 100 sec bins |
 |
 |
| Parameter | Plot |
|---|---|
| CZT HV Monitor | 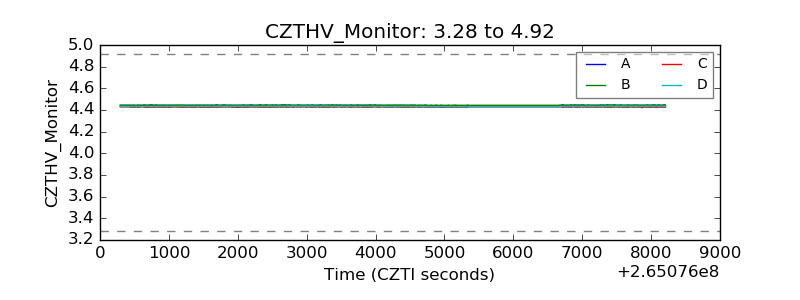 |
| D_VDD | 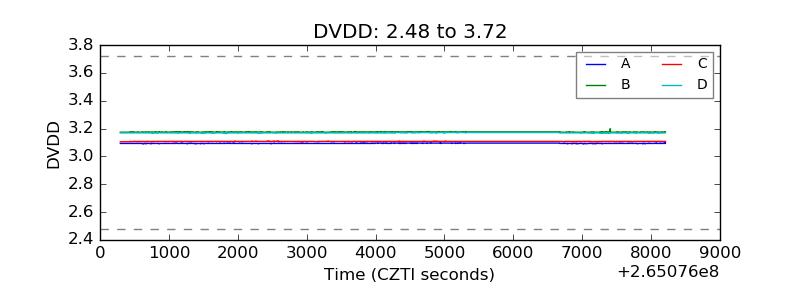 |
| Temperature 1 | 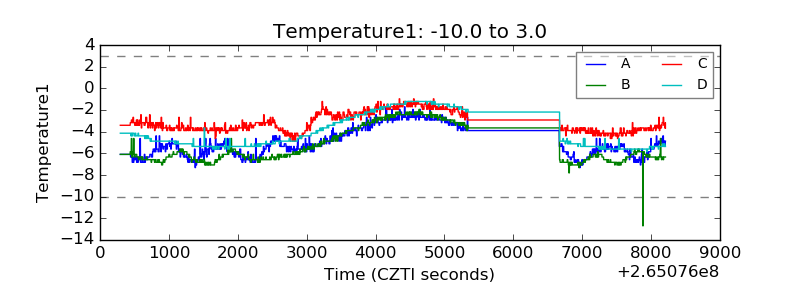 |
| Veto HV Monitor | 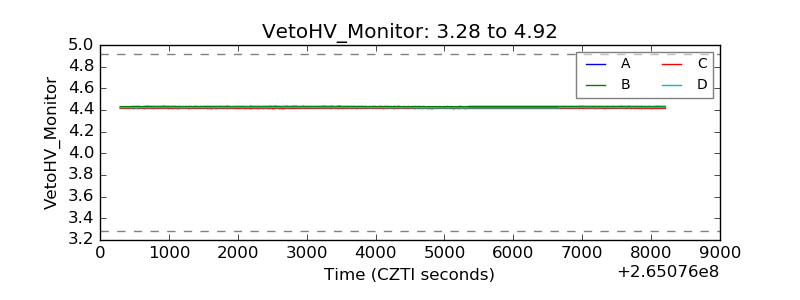 |
| Veto LLD | 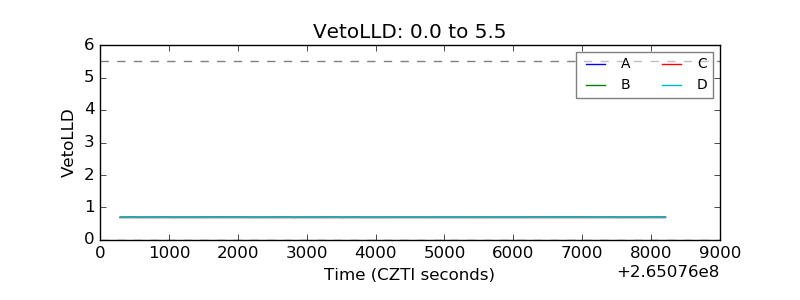 |
| Alpha Counter |  |
| _CPM_Rate |  |
| CZT Counter | 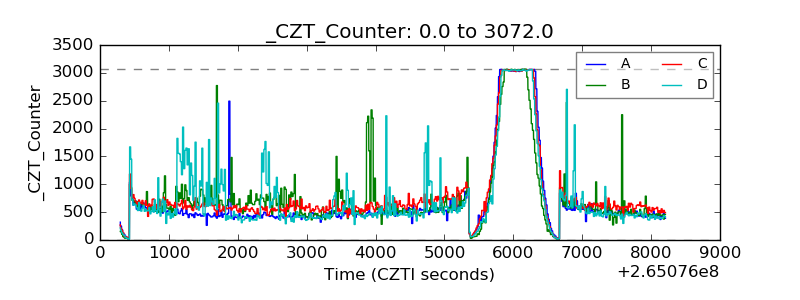 |
| +2.5 Volts monitor |  |
| +5 Volts monitor |  |
| _ROLL_ROT | 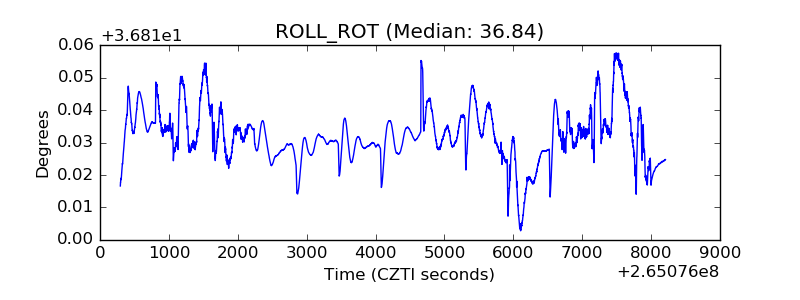 |
| _Roll_DEC | 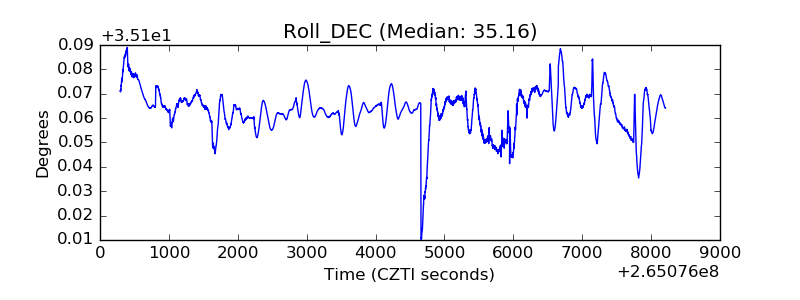 |
| _Roll_RA | 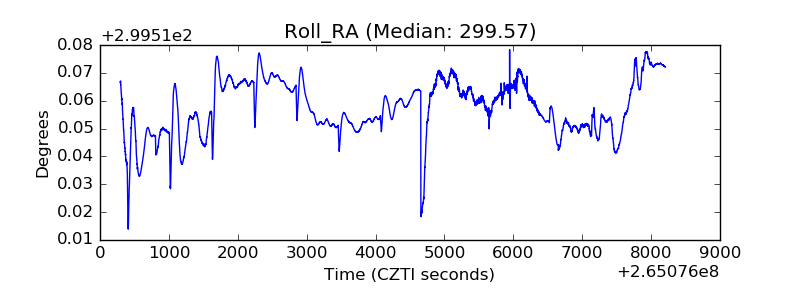 |
| Veto Counter | 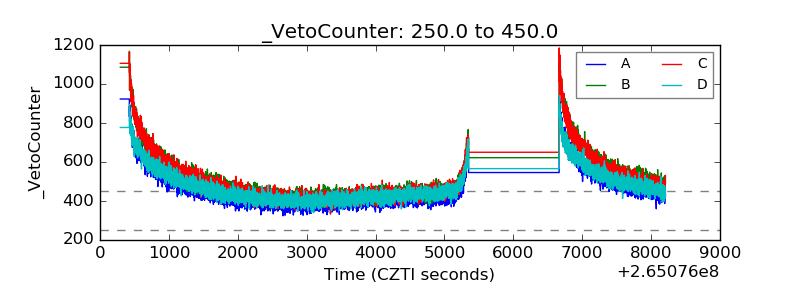 |