| Param | Original file | Final file |
|---|---|---|
| Filename | modeM0/AS1G08_075T01_9000002120_14387cztM0_level2.evt | modeM0/AS1G08_075T01_9000002120_14387cztM0_level2_quad_clean.evt |
| Size (bytes) | 321,793,920 | 63,973,440 |
| Size | 306.9 MB | 61.0 MB |
| Events in quadrant A | 2,154,044 | 417,334 |
| Events in quadrant B | 2,461,354 | 412,152 |
| Events in quadrant C | 2,659,071 | 400,737 |
| Events in quadrant D | 2,170,175 | 396,462 |
| Mode SS | |||
|---|---|---|---|
| Quadrant | BADHDUFLAG | Total packets | Discarded packets |
| A | 0 | 105 | 13 |
| B | 0 | 103 | 15 |
| C | 0 | 104 | 14 |
| D | 0 | 108 | 18 |
| Mode M0 | |||
|---|---|---|---|
| Quadrant | BADHDUFLAG | Total packets | Discarded packets |
| A | 0 | 10788 | 1626 |
| B | 0 | 11731 | 1635 |
| C | 0 | 13060 | 2055 |
| D | 0 | 11399 | 1916 |
| Mode M9 | |||
|---|---|---|---|
| Quadrant | BADHDUFLAG | Total packets | Discarded packets |
| A | 0 | 11 | 8 |
| B | 0 | 15 | 12 |
| C | 0 | 9 | 5 |
| D | 0 | 12 | 7 |
| Quadrant | Total seconds | Saturated seconds | Saturation percentage |
|---|---|---|---|
| A | 4404 | 12 | 0.272480% |
| B | 4408 | 91 | 2.064428% |
| C | 4397 | 13 | 0.295656% |
| D | 4415 | 29 | 0.656852% |
Noise dominated data is calculated using 1-second bins in cleaned event files. If a bin has >2000 counts, and if more than 50% of those come from <1% of pixels, then it is considered to be noise-dominated and hence unusable.
| Quadrant | # 1 sec bins | Bins with >0 counts | Bins with >2000 counts | High rate bins dominated by noise | Noise dominated (total time) | Noise dominated (detector-on time) | Marked lightcurve |
|---|---|---|---|---|---|---|---|
| A | 7778 | 4454 | 2 | 2 | 0.03% | 0.04% | 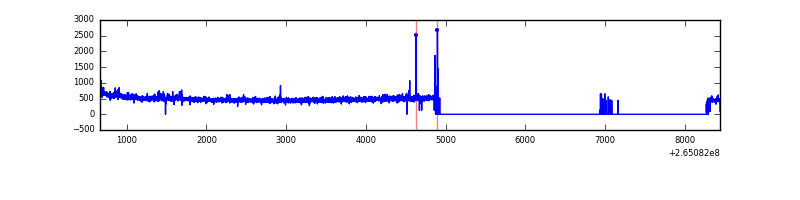 |
| B | 7778 | 4443 | 80 | 80 | 1.03% | 1.80% | 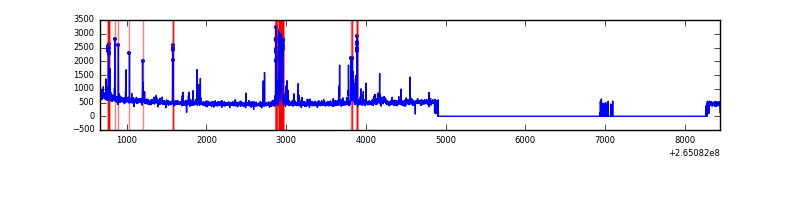 |
| C | 7778 | 4432 | 0 | 0 | 0.00% | 0.00% | 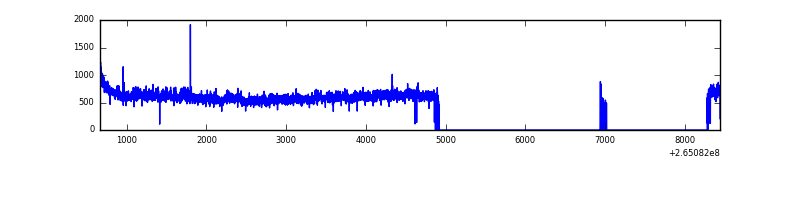 |
| D | 7778 | 4453 | 19 | 19 | 0.24% | 0.43% | 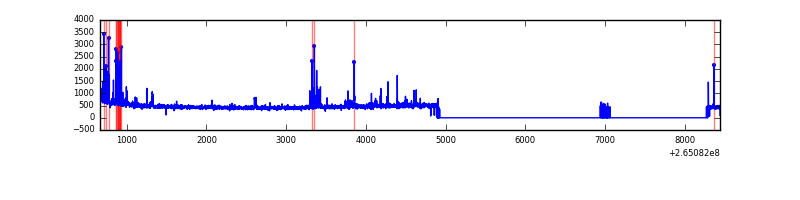 |
Top three noisy pixels from each quadrant. If the there are fewer than three noisy pixels in the level2.evt file, extra rows are filled as -1
| Pixel properties | Quadrant properties | ||||||
|---|---|---|---|---|---|---|---|
| Quadrant | DetID | PixID | Counts | Sigma | Mean | Median | Sigma |
| A | 8 | 15 | 28007 | 249.3 | 547 | 538 | 110.2 |
| A | 4 | 2 | 17929 | 157.83 | 547 | 538 | 110.2 |
| A | 0 | 226 | 4930 | 39.86 | 547 | 538 | 110.2 |
| B | 0 | 229 | 293395 | 2901.8 | 540 | 528 | 100.9 |
| B | 4 | 173 | 48336 | 473.69 | 540 | 528 | 100.9 |
| B | 12 | 111 | 11278 | 106.51 | 540 | 528 | 100.9 |
| C | 3 | 233 | 614384 | 5159.45 | 521 | 526 | 119.0 |
| C | 3 | 232 | 5960 | 45.67 | 521 | 526 | 119.0 |
| C | 3 | 234 | 3902 | 28.38 | 521 | 526 | 119.0 |
| D | 2 | 120 | 91551 | 662.87 | 519 | 509 | 137.3 |
| D | 10 | 70 | 32165 | 230.48 | 519 | 509 | 137.3 |
| D | 10 | 199 | 23549 | 167.75 | 519 | 509 | 137.3 |
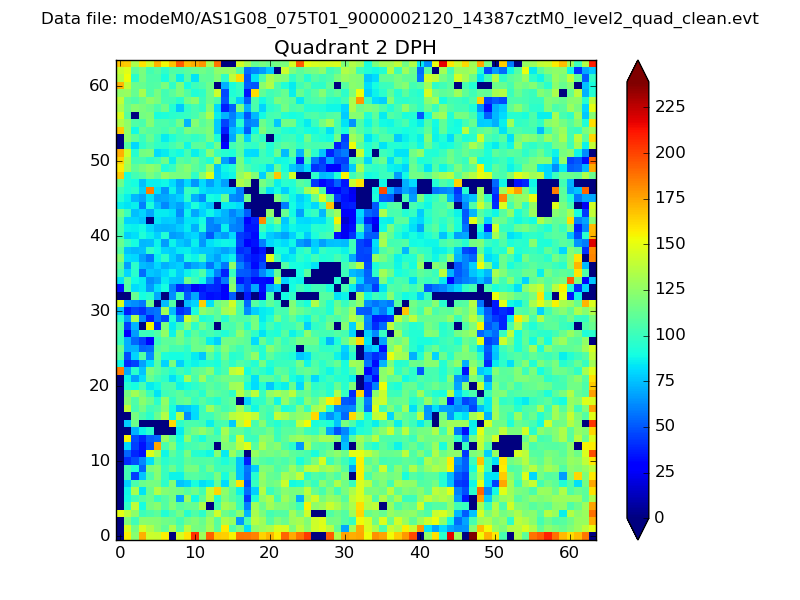
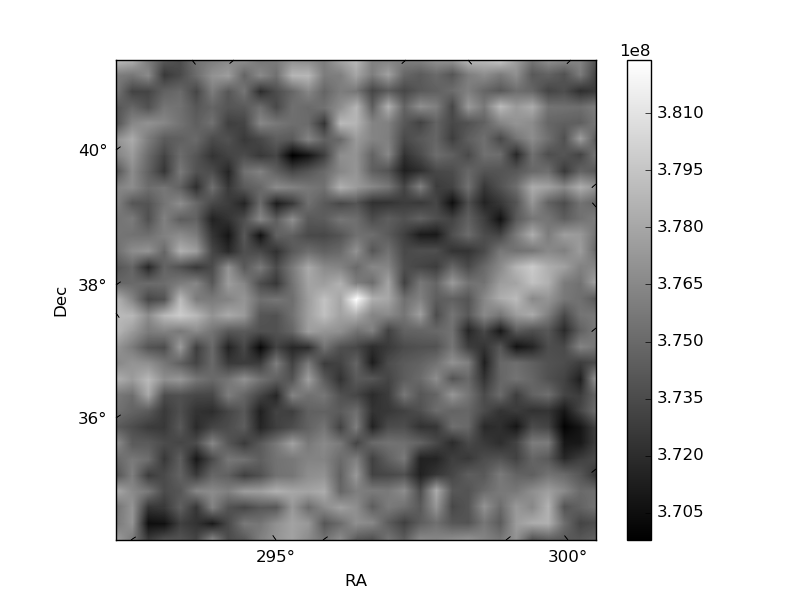
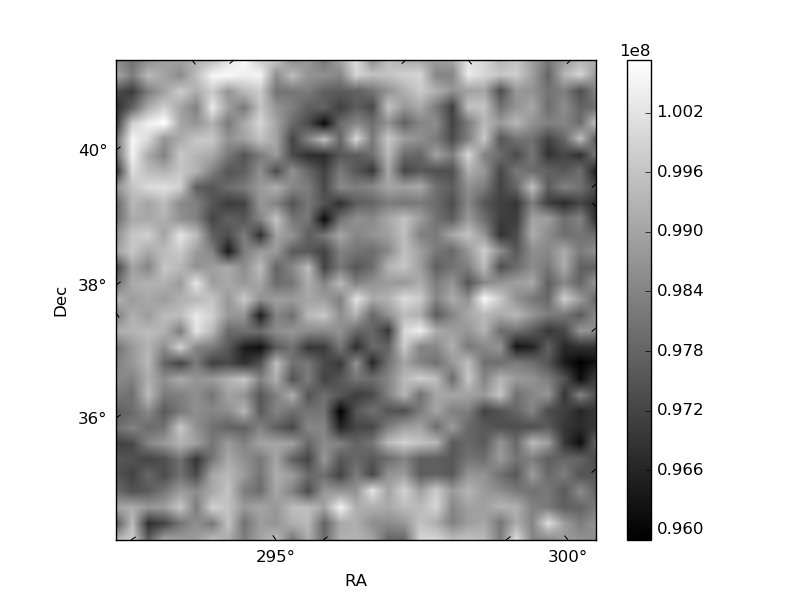
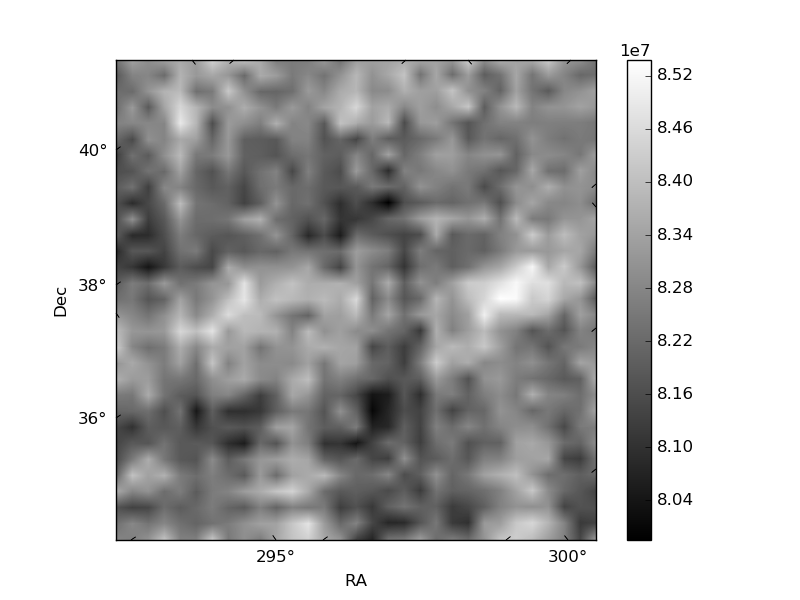
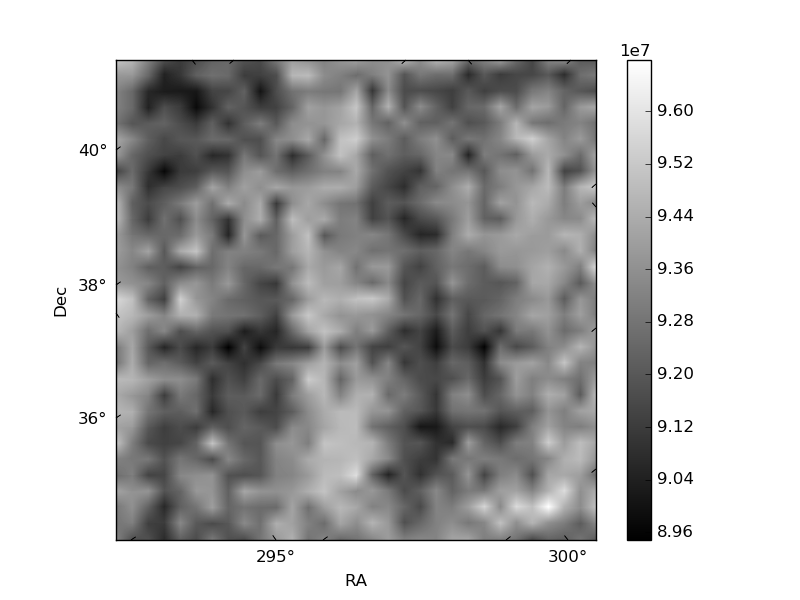
Histogram calculated using DETX and DETY for each event in the final _common_clean file
| Quadrant A | 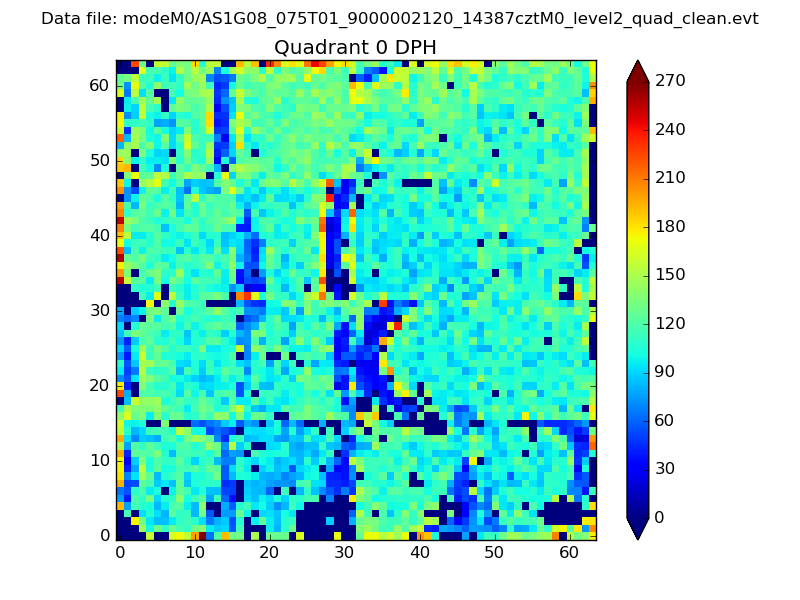 |
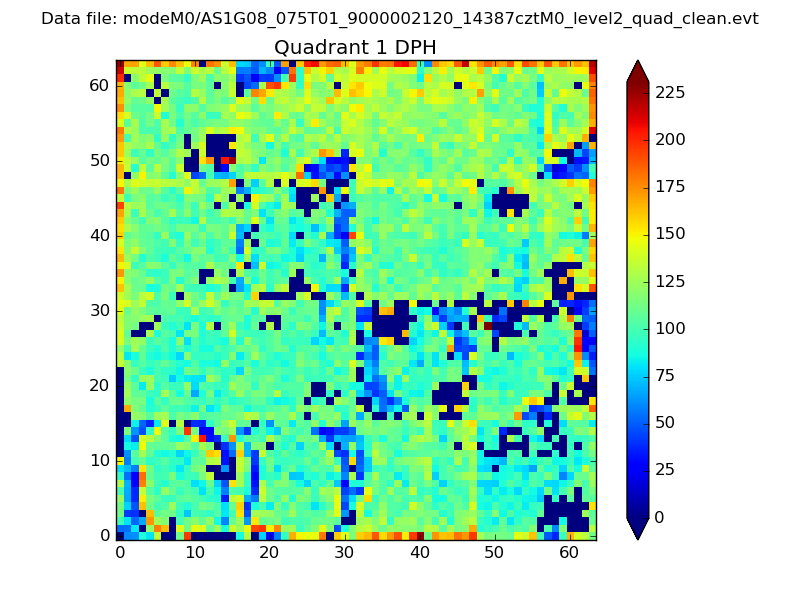 |
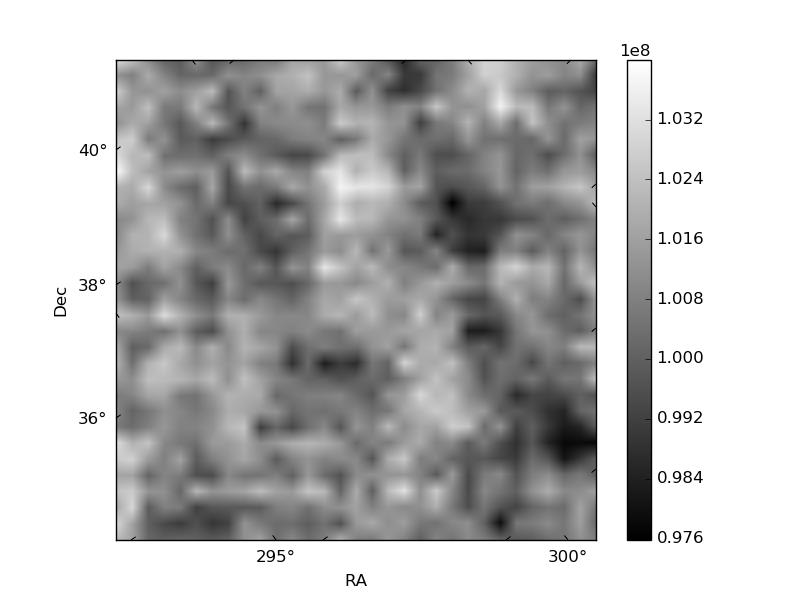
Quadrant B |
|---|---|---|---|
| Quadrant D | 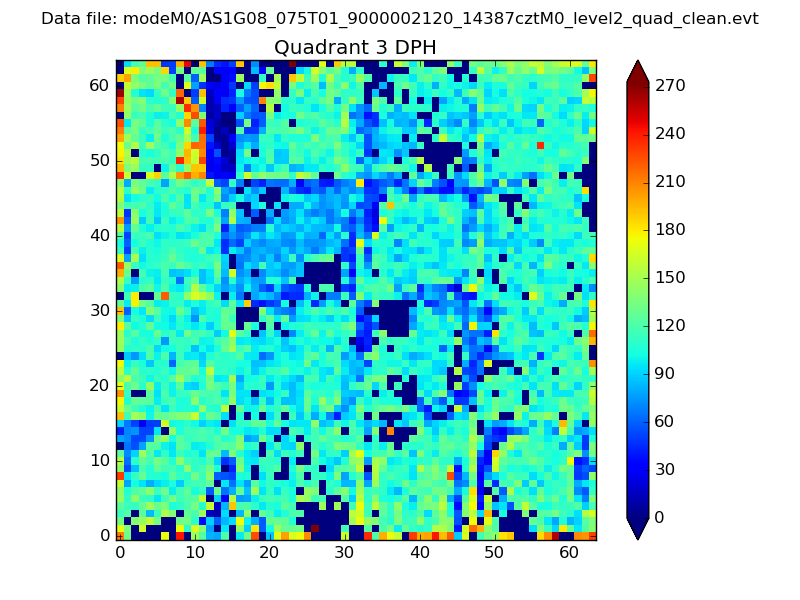 |
 |
Quadrant C |
| Plot type | Count rate plots | Images |
|---|---|---|
| Comparison with Poisson distribution Blue bars denote a histogram of data divided into 1 sec bins. Red curve is a Poisson curve with rate = median count rate of data. |
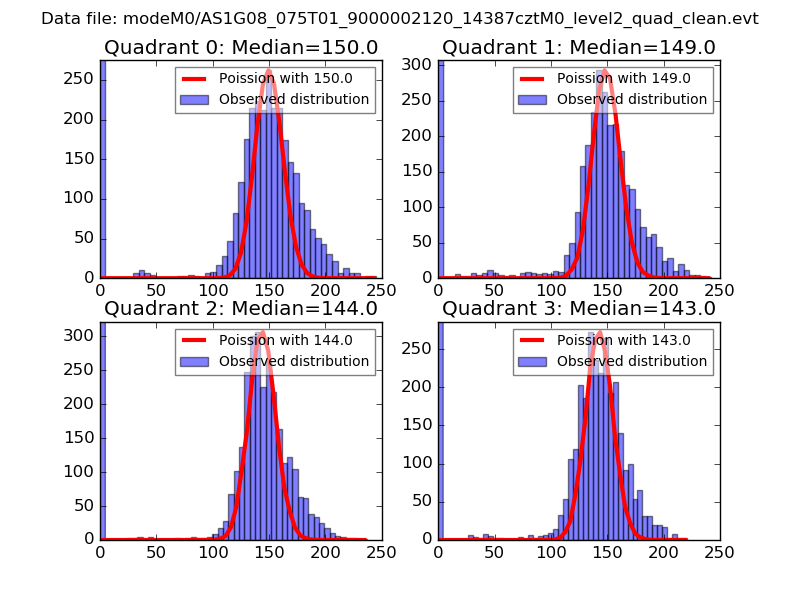 |
 |
| Quadrant-wise count rates Data is divided into 100 sec bins |
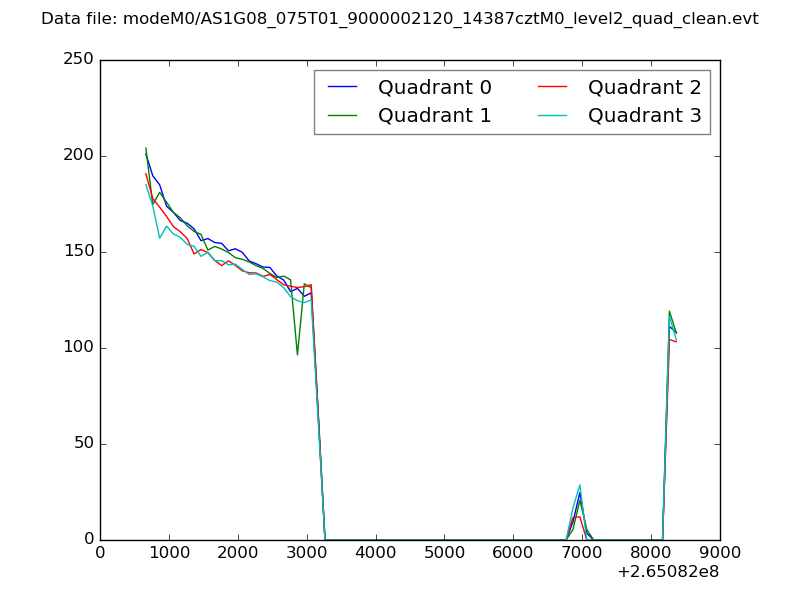 |
|
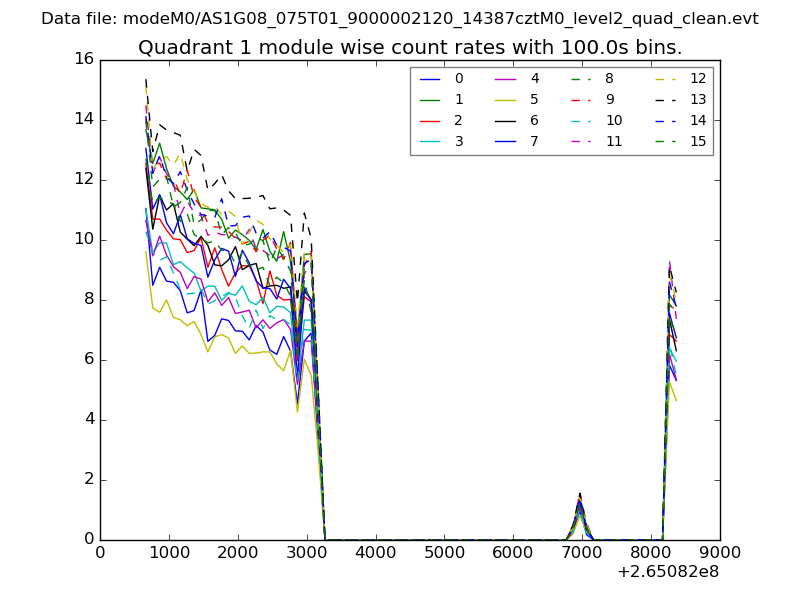
| Module-wise count rates for Quadrant A Data is divided into 100 sec bins |
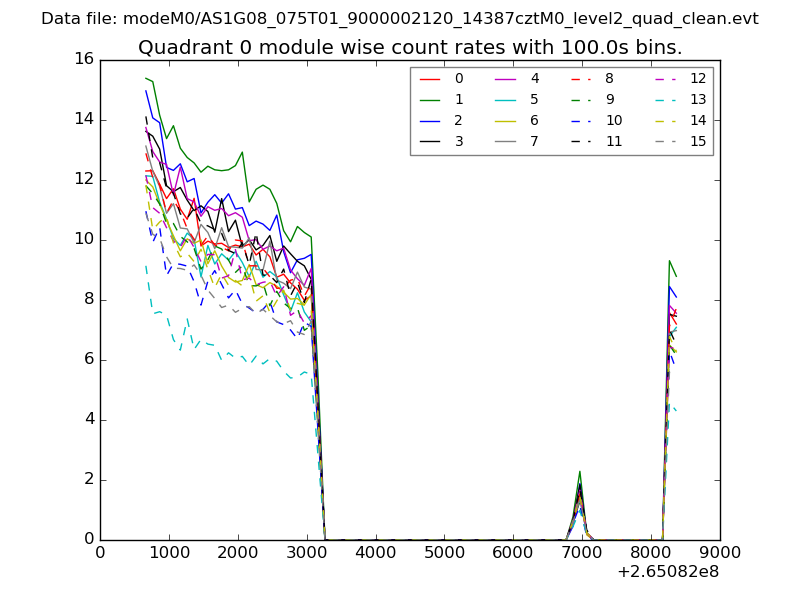 |
 |
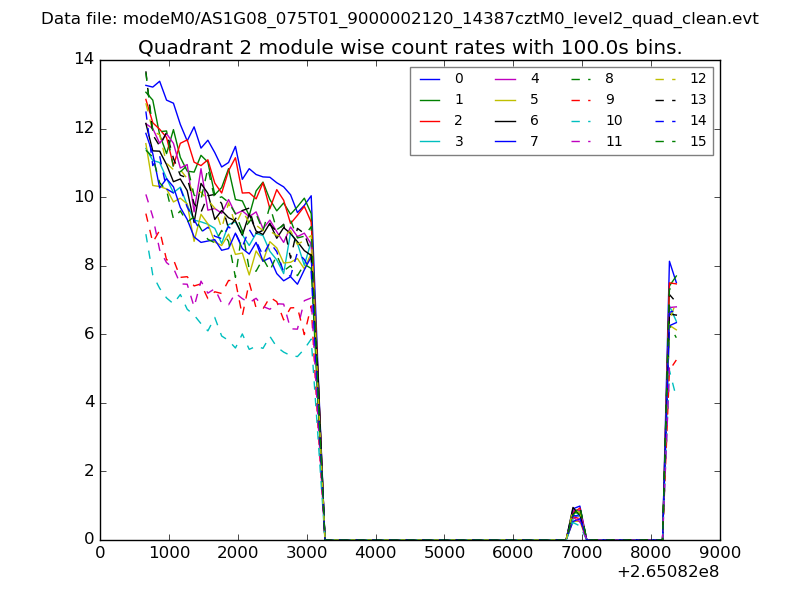
| Module-wise count rates for Quadrant B Data is divided into 100 sec bins |
 |
 |
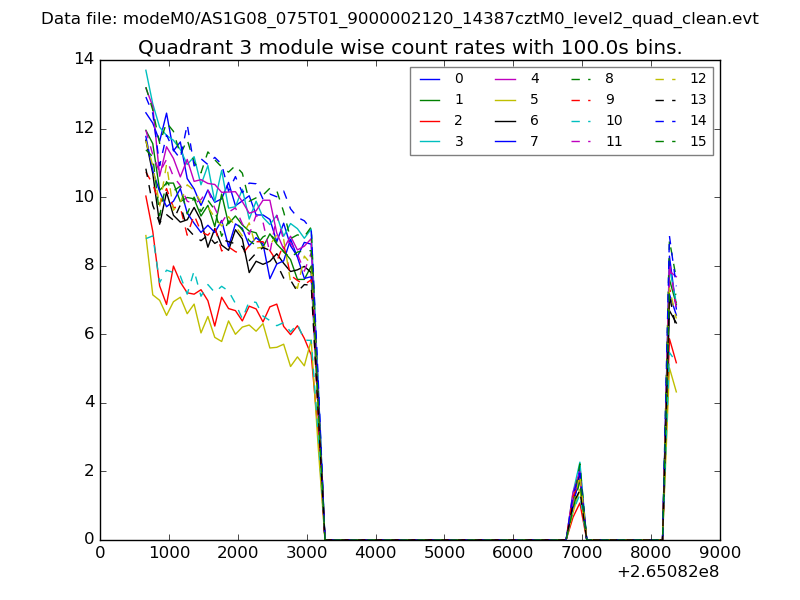
| Module-wise count rates for Quadrant C Data is divided into 100 sec bins |
 |
 |
| Module-wise count rates for Quadrant D Data is divided into 100 sec bins |
 |
 |
| Parameter | Plot |
|---|---|
| CZT HV Monitor | 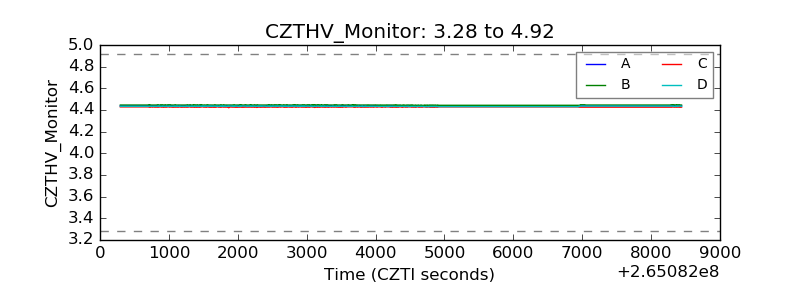 |
| D_VDD | 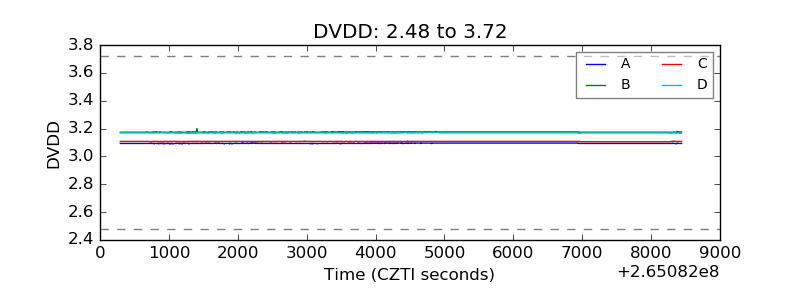 |
| Temperature 1 | 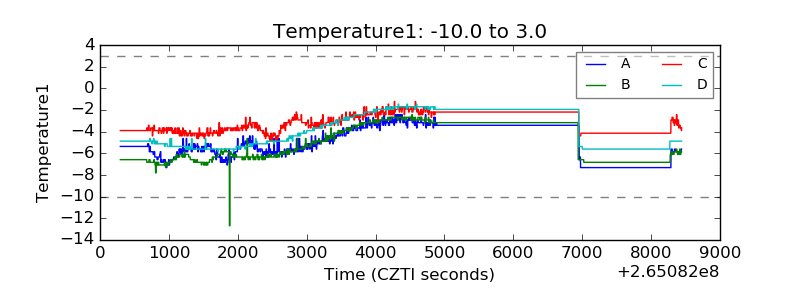 |
| Veto HV Monitor | 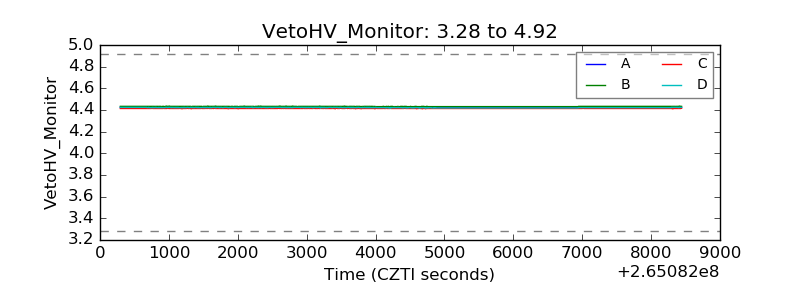 |
| Veto LLD | 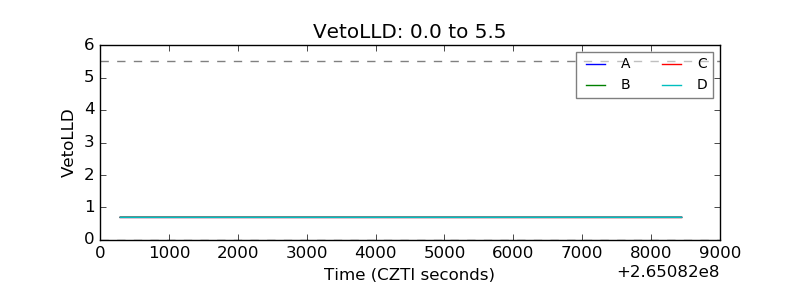 |
| Alpha Counter | 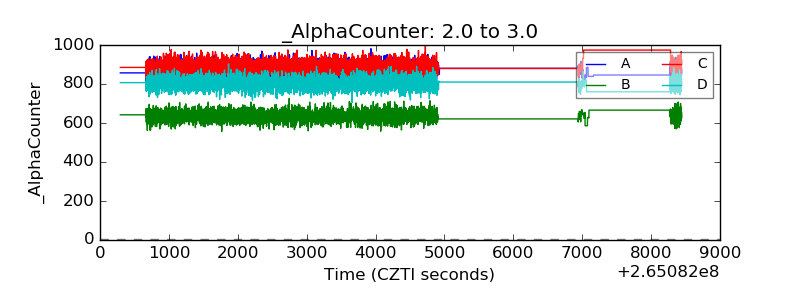 |
| _CPM_Rate | 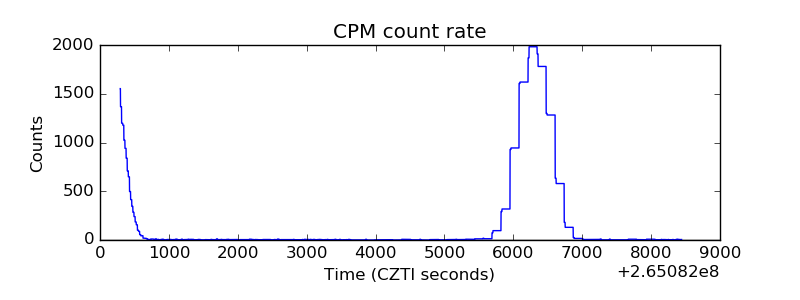 |
| CZT Counter | 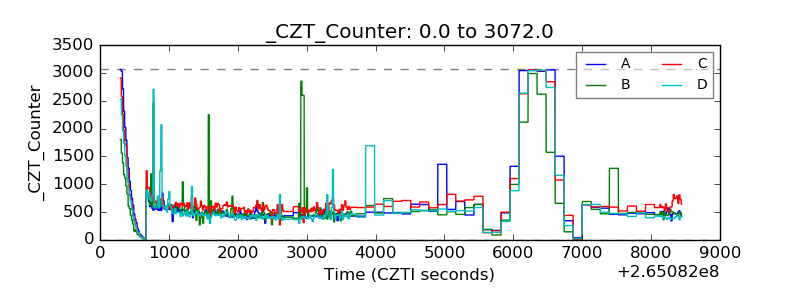 |
| +2.5 Volts monitor | 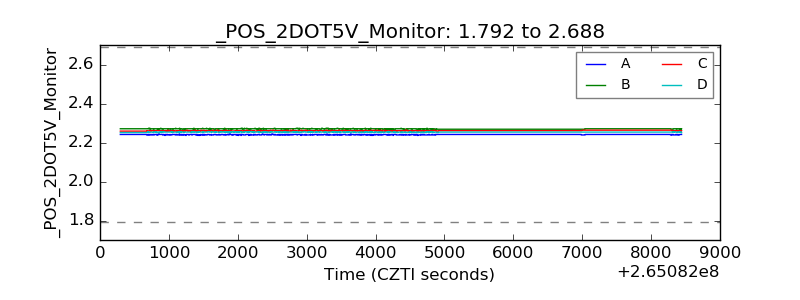 |
| +5 Volts monitor | 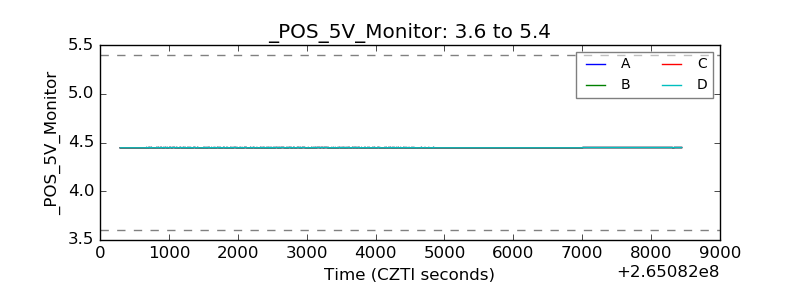 |
| _ROLL_ROT | 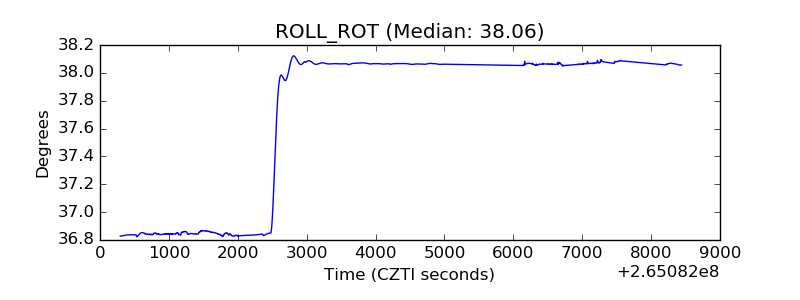 |
| _Roll_DEC | 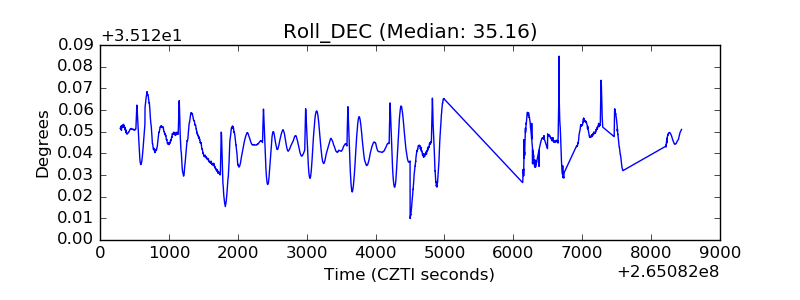 |
| _Roll_RA | 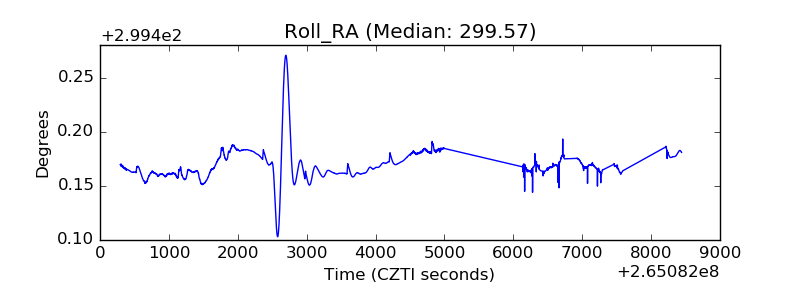 |
| Veto Counter | 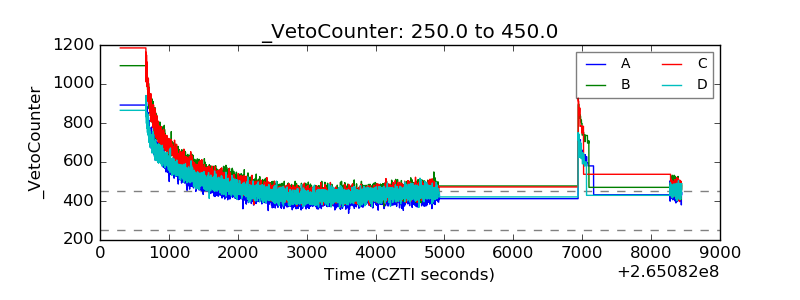 |