| Param | Original file | Final file |
|---|---|---|
| Filename | modeM0/AS1G08_075T01_9000002120_14391cztM0_level2.evt | modeM0/AS1G08_075T01_9000002120_14391cztM0_level2_quad_clean.evt |
| Size (bytes) | 595,221,120 | 99,342,720 |
| Size | 567.6 MB | 94.7 MB |
| Events in quadrant A | 3,839,236 | 634,082 |
| Events in quadrant B | 4,123,875 | 624,626 |
| Events in quadrant C | 4,225,134 | 617,833 |
| Events in quadrant D | 5,308,339 | 588,416 |
| Mode SS | |||
|---|---|---|---|
| Quadrant | BADHDUFLAG | Total packets | Discarded packets |
| A | 0 | 160 | 0 |
| B | 0 | 160 | 0 |
| C | 0 | 160 | 0 |
| D | 0 | 160 | 0 |
| Mode M0 | |||
|---|---|---|---|
| Quadrant | BADHDUFLAG | Total packets | Discarded packets |
| A | 0 | 16365 | 3 |
| B | 0 | 17162 | 2 |
| C | 0 | 16927 | 2 |
| D | 0 | 21173 | 2 |
| Mode M9 | |||
|---|---|---|---|
| Quadrant | BADHDUFLAG | Total packets | Discarded packets |
| A | 0 | 1 | 0 |
| B | 0 | 1 | 0 |
| C | 0 | 1 | 0 |
| D | 0 | 1 | 0 |
| Quadrant | Total seconds | Saturated seconds | Saturation percentage |
|---|---|---|---|
| A | 7800 | 312 | 4.000000% |
| B | 7800 | 359 | 4.602564% |
| C | 7800 | 265 | 3.397436% |
| D | 7801 | 668 | 8.563005% |
Noise dominated data is calculated using 1-second bins in cleaned event files. If a bin has >2000 counts, and if more than 50% of those come from <1% of pixels, then it is considered to be noise-dominated and hence unusable.
| Quadrant | # 1 sec bins | Bins with >0 counts | Bins with >2000 counts | High rate bins dominated by noise | Noise dominated (total time) | Noise dominated (detector-on time) | Marked lightcurve |
|---|---|---|---|---|---|---|---|
| A | 7956 | 7801 | 4 | 4 | 0.05% | 0.05% | 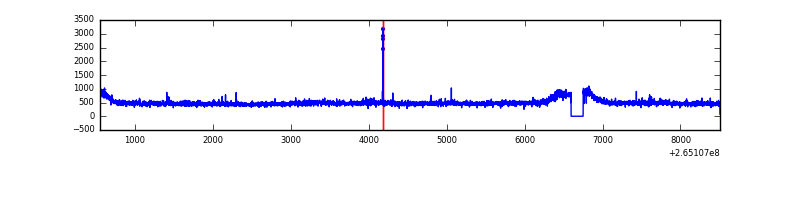 |
| B | 7956 | 7801 | 20 | 20 | 0.25% | 0.26% | 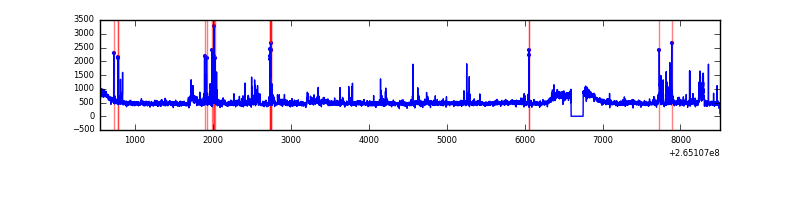 |
| C | 7956 | 7801 | 0 | 0 | 0.00% | 0.00% | 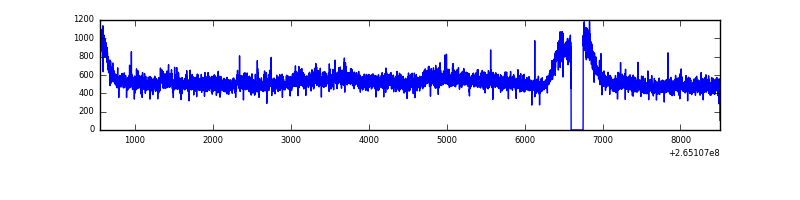 |
| D | 7957 | 7802 | 364 | 364 | 4.57% | 4.67% | 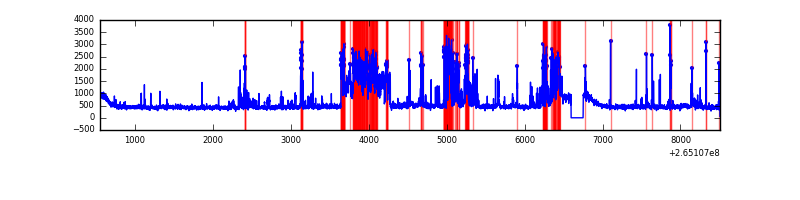 |
Top three noisy pixels from each quadrant. If the there are fewer than three noisy pixels in the level2.evt file, extra rows are filled as -1
| Pixel properties | Quadrant properties | ||||||
|---|---|---|---|---|---|---|---|
| Quadrant | DetID | PixID | Counts | Sigma | Mean | Median | Sigma |
| A | 8 | 15 | 65624 | 324.39 | 973 | 951 | 199.4 |
| A | 15 | 69 | 12556 | 58.21 | 973 | 951 | 199.4 |
| A | 3 | 1 | 9655 | 43.66 | 973 | 951 | 199.4 |
| B | 0 | 229 | 135123 | 718.42 | 959 | 934 | 186.8 |
| B | 4 | 173 | 84392 | 446.81 | 959 | 934 | 186.8 |
| B | 0 | 189 | 69724 | 368.29 | 959 | 934 | 186.8 |
| C | 3 | 233 | 579293 | 2653.24 | 934 | 936 | 218.0 |
| C | 13 | 61 | 6601 | 25.99 | 934 | 936 | 218.0 |
| C | 8 | 128 | 5205 | 19.58 | 934 | 936 | 218.0 |
| D | 12 | 110 | 887229 | 3975.92 | 918 | 897 | 222.9 |
| D | 10 | 199 | 444058 | 1987.94 | 918 | 897 | 222.9 |
| D | 2 | 120 | 379211 | 1697.05 | 918 | 897 | 222.9 |
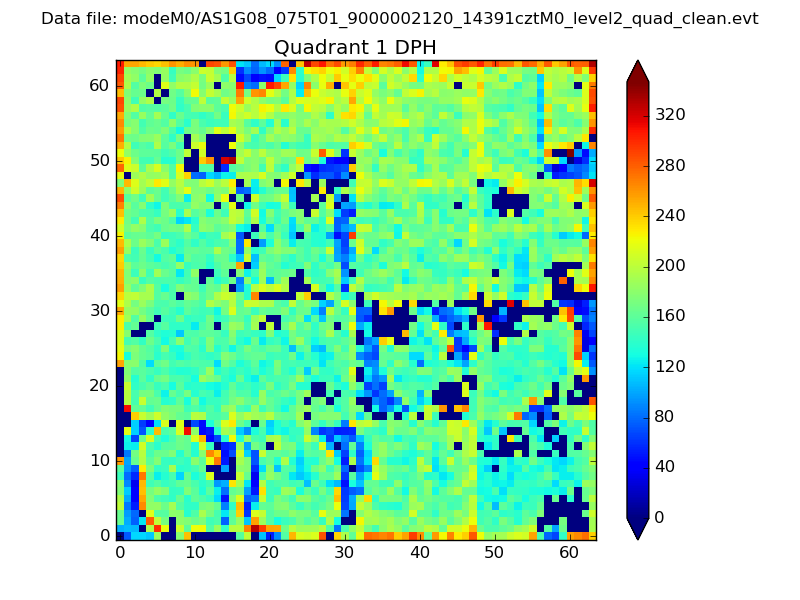
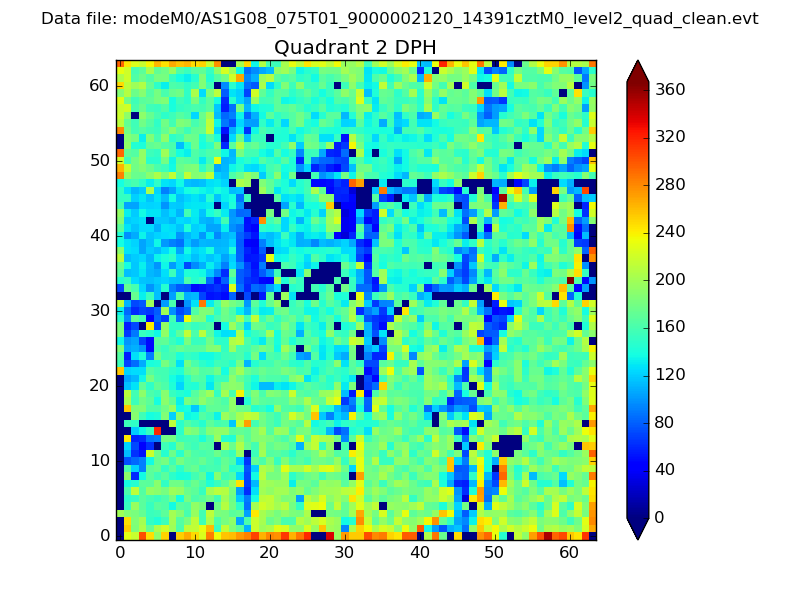
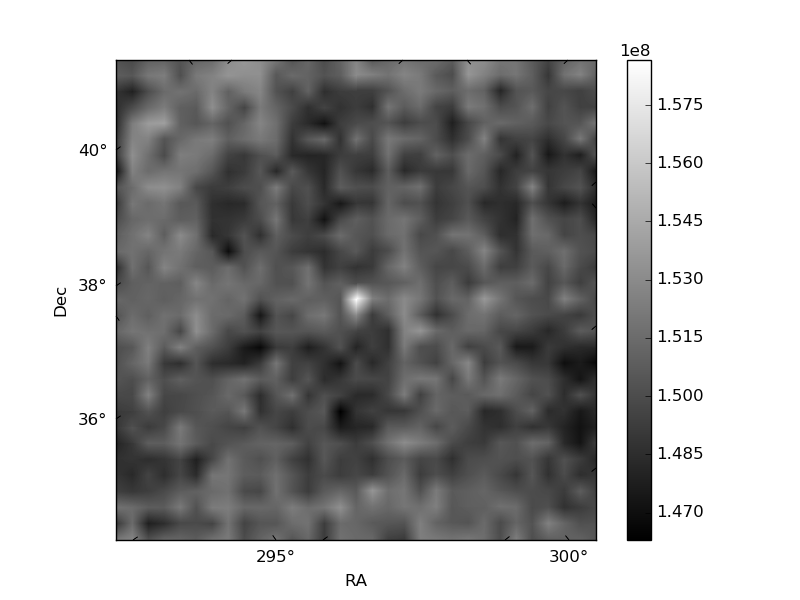
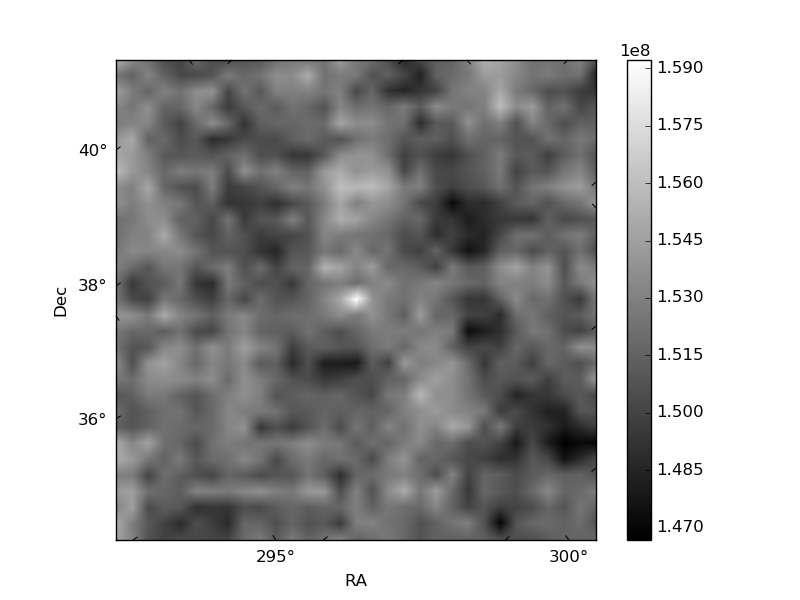
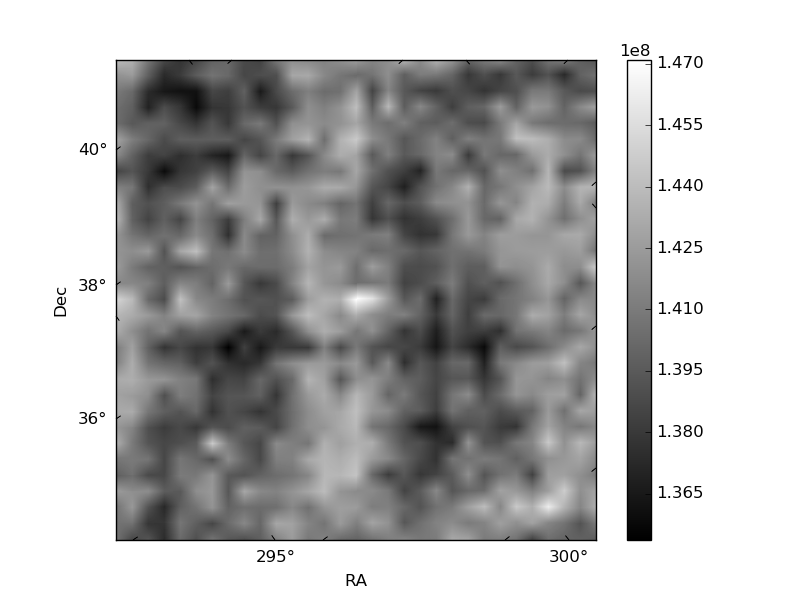
Histogram calculated using DETX and DETY for each event in the final _common_clean file
| Quadrant A |  |
 |
Quadrant B |
|---|---|---|---|
| Quadrant D | 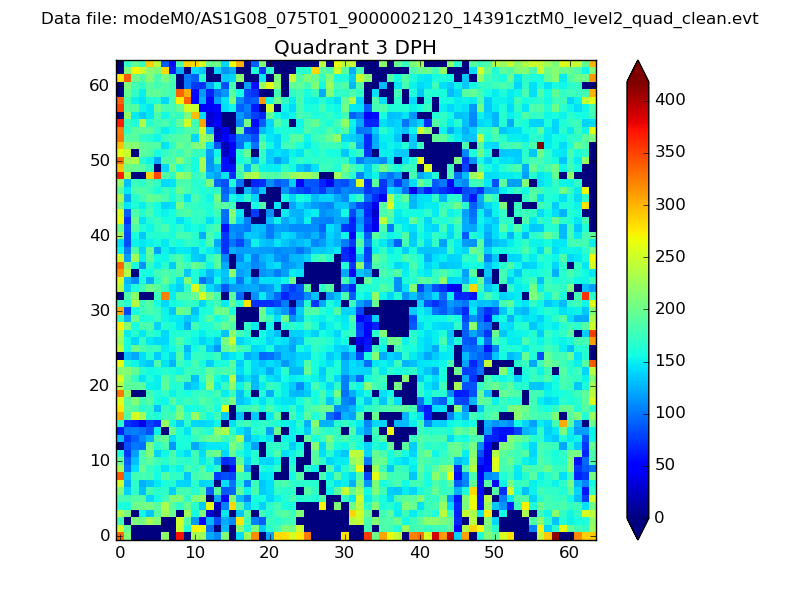 |
 |
Quadrant C |
| Plot type | Count rate plots | Images |
|---|---|---|
| Comparison with Poisson distribution Blue bars denote a histogram of data divided into 1 sec bins. Red curve is a Poisson curve with rate = median count rate of data. |
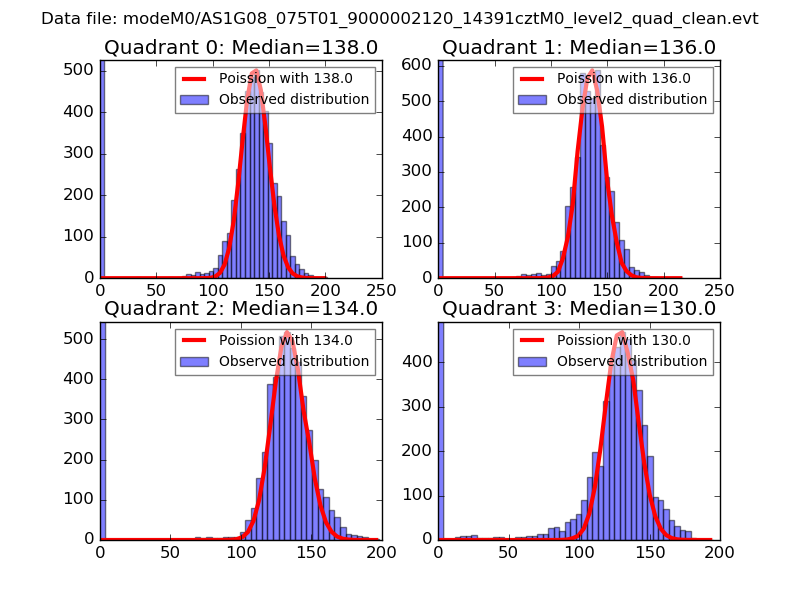 |
 |
| Quadrant-wise count rates Data is divided into 100 sec bins |
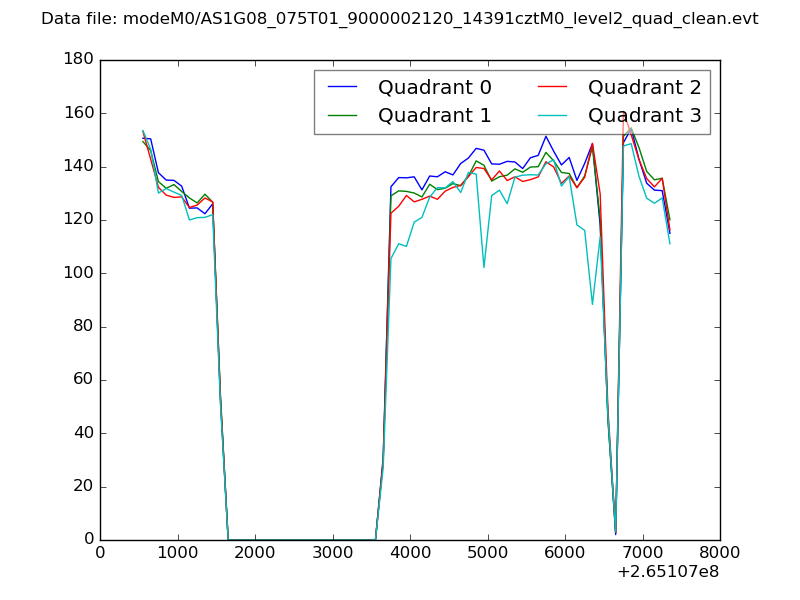 |
|
| Module-wise count rates for Quadrant A Data is divided into 100 sec bins |
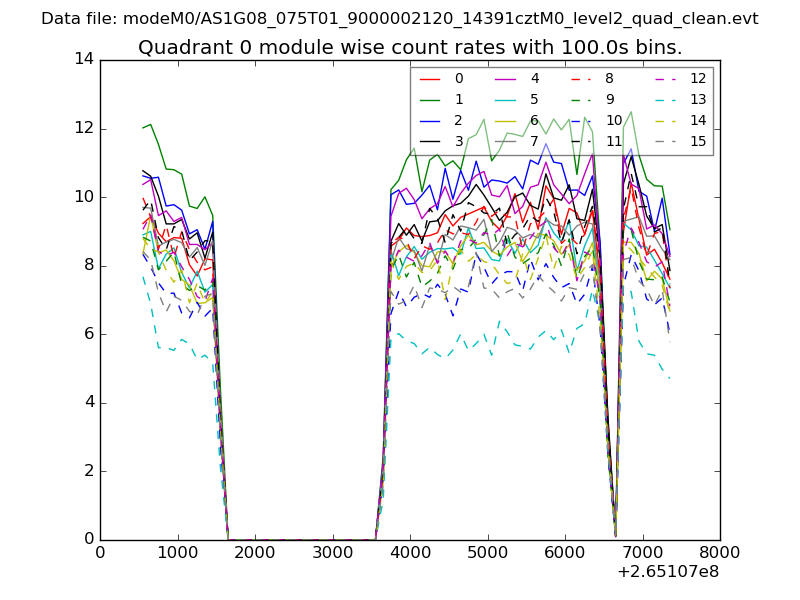 |
 |
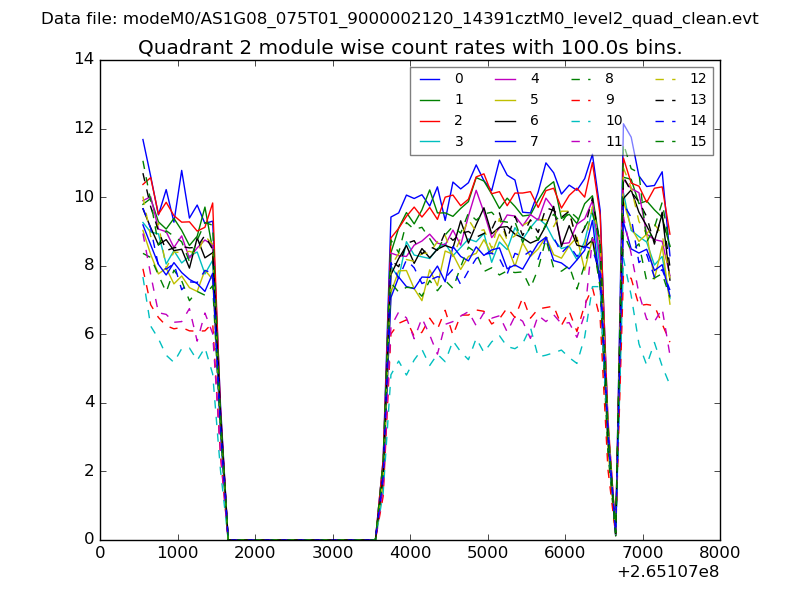
| Module-wise count rates for Quadrant B Data is divided into 100 sec bins |
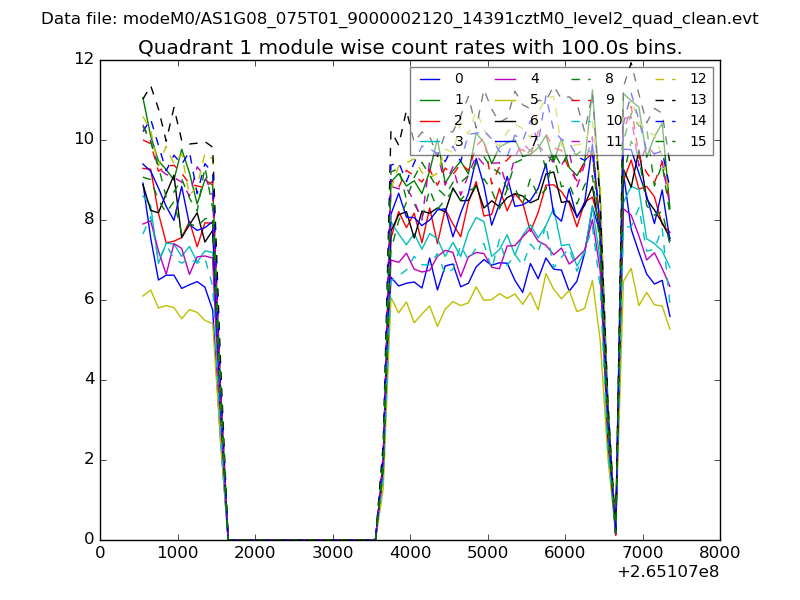 |
 |
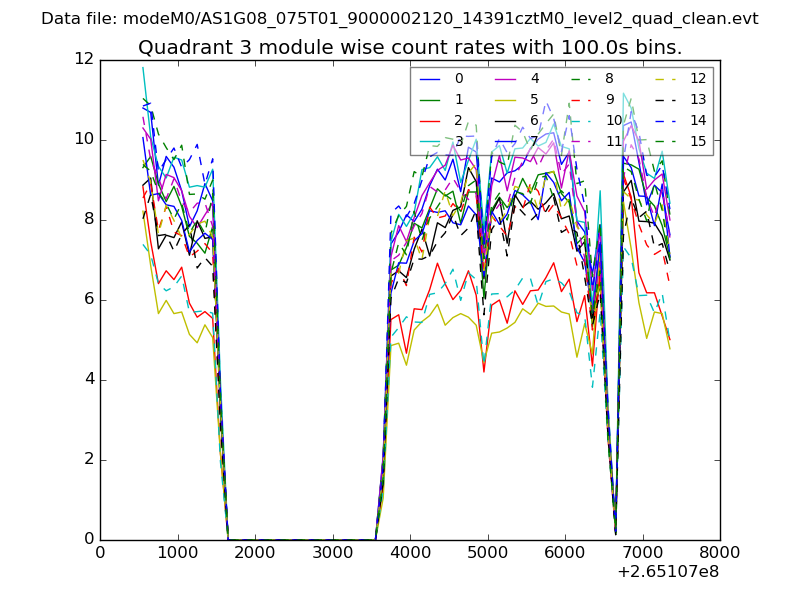
| Module-wise count rates for Quadrant C Data is divided into 100 sec bins |
 |
 |
| Module-wise count rates for Quadrant D Data is divided into 100 sec bins |
 |
 |
| Parameter | Plot |
|---|---|
| CZT HV Monitor | 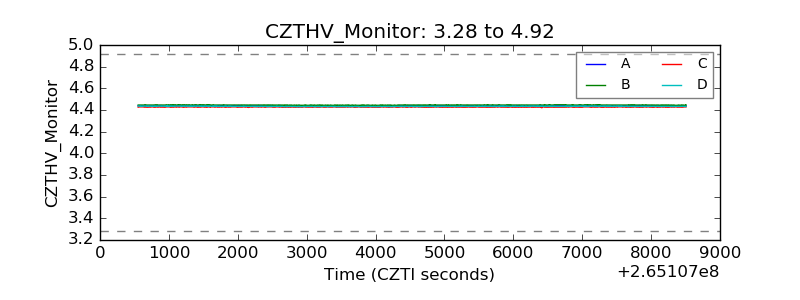 |
| D_VDD | 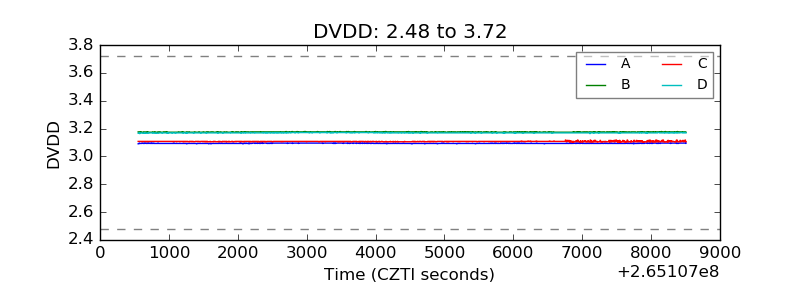 |
| Temperature 1 | 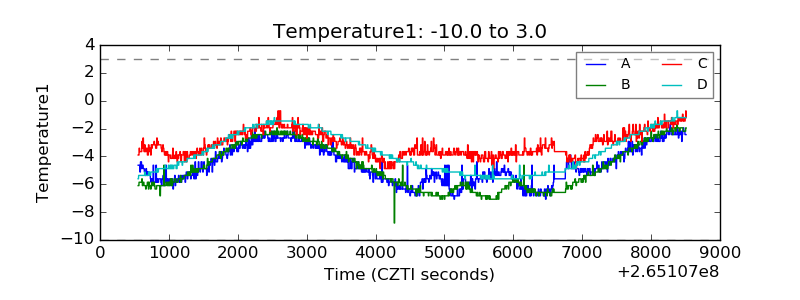 |
| Veto HV Monitor |  |
| Veto LLD | 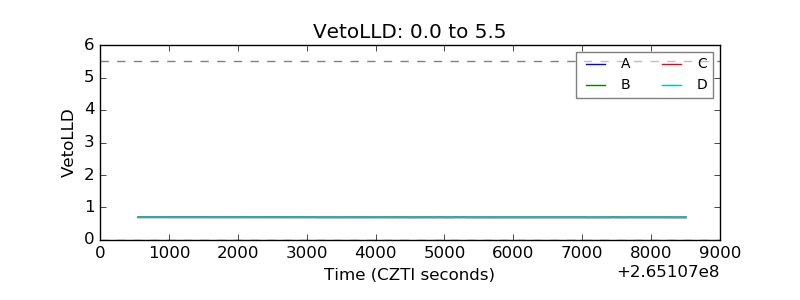 |
| Alpha Counter | 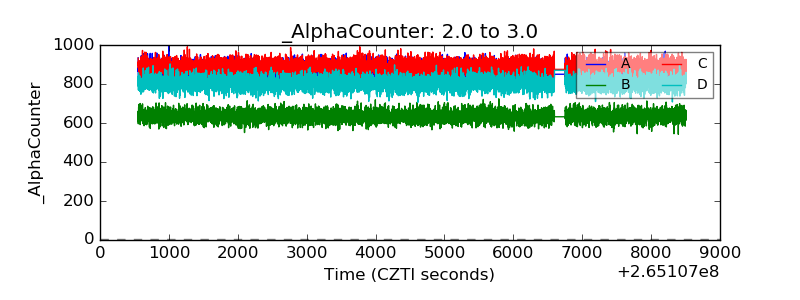 |
| _CPM_Rate |  |
| CZT Counter | 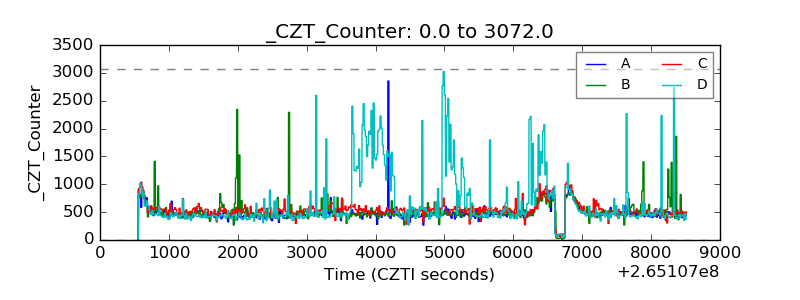 |
| +2.5 Volts monitor |  |
| +5 Volts monitor |  |
| _ROLL_ROT | 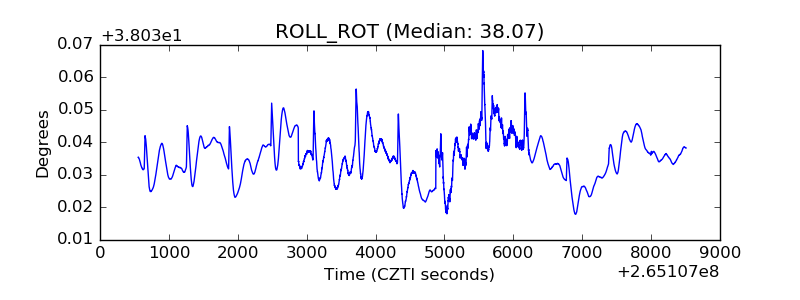 |
| _Roll_DEC |  |
| _Roll_RA |  |
| Veto Counter | 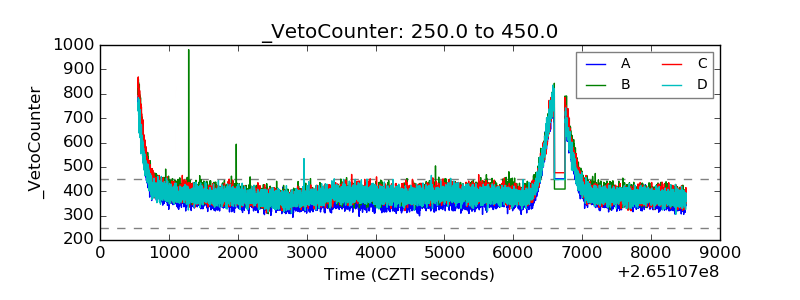 |