| Param | Original file | Final file |
|---|---|---|
| Filename | modeM0/AS1G08_075T01_9000002120_14392cztM0_level2.evt | modeM0/AS1G08_075T01_9000002120_14392cztM0_level2_quad_clean.evt |
| Size (bytes) | 596,482,560 | 98,867,520 |
| Size | 568.9 MB | 94.3 MB |
| Events in quadrant A | 4,088,871 | 625,142 |
| Events in quadrant B | 4,434,763 | 614,220 |
| Events in quadrant C | 4,571,086 | 607,967 |
| Events in quadrant D | 4,433,255 | 596,374 |
| Mode SS | |||
|---|---|---|---|
| Quadrant | BADHDUFLAG | Total packets | Discarded packets |
| A | 0 | 162 | 0 |
| B | 0 | 162 | 0 |
| C | 0 | 162 | 0 |
| D | 0 | 162 | 0 |
| Mode M0 | |||
|---|---|---|---|
| Quadrant | BADHDUFLAG | Total packets | Discarded packets |
| A | 0 | 17022 | 3 |
| B | 0 | 18240 | 2 |
| C | 0 | 18492 | 2 |
| D | 0 | 18497 | 2 |
| Mode M9 | |||
|---|---|---|---|
| Quadrant | BADHDUFLAG | Total packets | Discarded packets |
| A | 0 | 2 | 0 |
| B | 0 | 2 | 0 |
| C | 0 | 2 | 0 |
| D | 0 | 2 | 0 |
| Quadrant | Total seconds | Saturated seconds | Saturation percentage |
|---|---|---|---|
| A | 7907 | 403 | 5.096750% |
| B | 7907 | 456 | 5.767042% |
| C | 7907 | 365 | 4.616163% |
| D | 7907 | 486 | 6.146453% |
Noise dominated data is calculated using 1-second bins in cleaned event files. If a bin has >2000 counts, and if more than 50% of those come from <1% of pixels, then it is considered to be noise-dominated and hence unusable.
| Quadrant | # 1 sec bins | Bins with >0 counts | Bins with >2000 counts | High rate bins dominated by noise | Noise dominated (total time) | Noise dominated (detector-on time) | Marked lightcurve |
|---|---|---|---|---|---|---|---|
| A | 8118 | 7908 | 0 | 0 | 0.00% | 0.00% | 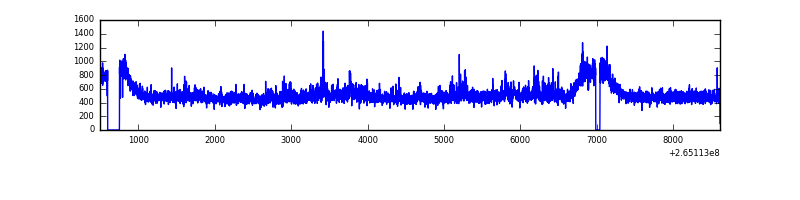 |
| B | 8118 | 7908 | 24 | 24 | 0.30% | 0.30% | 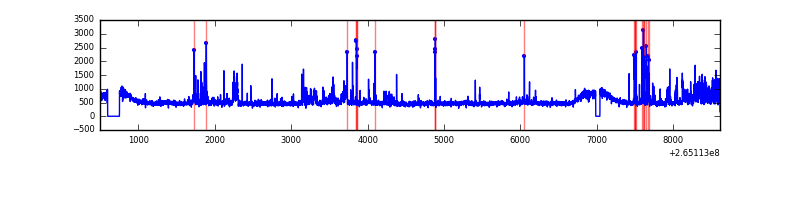 |
| C | 8118 | 7909 | 3 | 3 | 0.04% | 0.04% | 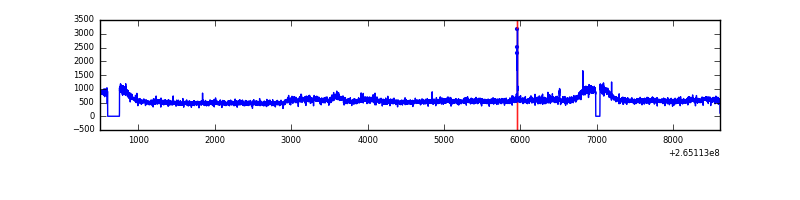 |
| D | 8118 | 7908 | 119 | 119 | 1.47% | 1.50% | 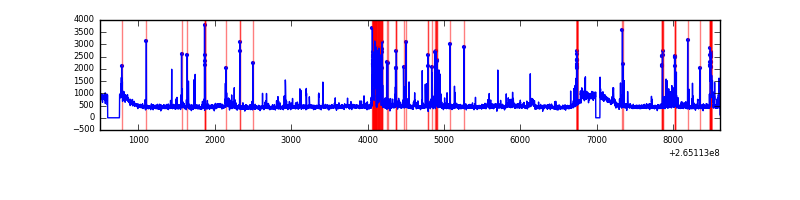 |
Top three noisy pixels from each quadrant. If the there are fewer than three noisy pixels in the level2.evt file, extra rows are filled as -1
| Pixel properties | Quadrant properties | ||||||
|---|---|---|---|---|---|---|---|
| Quadrant | DetID | PixID | Counts | Sigma | Mean | Median | Sigma |
| A | 8 | 15 | 126362 | 602.95 | 1007 | 984 | 207.9 |
| A | 12 | 189 | 81960 | 389.42 | 1007 | 984 | 207.9 |
| A | 3 | 1 | 9317 | 40.07 | 1007 | 984 | 207.9 |
| B | 0 | 189 | 227902 | 1161.21 | 992 | 966 | 195.4 |
| B | 0 | 229 | 115859 | 587.9 | 992 | 966 | 195.4 |
| B | 4 | 173 | 90081 | 455.99 | 992 | 966 | 195.4 |
| C | 3 | 233 | 763307 | 3369.28 | 967 | 972 | 226.3 |
| C | 14 | 234 | 13824 | 56.8 | 967 | 972 | 226.3 |
| C | 8 | 128 | 13172 | 53.92 | 967 | 972 | 226.3 |
| D | 2 | 120 | 348706 | 1478.58 | 966 | 941 | 235.2 |
| D | 12 | 110 | 146729 | 619.84 | 966 | 941 | 235.2 |
| D | 10 | 199 | 134042 | 565.9 | 966 | 941 | 235.2 |
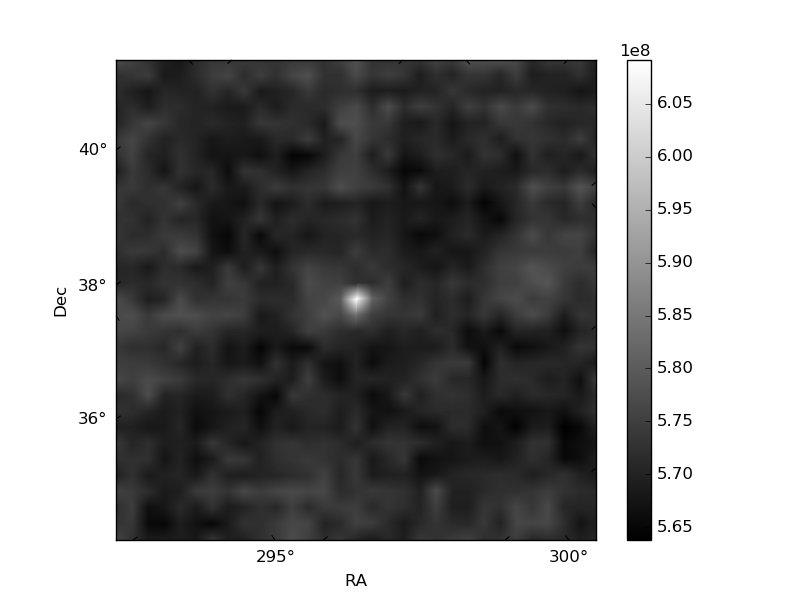
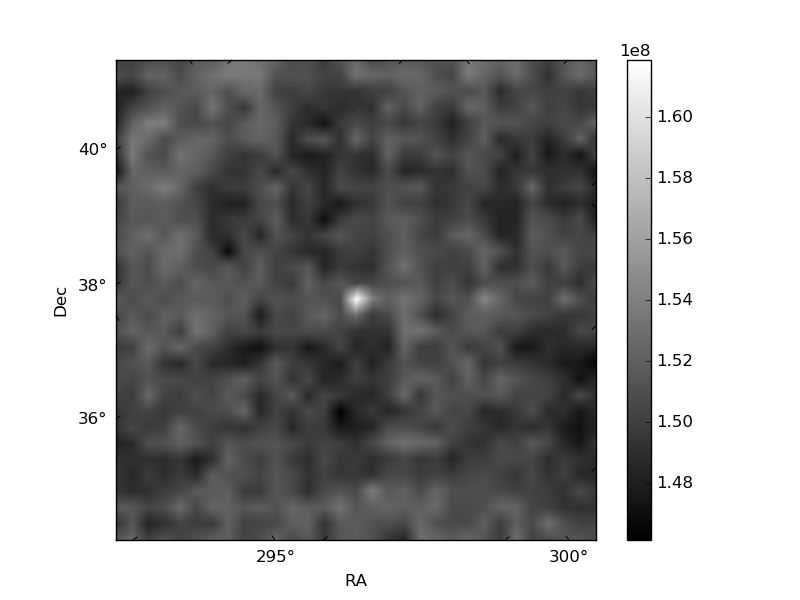
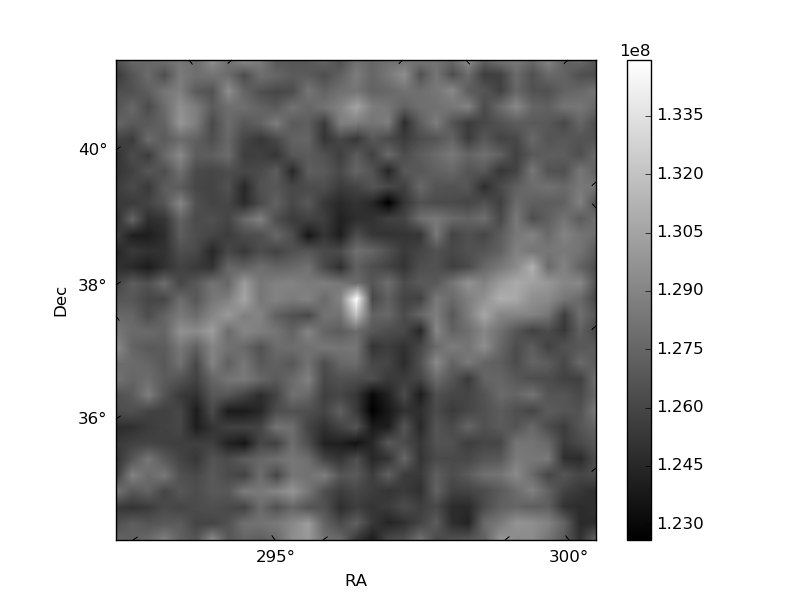
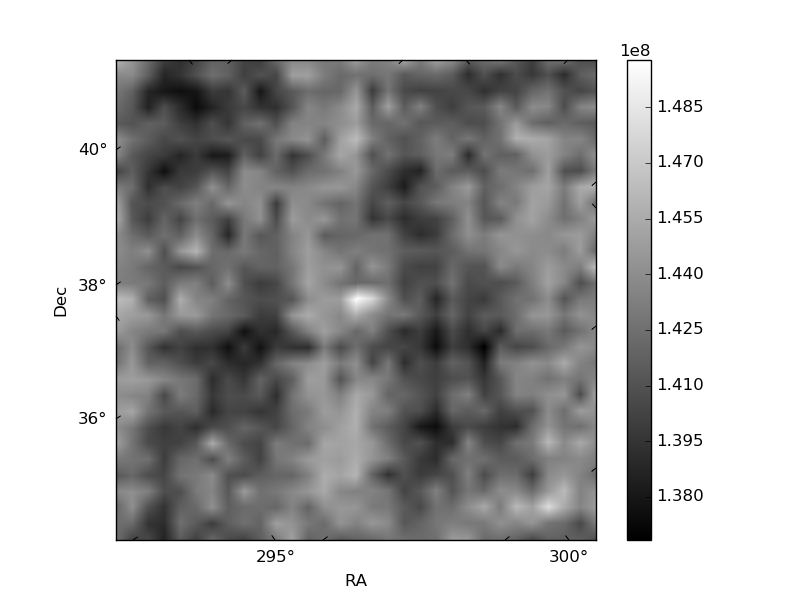
Histogram calculated using DETX and DETY for each event in the final _common_clean file
| Quadrant A | 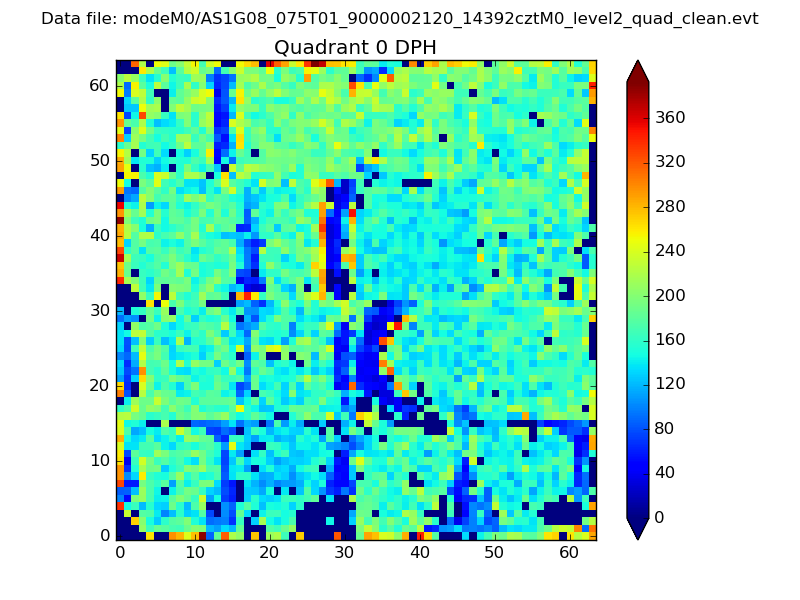 |
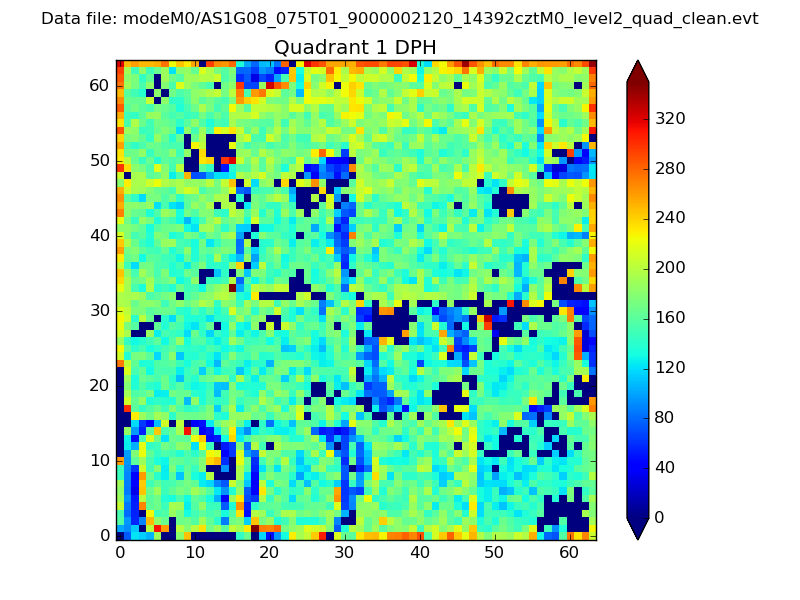 |
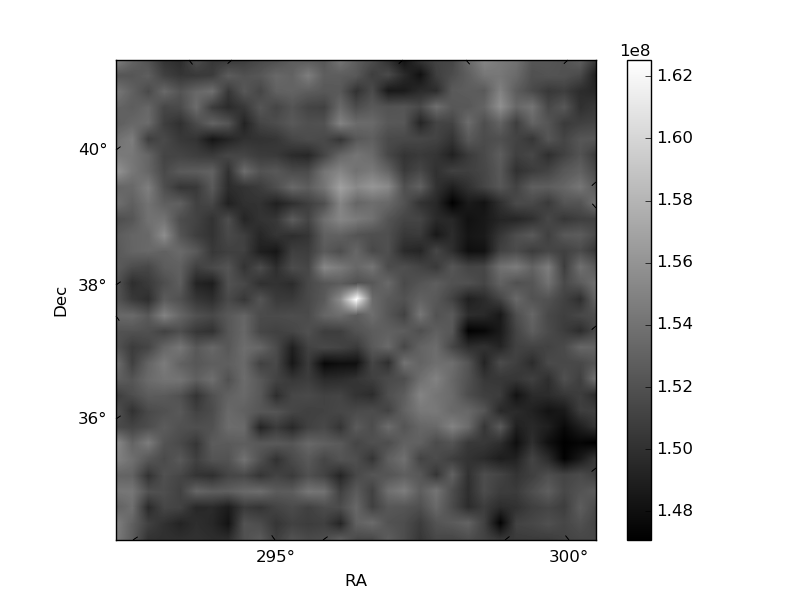
Quadrant B |
|---|---|---|---|
| Quadrant D | 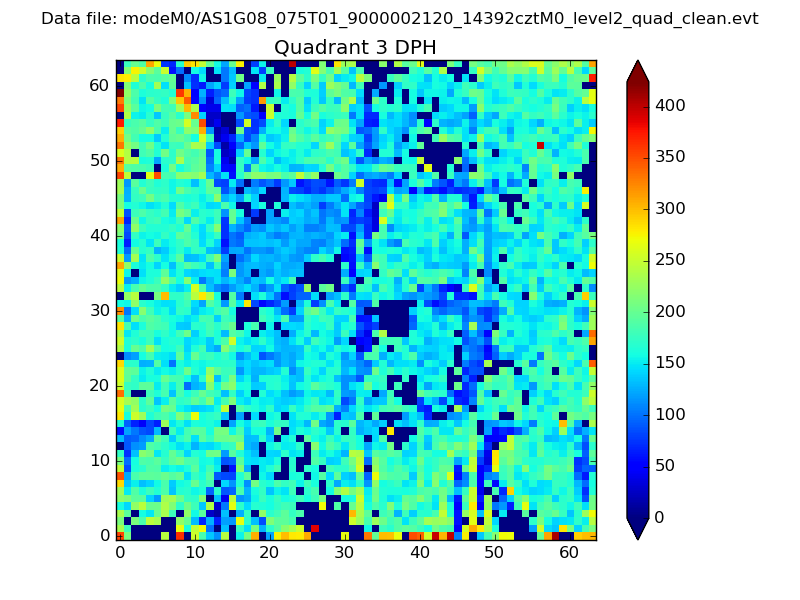 |
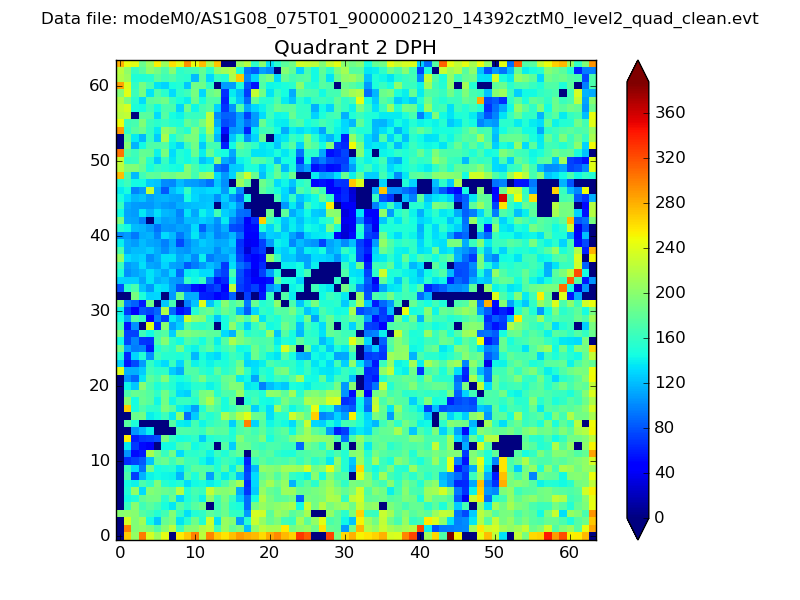 |
Quadrant C |
| Plot type | Count rate plots | Images |
|---|---|---|
| Comparison with Poisson distribution Blue bars denote a histogram of data divided into 1 sec bins. Red curve is a Poisson curve with rate = median count rate of data. |
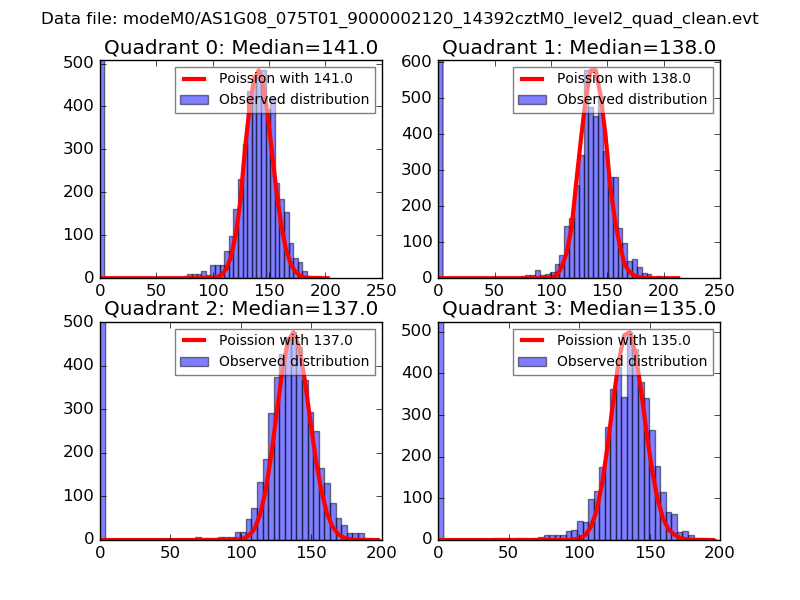 |
 |
| Quadrant-wise count rates Data is divided into 100 sec bins |
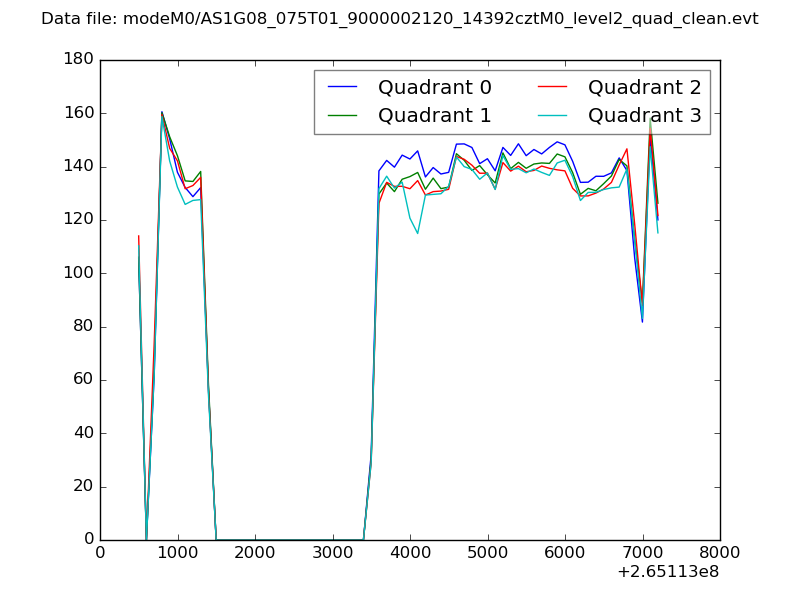 |
|
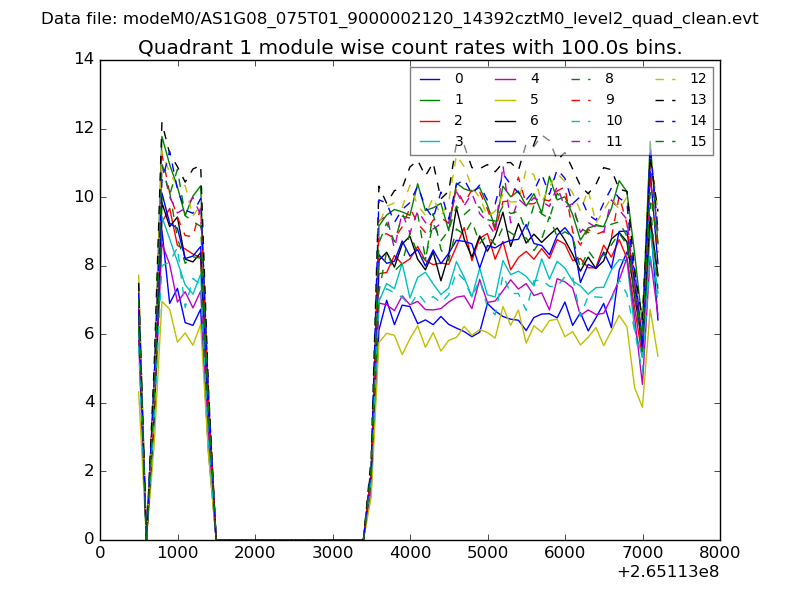
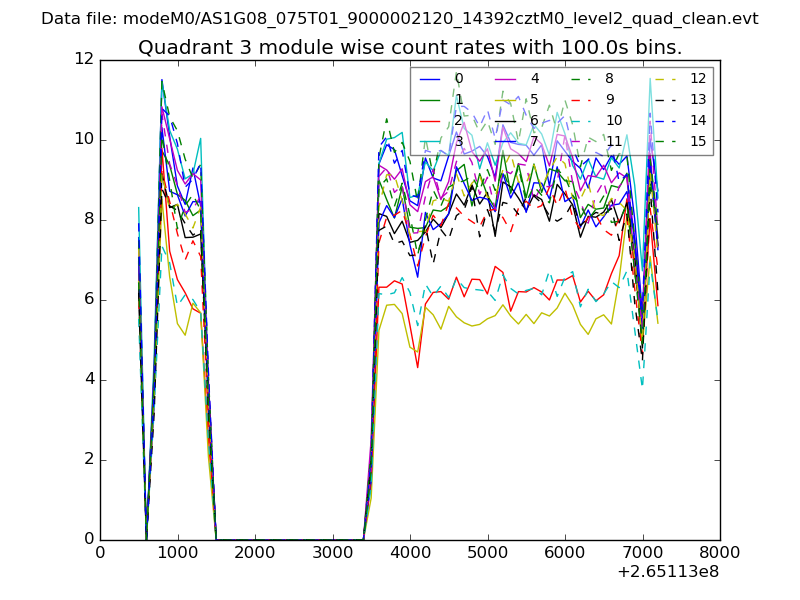
| Module-wise count rates for Quadrant A Data is divided into 100 sec bins |
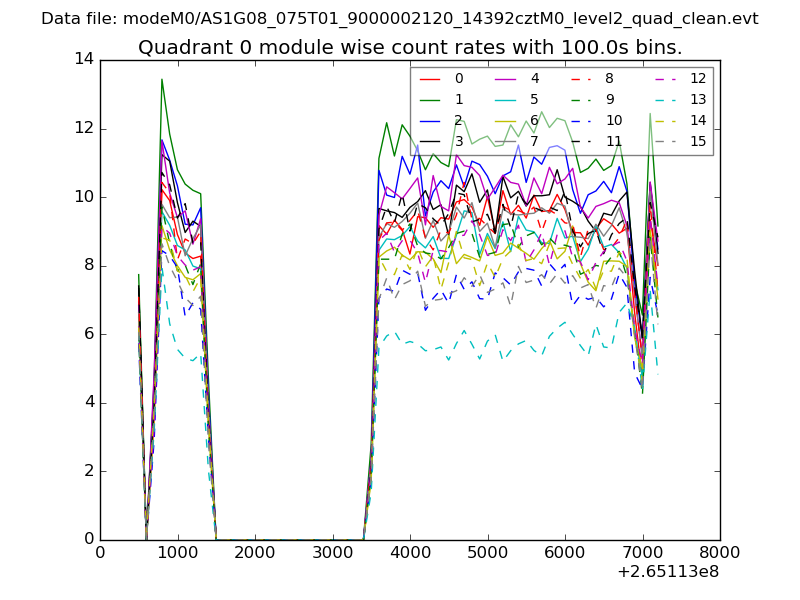 |
 |
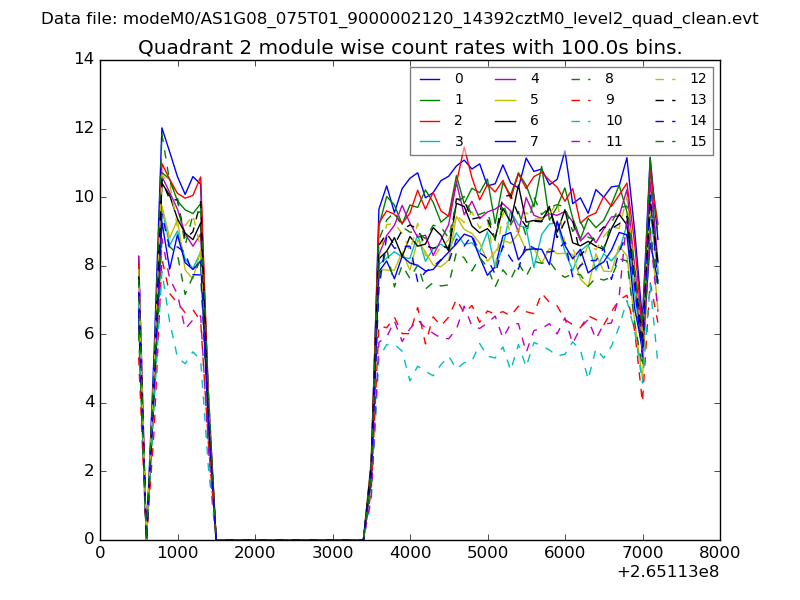
| Module-wise count rates for Quadrant B Data is divided into 100 sec bins |
 |
 |
| Module-wise count rates for Quadrant C Data is divided into 100 sec bins |
 |
 |
| Module-wise count rates for Quadrant D Data is divided into 100 sec bins |
 |
 |
| Parameter | Plot |
|---|---|
| CZT HV Monitor | 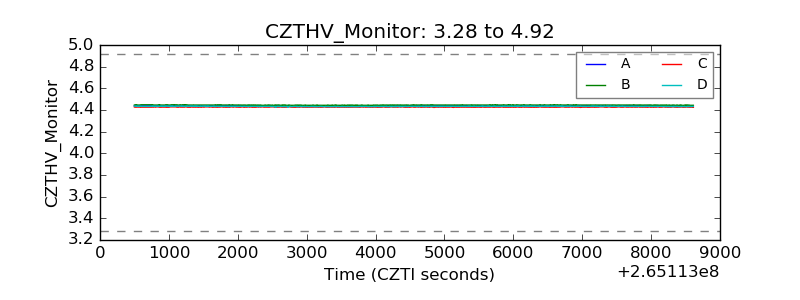 |
| D_VDD | 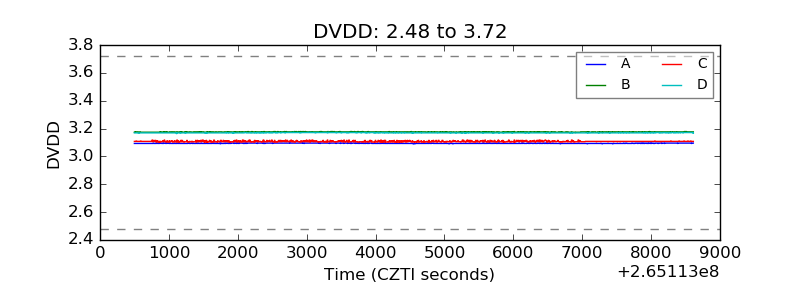 |
| Temperature 1 | 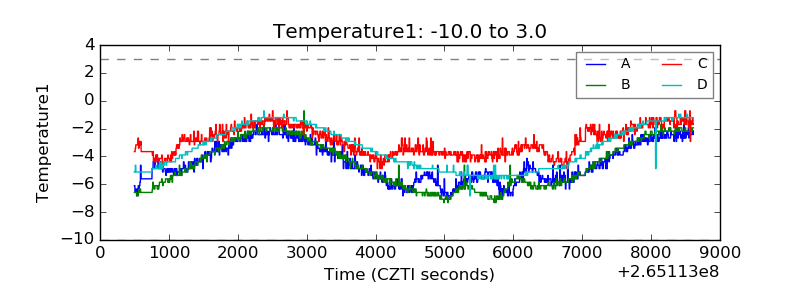 |
| Veto HV Monitor | 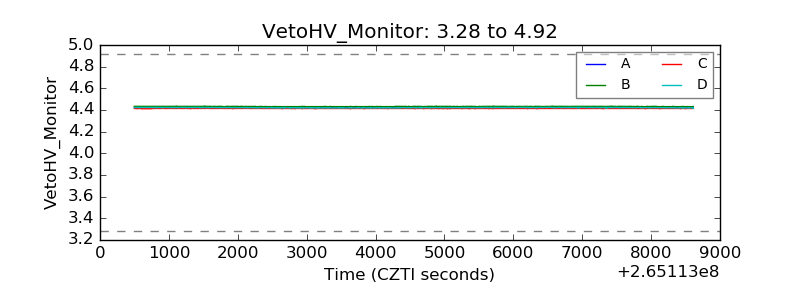 |
| Veto LLD | 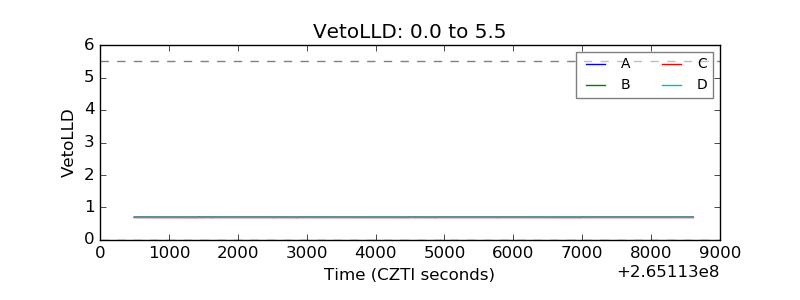 |
| Alpha Counter | 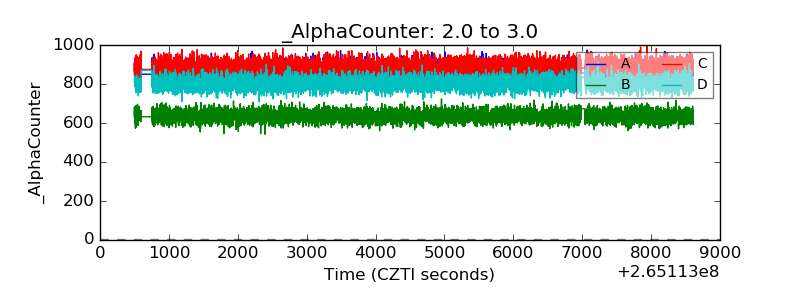 |
| _CPM_Rate | 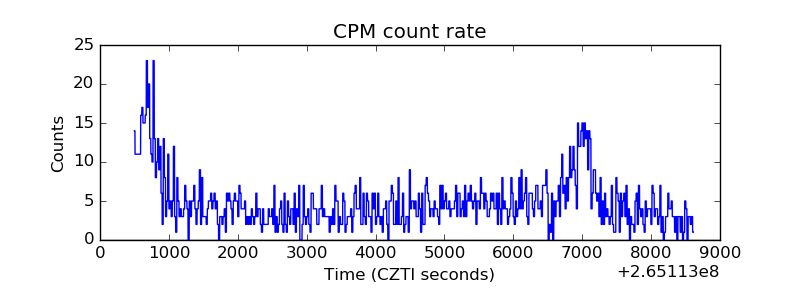 |
| CZT Counter | 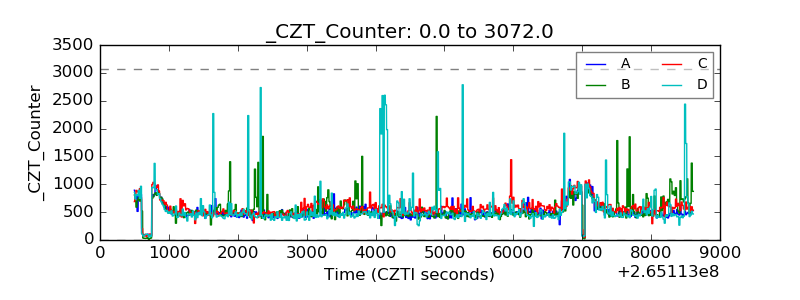 |
| +2.5 Volts monitor |  |
| +5 Volts monitor | 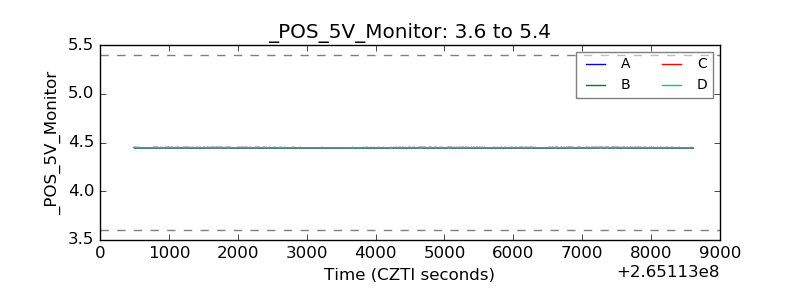 |
| _ROLL_ROT | 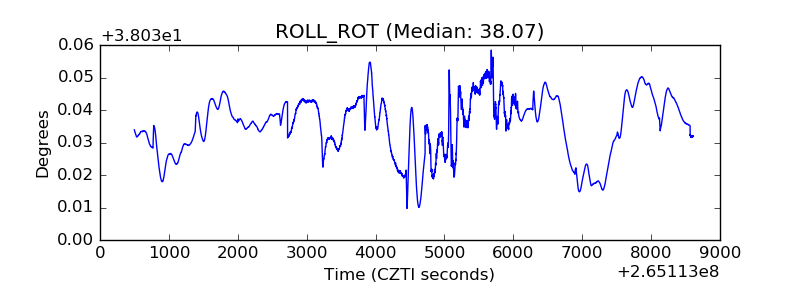 |
| _Roll_DEC | 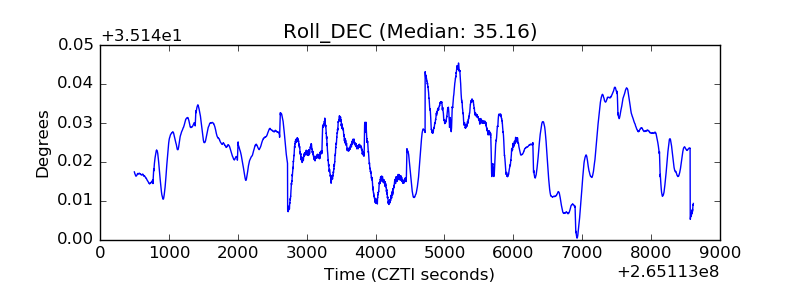 |
| _Roll_RA | 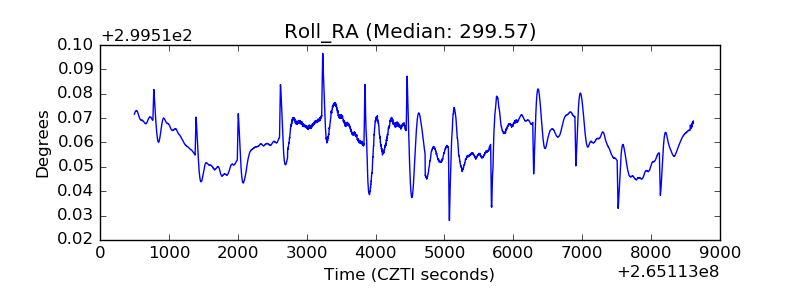 |
| Veto Counter | 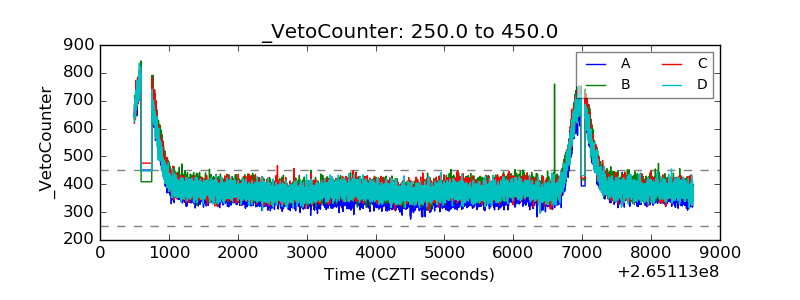 |