| Param | Original file | Final file |
|---|---|---|
| Filename | modeM0/AS1G08_075T01_9000002120_14393cztM0_level2.evt | modeM0/AS1G08_075T01_9000002120_14393cztM0_level2_quad_clean.evt |
| Size (bytes) | 236,712,960 | 22,965,120 |
| Size | 225.7 MB | 21.9 MB |
| Events in quadrant A | 1,575,440 | 121,703 |
| Events in quadrant B | 1,847,514 | 121,056 |
| Events in quadrant C | 1,808,940 | 118,494 |
| Events in quadrant D | 1,729,282 | 117,333 |
| Mode SS | |||
|---|---|---|---|
| Quadrant | BADHDUFLAG | Total packets | Discarded packets |
| A | 0 | 62 | 0 |
| B | 0 | 62 | 0 |
| C | 0 | 62 | 0 |
| D | 0 | 62 | 0 |
| Mode M0 | |||
|---|---|---|---|
| Quadrant | BADHDUFLAG | Total packets | Discarded packets |
| A | 0 | 6545 | 1 |
| B | 0 | 7424 | 1 |
| C | 0 | 7302 | 1 |
| D | 0 | 7116 | 1 |
| Mode M9 | |||
|---|---|---|---|
| Quadrant | BADHDUFLAG | Total packets | Discarded packets |
| A | 0 | 1 | 0 |
| B | 0 | 1 | 0 |
| C | 0 | 1 | 0 |
| D | 0 | 1 | 0 |
| Quadrant | Total seconds | Saturated seconds | Saturation percentage |
|---|---|---|---|
| A | 3035 | 126 | 4.151565% |
| B | 3035 | 151 | 4.975288% |
| C | 3035 | 99 | 3.261944% |
| D | 3035 | 141 | 4.645799% |
Noise dominated data is calculated using 1-second bins in cleaned event files. If a bin has >2000 counts, and if more than 50% of those come from <1% of pixels, then it is considered to be noise-dominated and hence unusable.
| Quadrant | # 1 sec bins | Bins with >0 counts | Bins with >2000 counts | High rate bins dominated by noise | Noise dominated (total time) | Noise dominated (detector-on time) | Marked lightcurve |
|---|---|---|---|---|---|---|---|
| A | 3091 | 3036 | 16 | 16 | 0.52% | 0.53% | 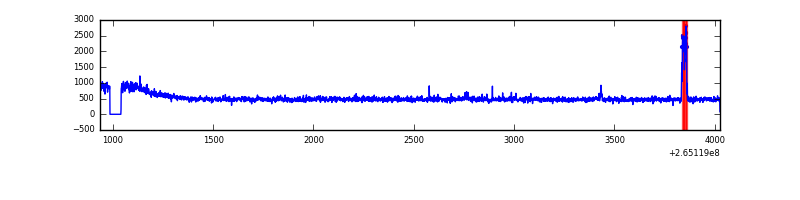 |
| B | 3091 | 3036 | 13 | 13 | 0.42% | 0.43% | 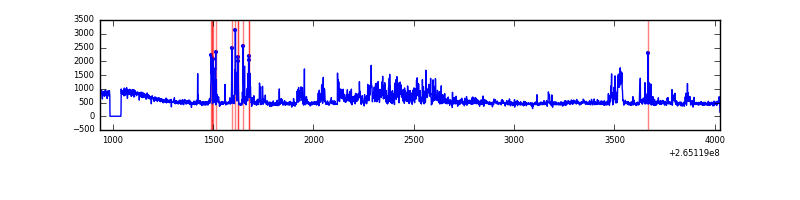 |
| C | 3091 | 3037 | 0 | 0 | 0.00% | 0.00% | 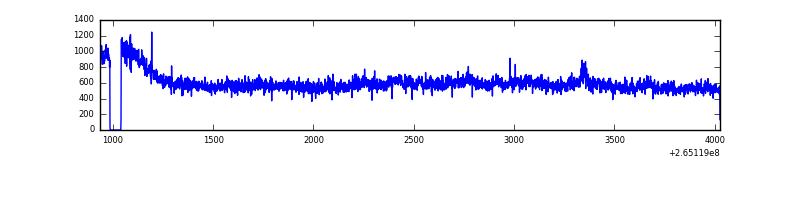 |
| D | 3091 | 3036 | 40 | 40 | 1.29% | 1.32% | 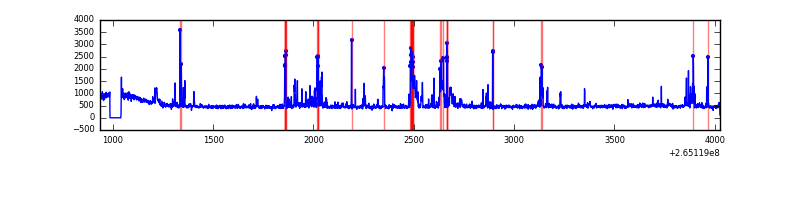 |
Top three noisy pixels from each quadrant. If the there are fewer than three noisy pixels in the level2.evt file, extra rows are filled as -1
| Pixel properties | Quadrant properties | ||||||
|---|---|---|---|---|---|---|---|
| Quadrant | DetID | PixID | Counts | Sigma | Mean | Median | Sigma |
| A | 15 | 69 | 46716 | 575.02 | 385 | 375 | 80.6 |
| A | 8 | 15 | 25618 | 313.23 | 385 | 375 | 80.6 |
| A | 12 | 189 | 15205 | 184.02 | 385 | 375 | 80.6 |
| B | 0 | 189 | 192414 | 2551.39 | 378 | 367 | 75.3 |
| B | 4 | 173 | 50651 | 668.03 | 378 | 367 | 75.3 |
| B | 0 | 190 | 38037 | 500.45 | 378 | 367 | 75.3 |
| C | 3 | 233 | 374282 | 4362.74 | 366 | 367 | 85.7 |
| C | 13 | 61 | 2705 | 27.28 | 366 | 367 | 85.7 |
| C | 3 | 232 | 2157 | 20.89 | 366 | 367 | 85.7 |
| D | 12 | 110 | 138964 | 1462.79 | 370 | 360 | 94.8 |
| D | 2 | 120 | 69504 | 729.73 | 370 | 360 | 94.8 |
| D | 10 | 199 | 53177 | 557.42 | 370 | 360 | 94.8 |
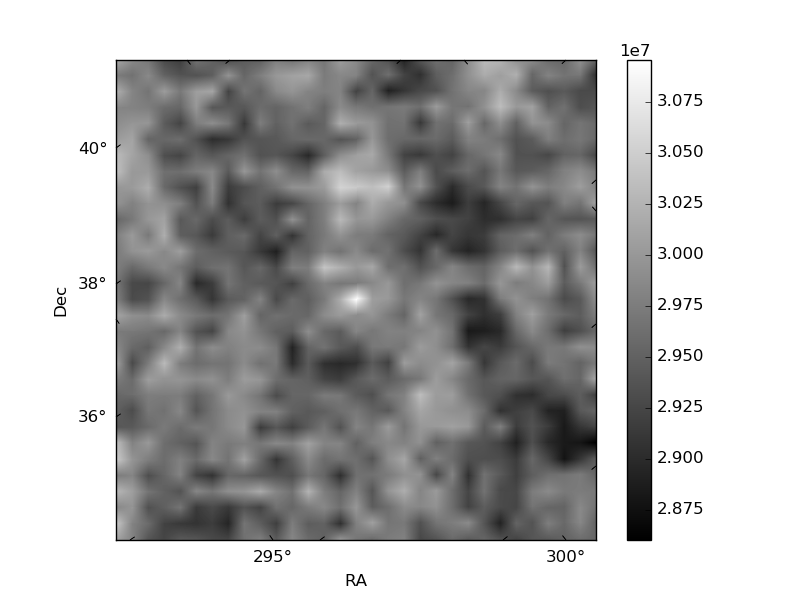
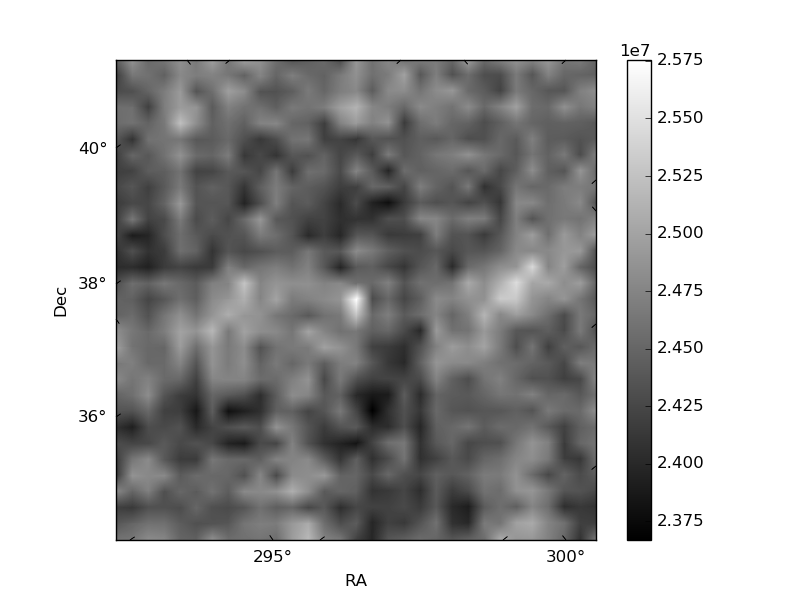
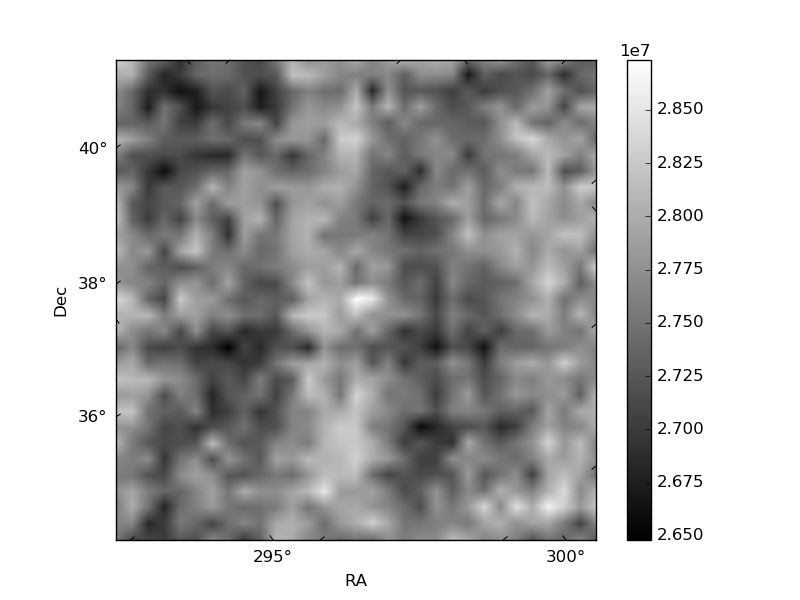
Histogram calculated using DETX and DETY for each event in the final _common_clean file
| Quadrant A | 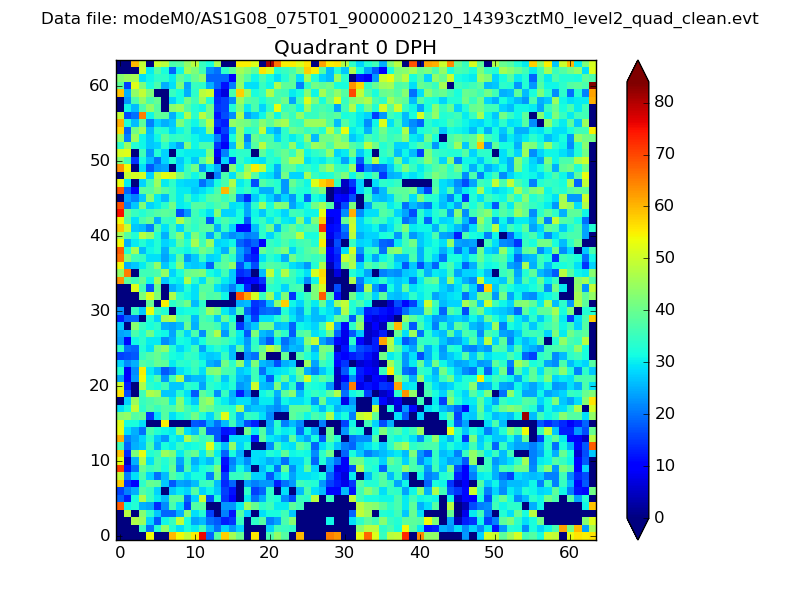 |
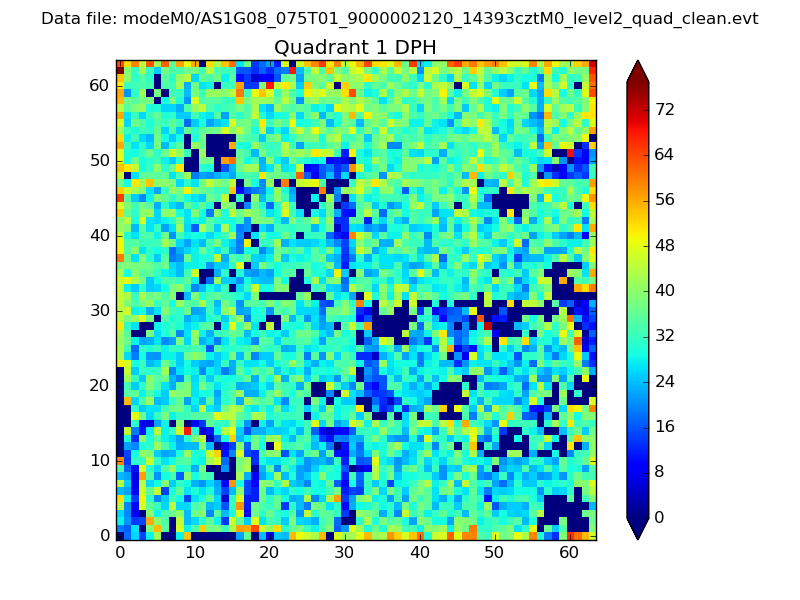 |
Quadrant B |
|---|---|---|---|
| Quadrant D | 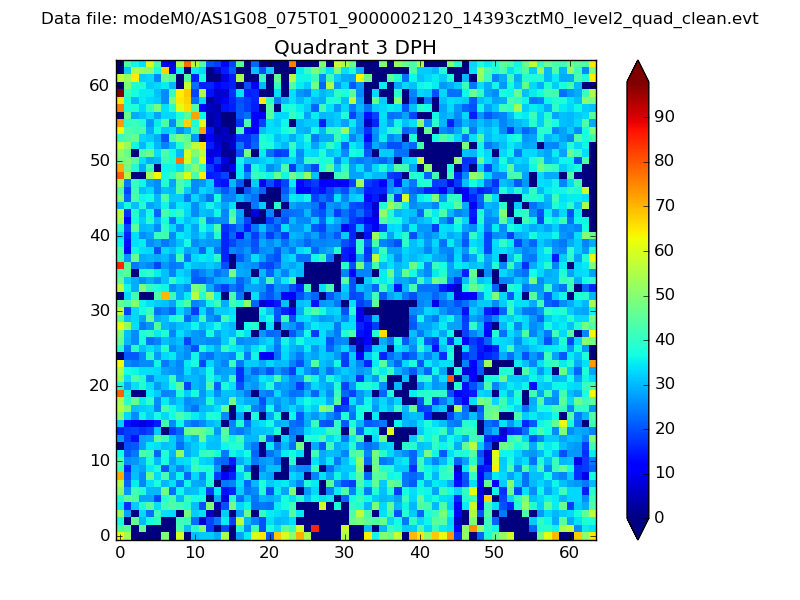 |
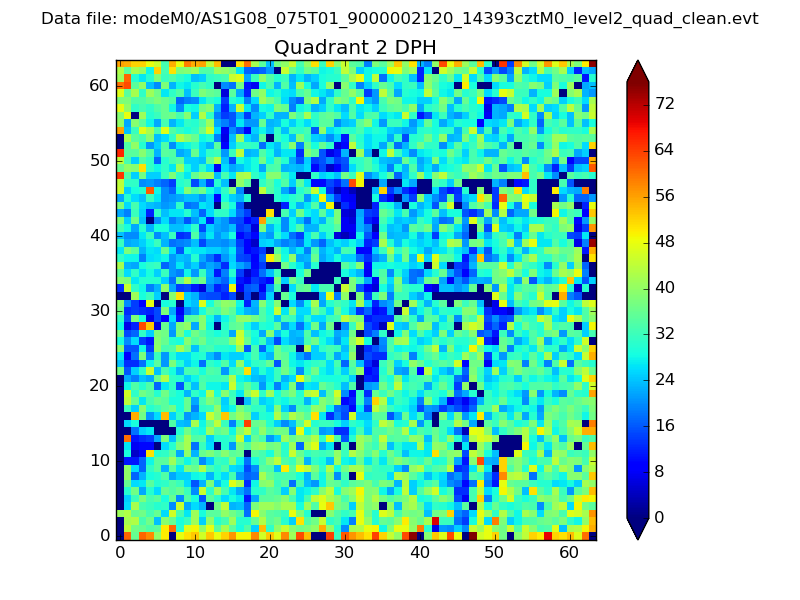 |
Quadrant C |
| Plot type | Count rate plots | Images |
|---|---|---|
| Comparison with Poisson distribution Blue bars denote a histogram of data divided into 1 sec bins. Red curve is a Poisson curve with rate = median count rate of data. |
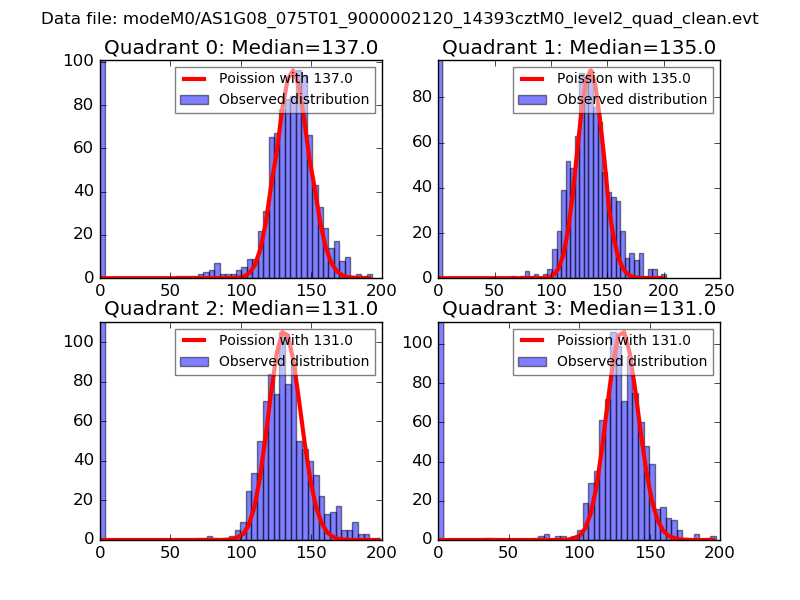 |
 |
| Quadrant-wise count rates Data is divided into 100 sec bins |
 |
|
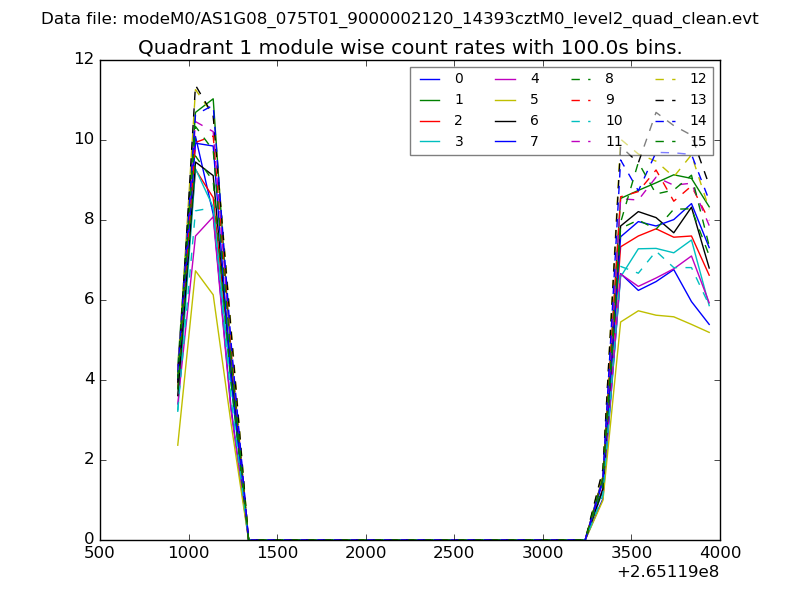
| Module-wise count rates for Quadrant A Data is divided into 100 sec bins |
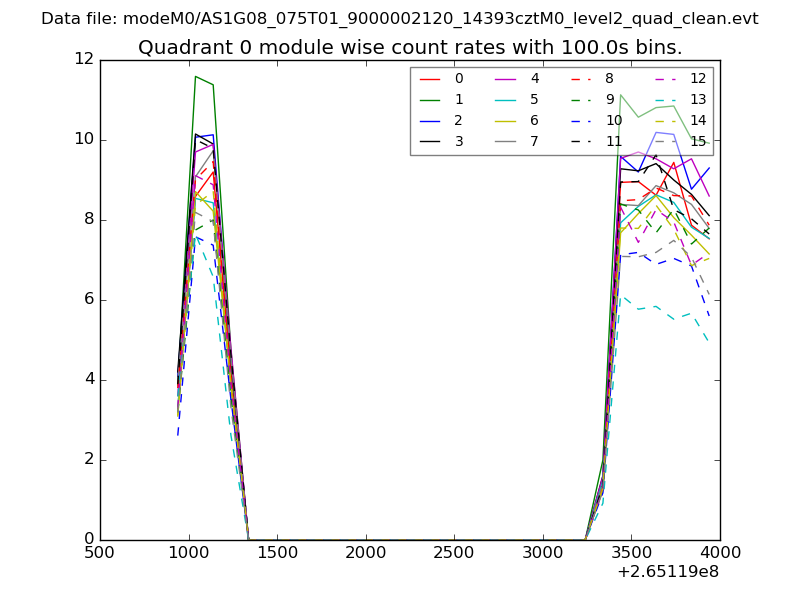 |
 |
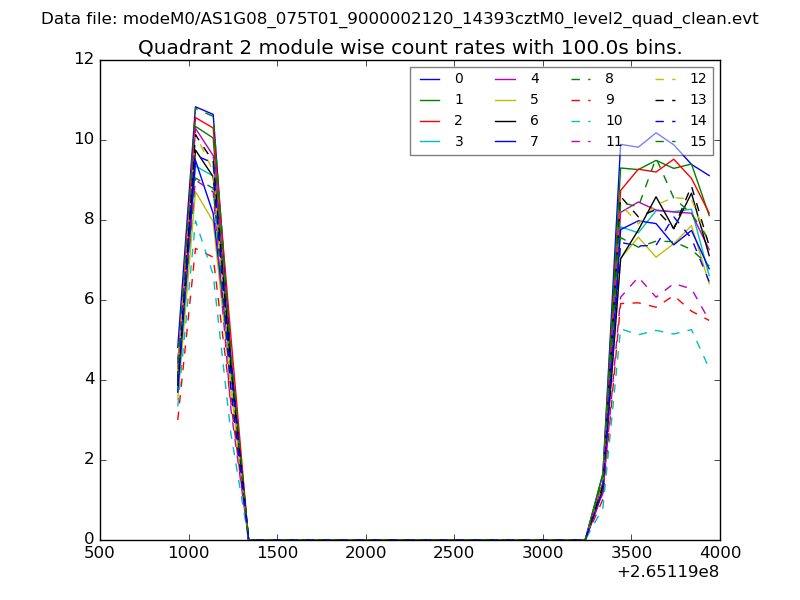
| Module-wise count rates for Quadrant B Data is divided into 100 sec bins |
 |
 |
| Module-wise count rates for Quadrant C Data is divided into 100 sec bins |
 |
 |
| Module-wise count rates for Quadrant D Data is divided into 100 sec bins |
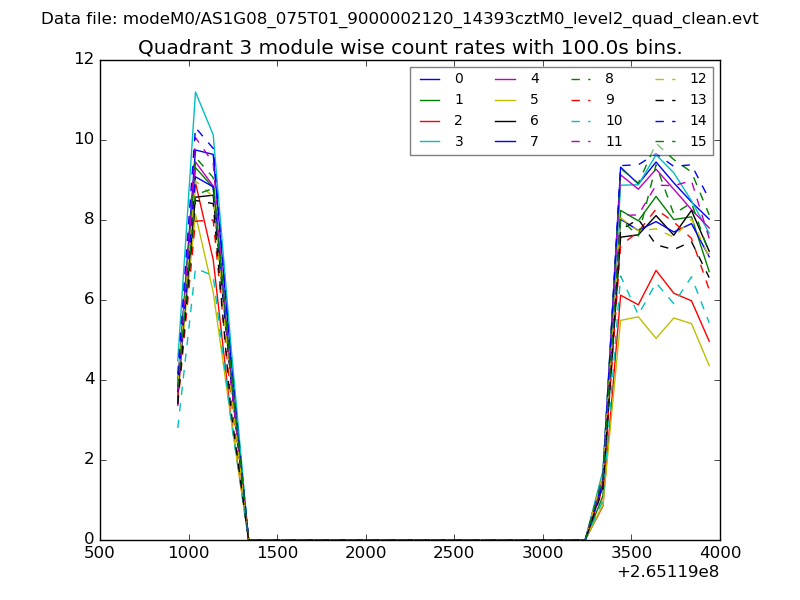 |
 |
| Parameter | Plot |
|---|---|
| CZT HV Monitor | 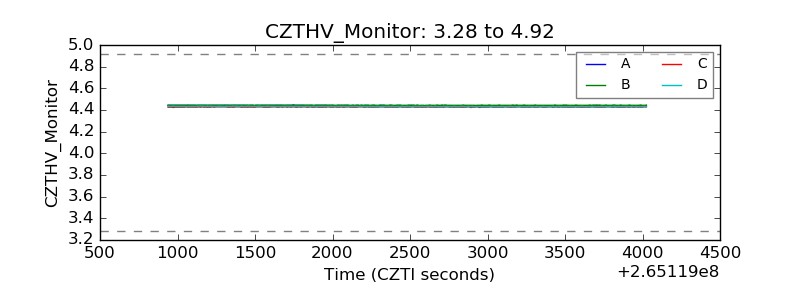 |
| D_VDD | 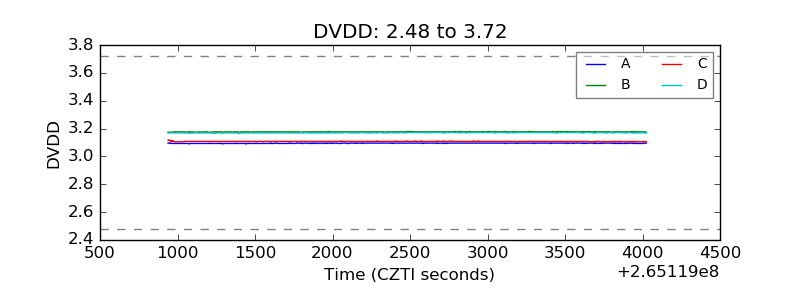 |
| Temperature 1 | 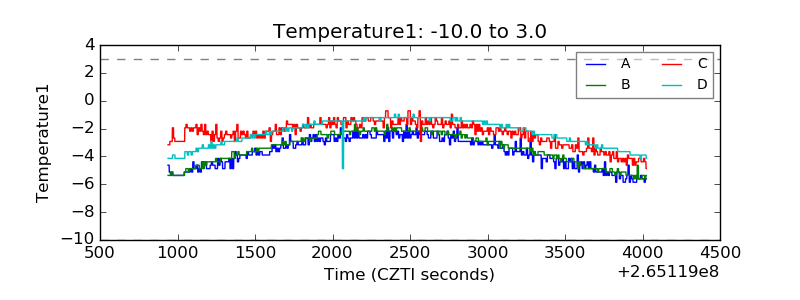 |
| Veto HV Monitor | 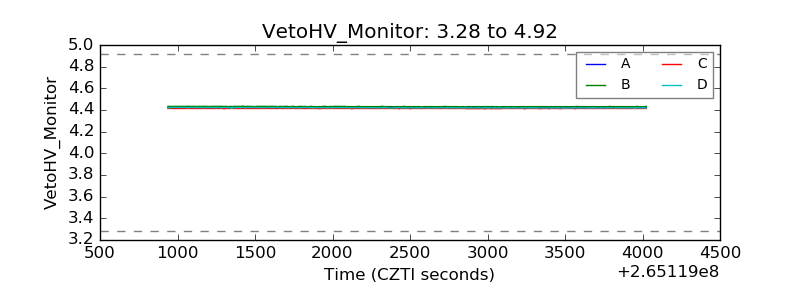 |
| Veto LLD | 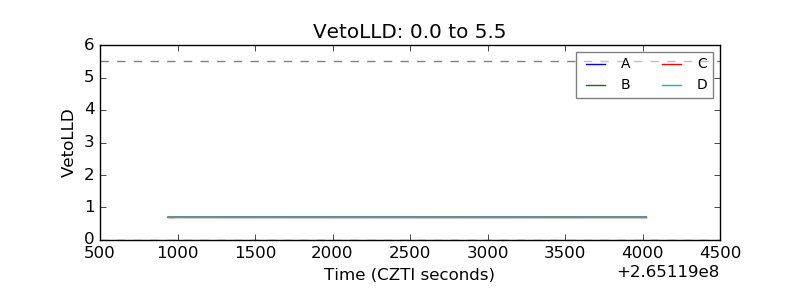 |
| Alpha Counter |  |
| _CPM_Rate |  |
| CZT Counter | 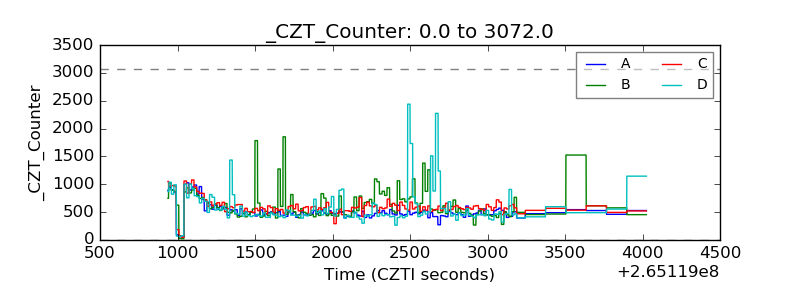 |
| +2.5 Volts monitor |  |
| +5 Volts monitor |  |
| _ROLL_ROT | 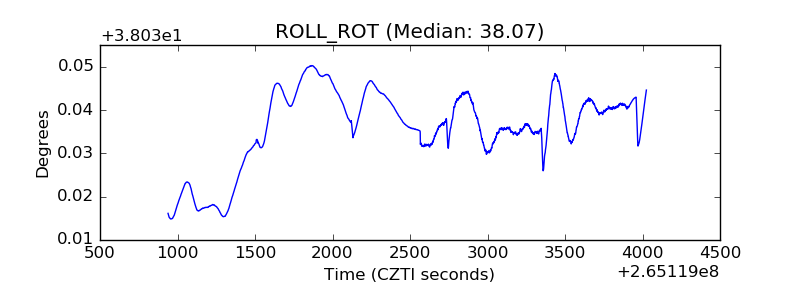 |
| _Roll_DEC | 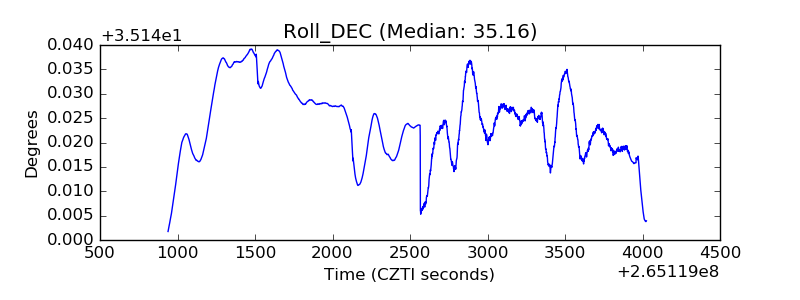 |
| _Roll_RA | 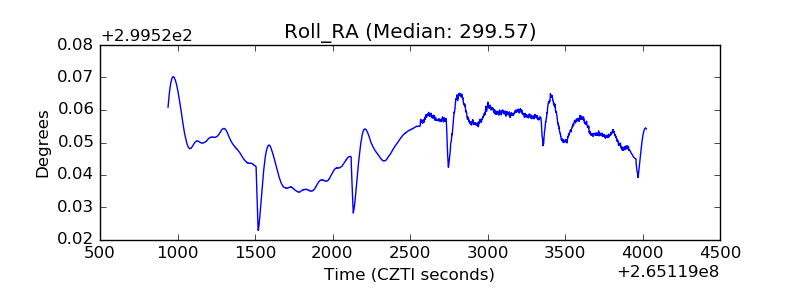 |
| Veto Counter | 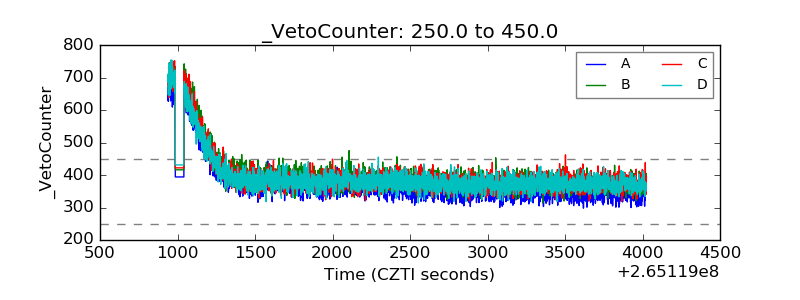 |