| Param | Original file | Final file |
|---|---|---|
| Filename | modeM0/AS1G08_066T04_9000002122_14395cztM0_level2.evt | modeM0/AS1G08_066T04_9000002122_14395cztM0_level2_quad_clean.evt |
| Size (bytes) | 943,263,360 | 169,994,880 |
| Size | 899.6 MB | 162.1 MB |
| Events in quadrant A | 7,140,421 | 1,094,725 |
| Events in quadrant B | 6,534,716 | 1,097,515 |
| Events in quadrant C | 7,381,982 | 1,043,911 |
| Events in quadrant D | 6,657,491 | 1,041,248 |
| Mode SS | |||
|---|---|---|---|
| Quadrant | BADHDUFLAG | Total packets | Discarded packets |
| A | 0 | 258 | 0 |
| B | 0 | 258 | 0 |
| C | 0 | 258 | 0 |
| D | 0 | 258 | 0 |
| Mode M0 | |||
|---|---|---|---|
| Quadrant | BADHDUFLAG | Total packets | Discarded packets |
| A | 0 | 29315 | 3 |
| B | 0 | 27642 | 2 |
| C | 0 | 30076 | 2 |
| D | 0 | 28327 | 2 |
| Mode M9 | |||
|---|---|---|---|
| Quadrant | BADHDUFLAG | Total packets | Discarded packets |
| A | 0 | 12 | 0 |
| B | 0 | 12 | 0 |
| C | 0 | 12 | 0 |
| D | 0 | 12 | 0 |
| Quadrant | Total seconds | Saturated seconds | Saturation percentage |
|---|---|---|---|
| A | 12602 | 148 | 1.174417% |
| B | 12602 | 218 | 1.729884% |
| C | 12602 | 90 | 0.714172% |
| D | 12602 | 134 | 1.063323% |
Noise dominated data is calculated using 1-second bins in cleaned event files. If a bin has >2000 counts, and if more than 50% of those come from <1% of pixels, then it is considered to be noise-dominated and hence unusable.
| Quadrant | # 1 sec bins | Bins with >0 counts | Bins with >2000 counts | High rate bins dominated by noise | Noise dominated (total time) | Noise dominated (detector-on time) | Marked lightcurve |
|---|---|---|---|---|---|---|---|
| A | 13878 | 12603 | 22 | 22 | 0.16% | 0.17% | 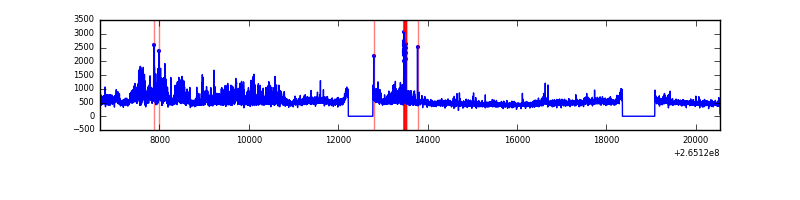 |
| B | 13878 | 12603 | 69 | 69 | 0.50% | 0.55% | 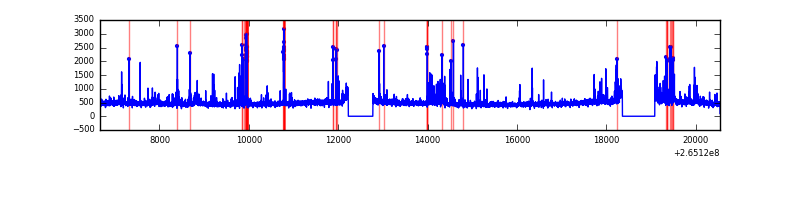 |
| C | 13878 | 12603 | 5 | 5 | 0.04% | 0.04% | 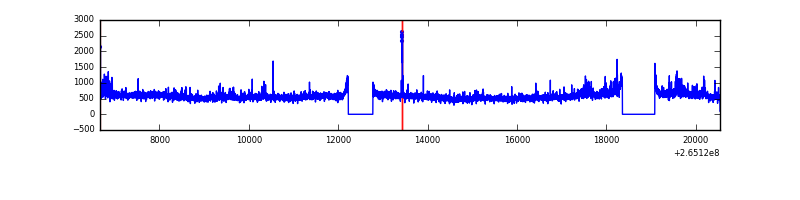 |
| D | 13878 | 12604 | 74 | 74 | 0.53% | 0.59% | 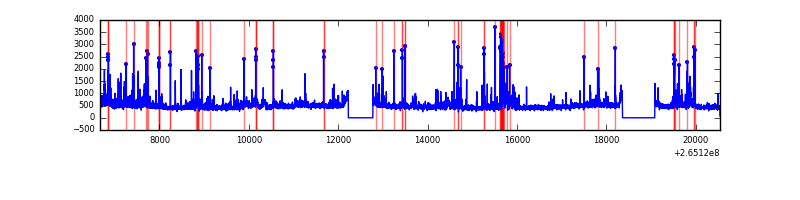 |
Top three noisy pixels from each quadrant. If the there are fewer than three noisy pixels in the level2.evt file, extra rows are filled as -1
| Pixel properties | Quadrant properties | ||||||
|---|---|---|---|---|---|---|---|
| Quadrant | DetID | PixID | Counts | Sigma | Mean | Median | Sigma |
| A | 8 | 15 | 1335820 | 4441.18 | 1480 | 1442 | 300.5 |
| A | 15 | 69 | 58905 | 191.25 | 1480 | 1442 | 300.5 |
| A | 12 | 189 | 26673 | 83.98 | 1480 | 1442 | 300.5 |
| B | 0 | 229 | 305546 | 1085.05 | 1478 | 1439 | 280.3 |
| B | 4 | 142 | 144804 | 511.53 | 1478 | 1439 | 280.3 |
| B | 0 | 189 | 99277 | 349.09 | 1478 | 1439 | 280.3 |
| C | 3 | 233 | 1768276 | 5361.0 | 1429 | 1434 | 329.6 |
| C | 14 | 234 | 29064 | 83.84 | 1429 | 1434 | 329.6 |
| C | 13 | 61 | 10361 | 27.09 | 1429 | 1434 | 329.6 |
| D | 2 | 120 | 431807 | 1147.89 | 1424 | 1391 | 375.0 |
| D | 10 | 199 | 316418 | 840.16 | 1424 | 1391 | 375.0 |
| D | 1 | 52 | 166524 | 440.4 | 1424 | 1391 | 375.0 |
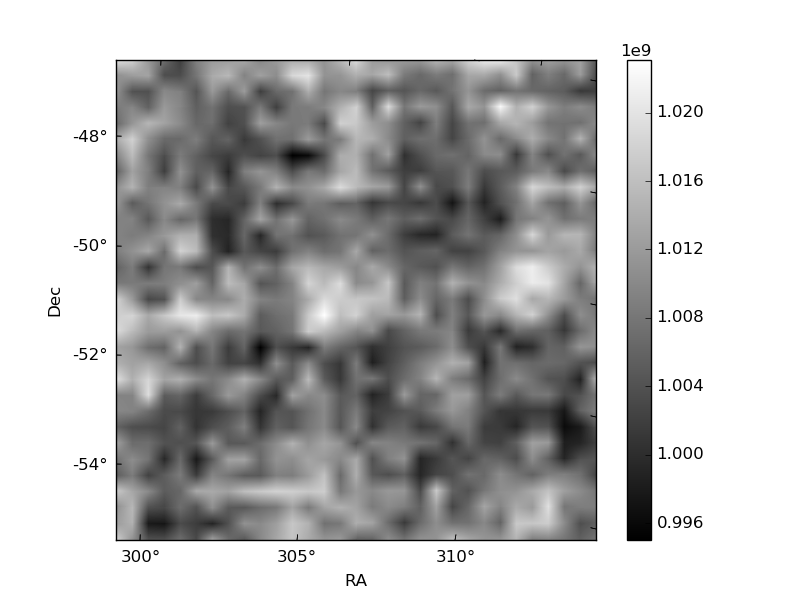
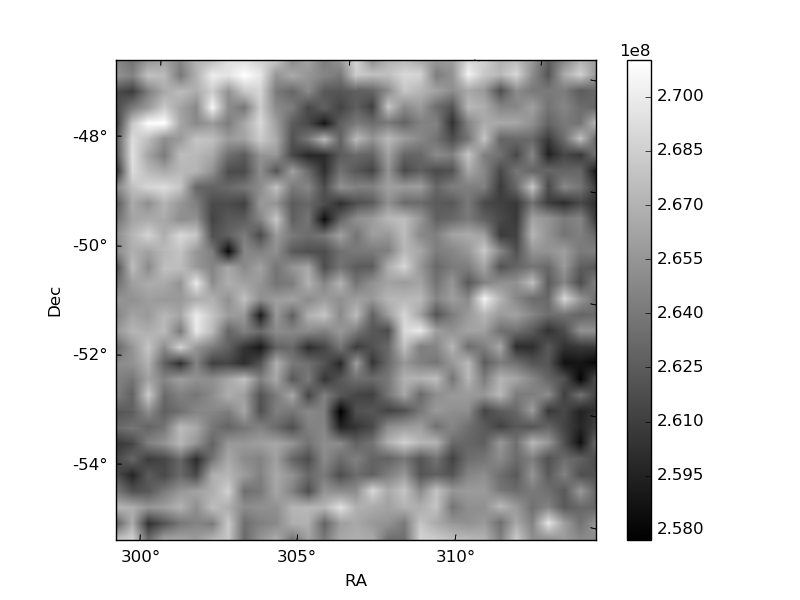
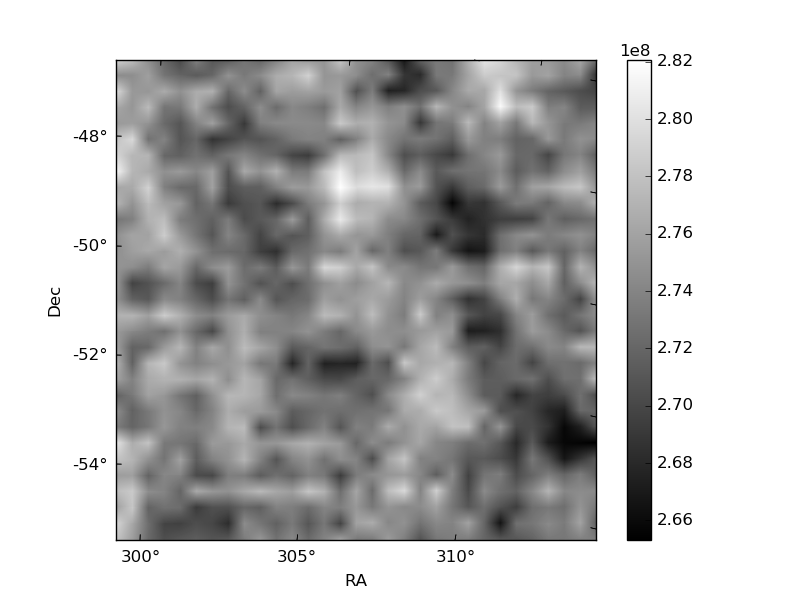
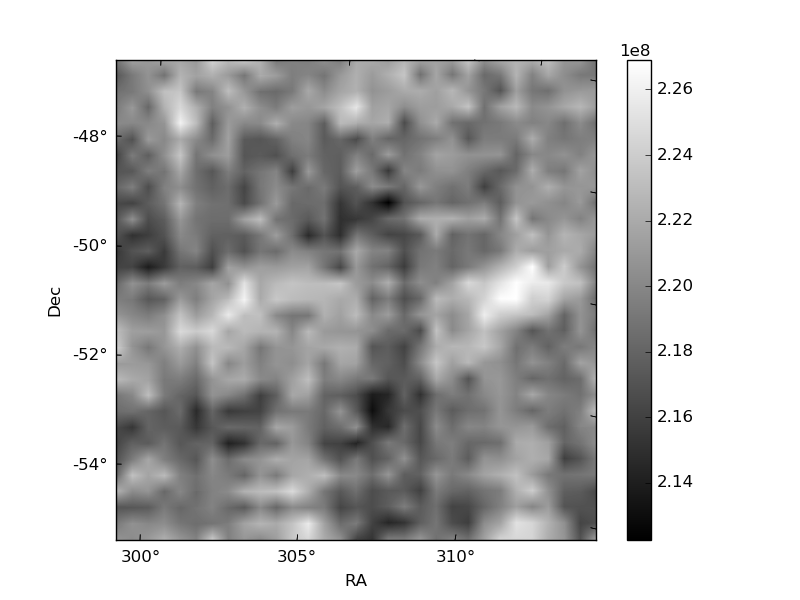
Histogram calculated using DETX and DETY for each event in the final _common_clean file
| Quadrant A | 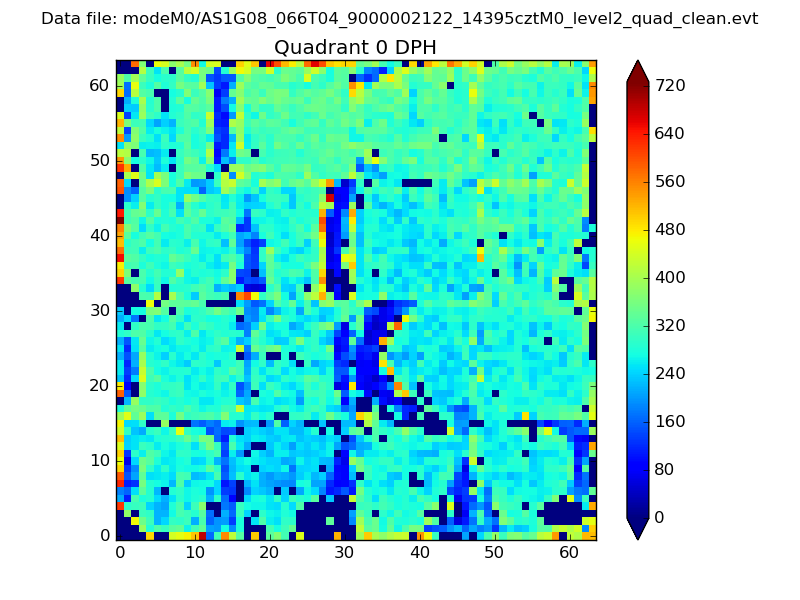 |
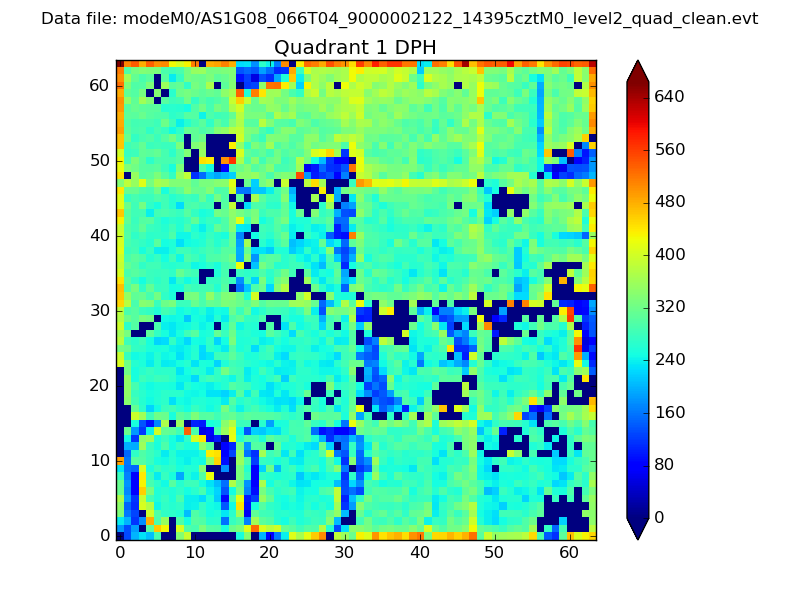 |
Quadrant B |
|---|---|---|---|
| Quadrant D | 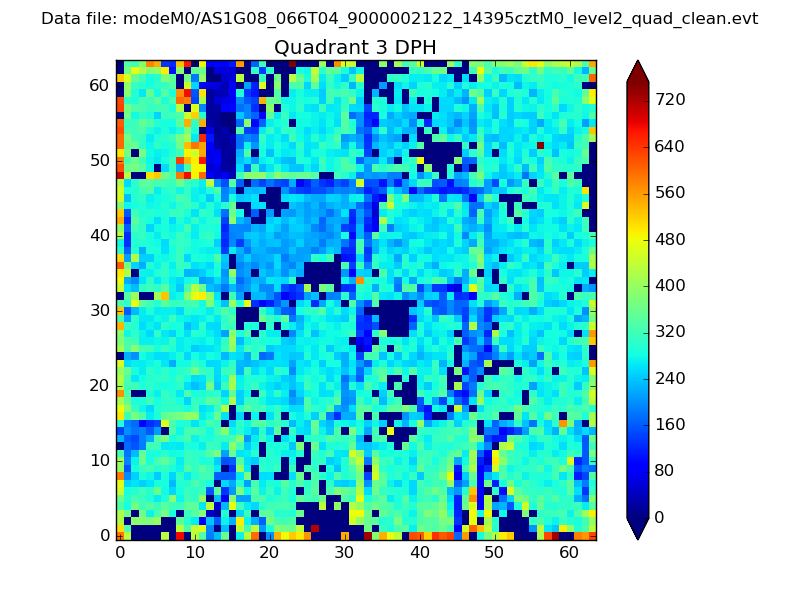 |
 |
Quadrant C |
| Plot type | Count rate plots | Images |
|---|---|---|
| Comparison with Poisson distribution Blue bars denote a histogram of data divided into 1 sec bins. Red curve is a Poisson curve with rate = median count rate of data. |
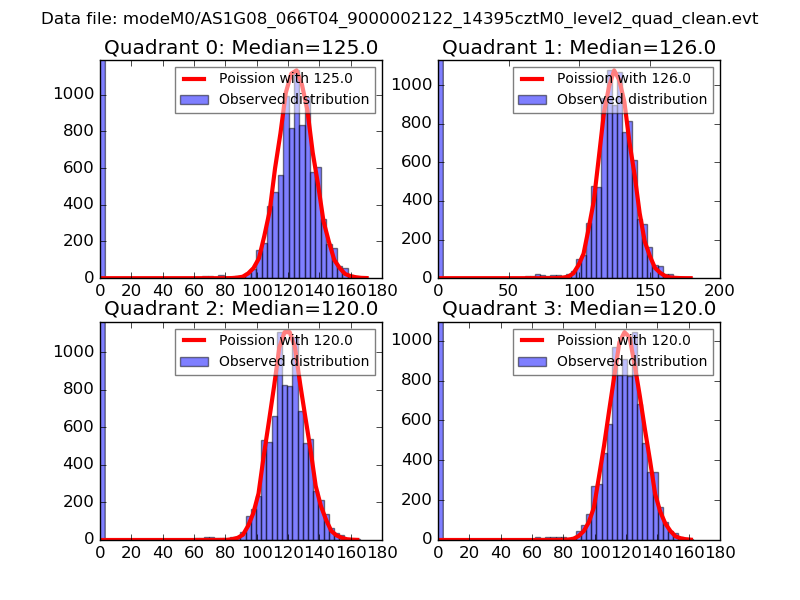 |
 |
| Quadrant-wise count rates Data is divided into 100 sec bins |
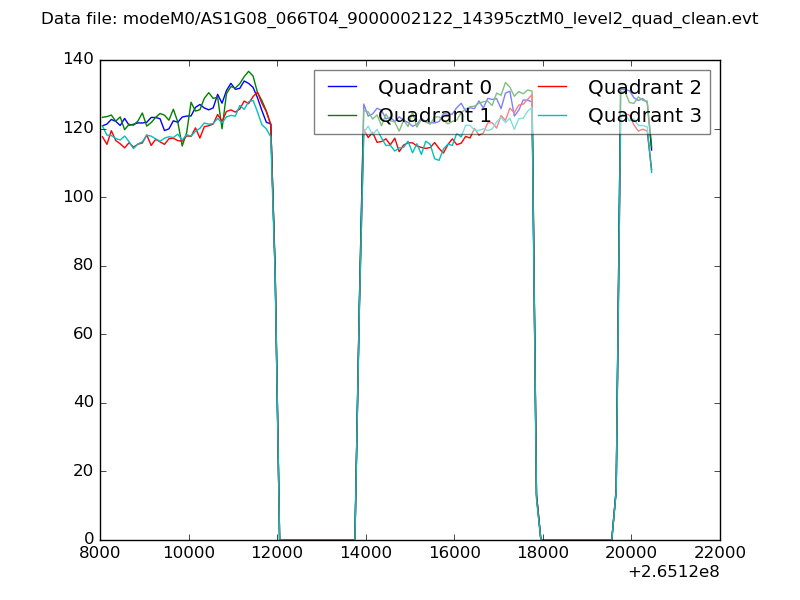 |
|
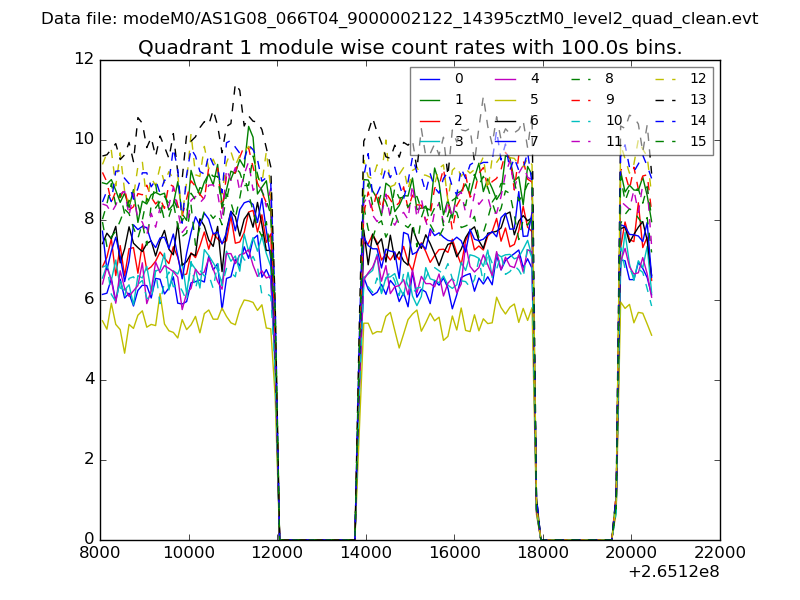
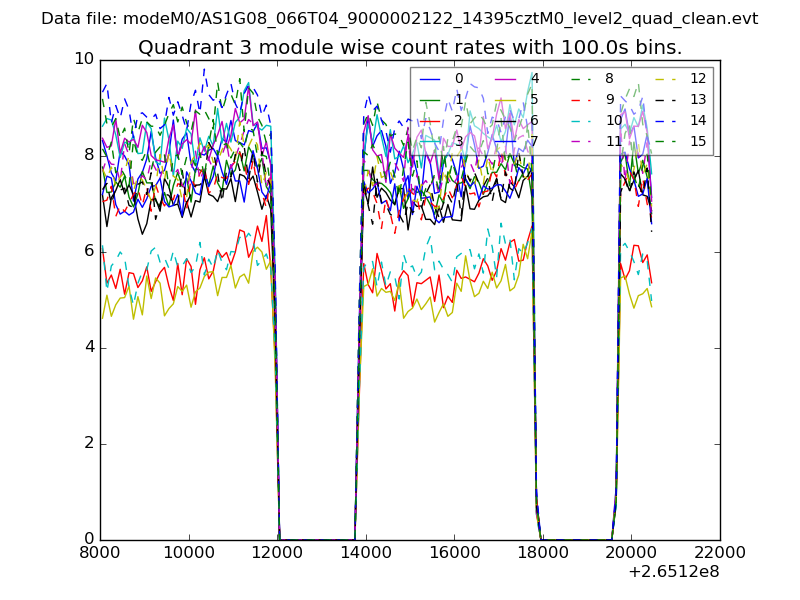
| Module-wise count rates for Quadrant A Data is divided into 100 sec bins |
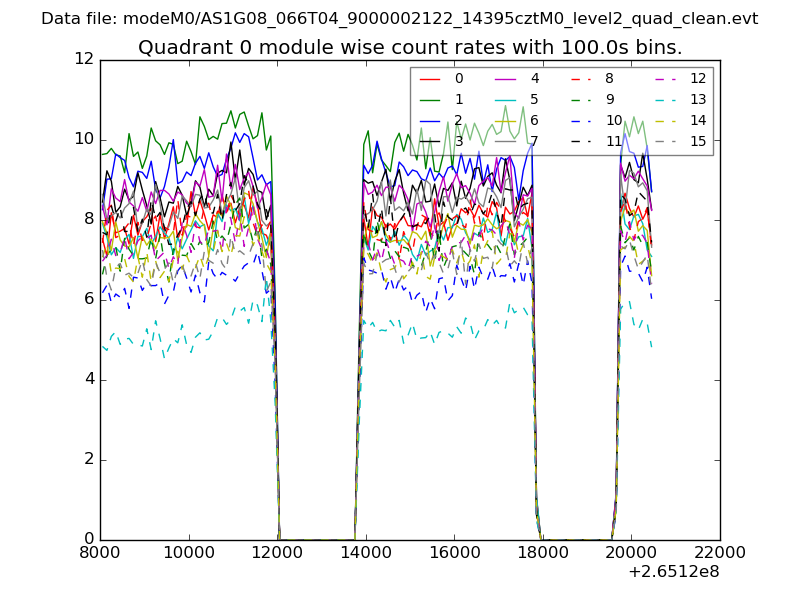 |
 |
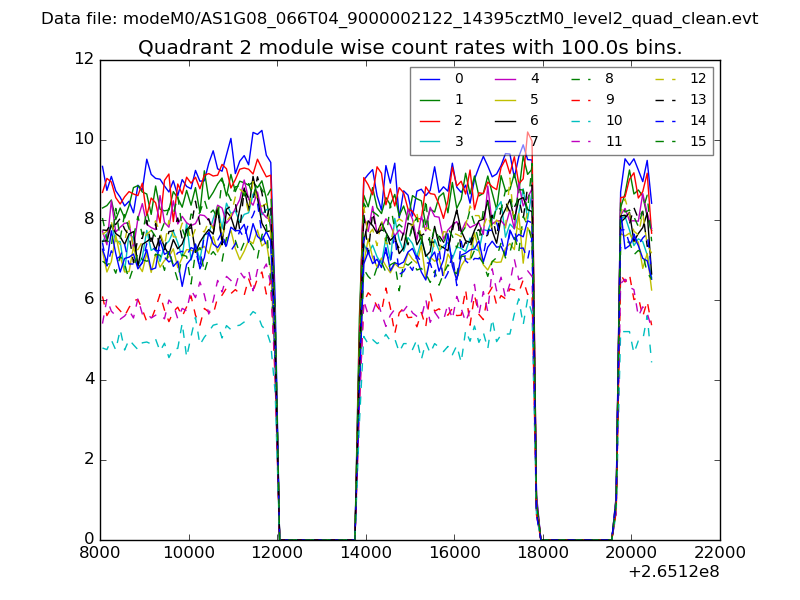
| Module-wise count rates for Quadrant B Data is divided into 100 sec bins |
 |
 |
| Module-wise count rates for Quadrant C Data is divided into 100 sec bins |
 |
 |
| Module-wise count rates for Quadrant D Data is divided into 100 sec bins |
 |
 |
| Parameter | Plot |
|---|---|
| CZT HV Monitor | 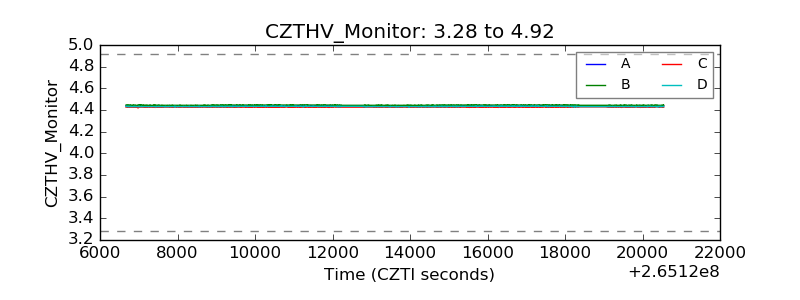 |
| D_VDD | 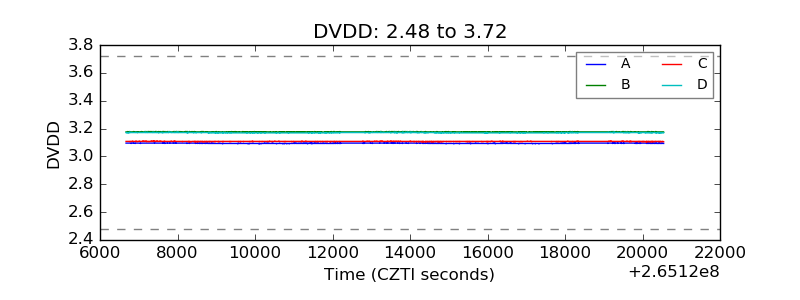 |
| Temperature 1 | 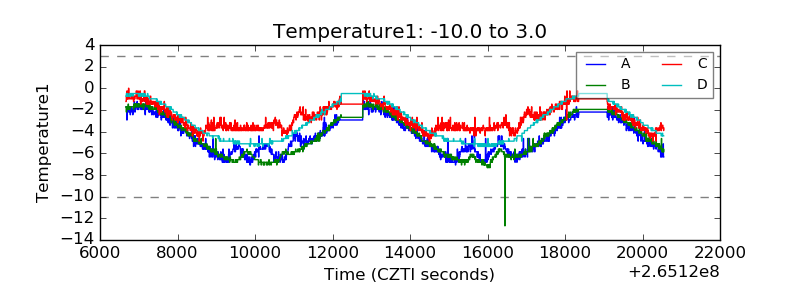 |
| Veto HV Monitor |  |
| Veto LLD | 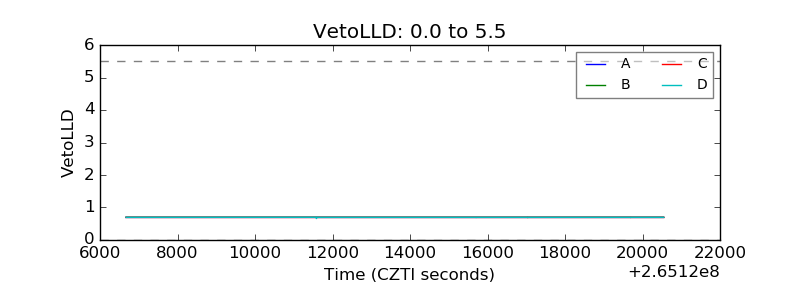 |
| Alpha Counter | 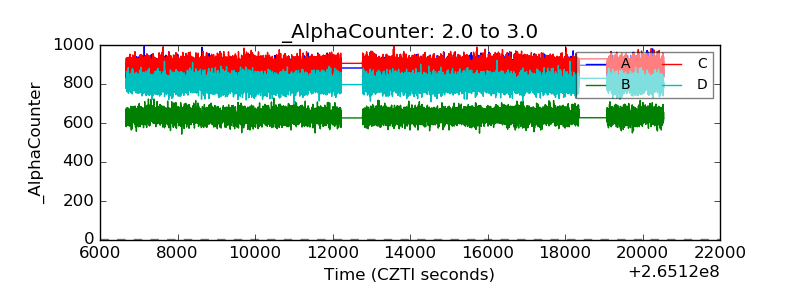 |
| _CPM_Rate |  |
| CZT Counter | 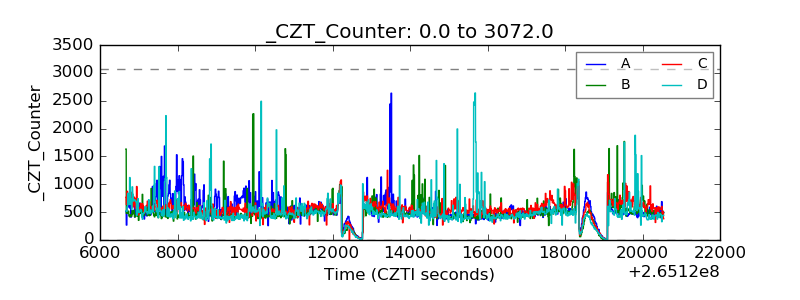 |
| +2.5 Volts monitor |  |
| +5 Volts monitor |  |
| _ROLL_ROT | 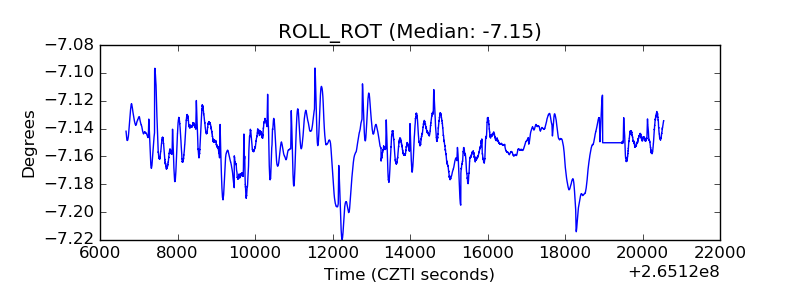 |
| _Roll_DEC | 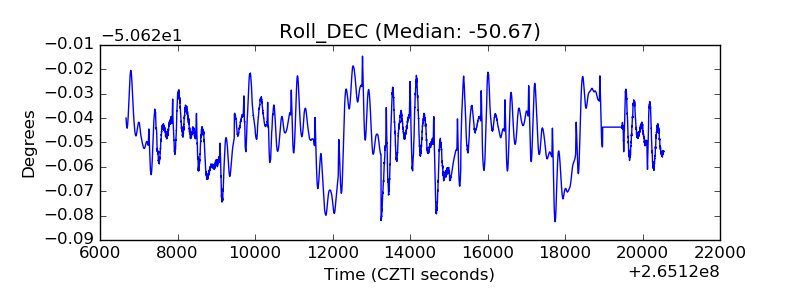 |
| _Roll_RA | 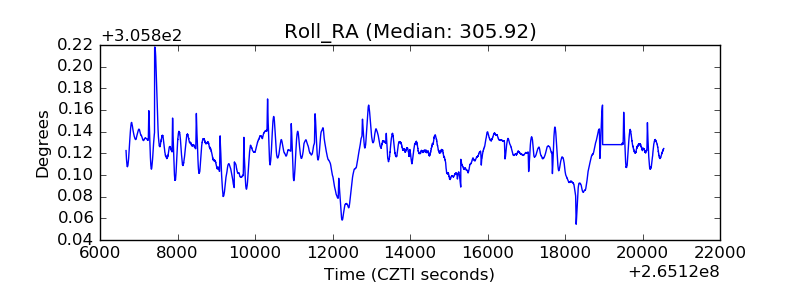 |
| Veto Counter | 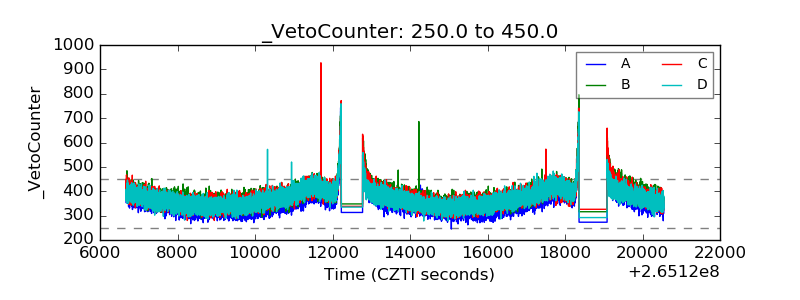 |