| Param | Original file | Final file |
|---|---|---|
| Filename | modeM0/AS1G08_066T04_9000002122_14396cztM0_level2.evt | modeM0/AS1G08_066T04_9000002122_14396cztM0_level2_quad_clean.evt |
| Size (bytes) | 543,945,600 | 104,184,000 |
| Size | 518.7 MB | 99.4 MB |
| Events in quadrant A | 3,579,938 | 676,217 |
| Events in quadrant B | 3,917,724 | 677,965 |
| Events in quadrant C | 4,724,832 | 640,419 |
| Events in quadrant D | 3,746,912 | 643,429 |
| Mode SS | |||
|---|---|---|---|
| Quadrant | BADHDUFLAG | Total packets | Discarded packets |
| A | 0 | 152 | 0 |
| B | 0 | 152 | 0 |
| C | 0 | 152 | 0 |
| D | 0 | 152 | 0 |
| Mode M0 | |||
|---|---|---|---|
| Quadrant | BADHDUFLAG | Total packets | Discarded packets |
| A | 0 | 15416 | 3 |
| B | 0 | 16540 | 2 |
| C | 0 | 19392 | 2 |
| D | 0 | 16224 | 2 |
| Mode M9 | |||
|---|---|---|---|
| Quadrant | BADHDUFLAG | Total packets | Discarded packets |
| A | 0 | 17 | 0 |
| B | 0 | 17 | 0 |
| C | 0 | 17 | 0 |
| D | 0 | 17 | 0 |
| Quadrant | Total seconds | Saturated seconds | Saturation percentage |
|---|---|---|---|
| A | 7433 | 77 | 1.035921% |
| B | 7433 | 140 | 1.883493% |
| C | 7433 | 55 | 0.739943% |
| D | 7433 | 71 | 0.955200% |
Noise dominated data is calculated using 1-second bins in cleaned event files. If a bin has >2000 counts, and if more than 50% of those come from <1% of pixels, then it is considered to be noise-dominated and hence unusable.
| Quadrant | # 1 sec bins | Bins with >0 counts | Bins with >2000 counts | High rate bins dominated by noise | Noise dominated (total time) | Noise dominated (detector-on time) | Marked lightcurve |
|---|---|---|---|---|---|---|---|
| A | 9074 | 7434 | 2 | 2 | 0.02% | 0.03% | 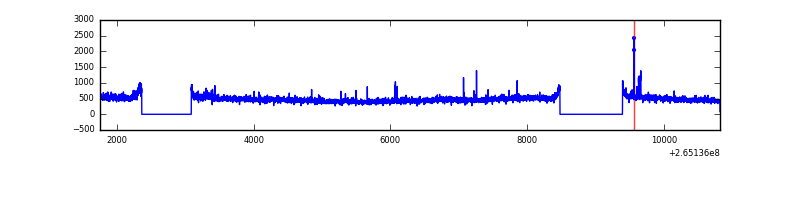 |
| B | 9074 | 7435 | 19 | 19 | 0.21% | 0.26% | 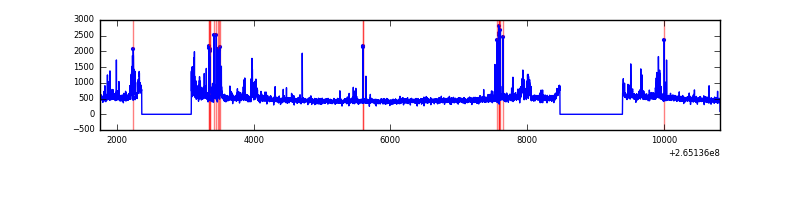 |
| C | 9074 | 7435 | 0 | 0 | 0.00% | 0.00% | 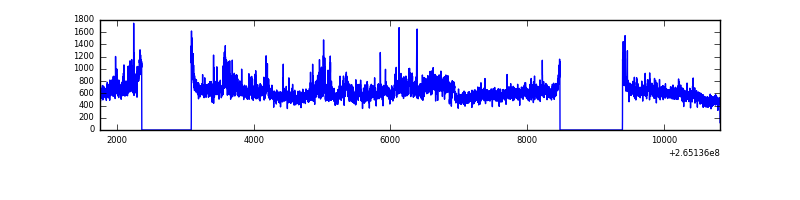 |
| D | 9074 | 7435 | 28 | 28 | 0.31% | 0.38% | 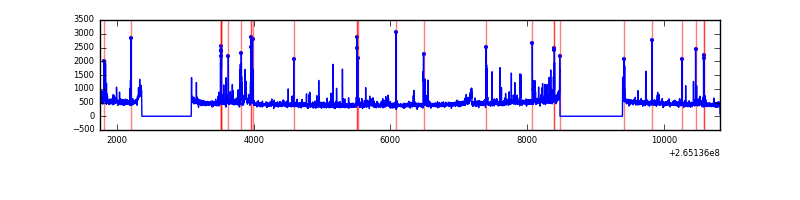 |
Top three noisy pixels from each quadrant. If the there are fewer than three noisy pixels in the level2.evt file, extra rows are filled as -1
| Pixel properties | Quadrant properties | ||||||
|---|---|---|---|---|---|---|---|
| Quadrant | DetID | PixID | Counts | Sigma | Mean | Median | Sigma |
| A | 8 | 15 | 65679 | 355.9 | 896 | 876 | 182.1 |
| A | 13 | 210 | 17724 | 92.53 | 896 | 876 | 182.1 |
| A | 15 | 157 | 14986 | 77.49 | 896 | 876 | 182.1 |
| B | 4 | 142 | 178507 | 1026.74 | 894 | 872 | 173.0 |
| B | 0 | 189 | 121252 | 695.8 | 894 | 872 | 173.0 |
| B | 0 | 229 | 33886 | 190.82 | 894 | 872 | 173.0 |
| C | 3 | 233 | 1360154 | 6789.3 | 859 | 862 | 200.2 |
| C | 13 | 61 | 6131 | 26.31 | 859 | 862 | 200.2 |
| C | 0 | 207 | 4997 | 20.65 | 859 | 862 | 200.2 |
| D | 2 | 120 | 274487 | 1250.15 | 862 | 838 | 218.9 |
| D | 12 | 110 | 72230 | 326.15 | 862 | 838 | 218.9 |
| D | 10 | 199 | 42785 | 191.63 | 862 | 838 | 218.9 |
Histogram calculated using DETX and DETY for each event in the final _common_clean file
| Quadrant A | 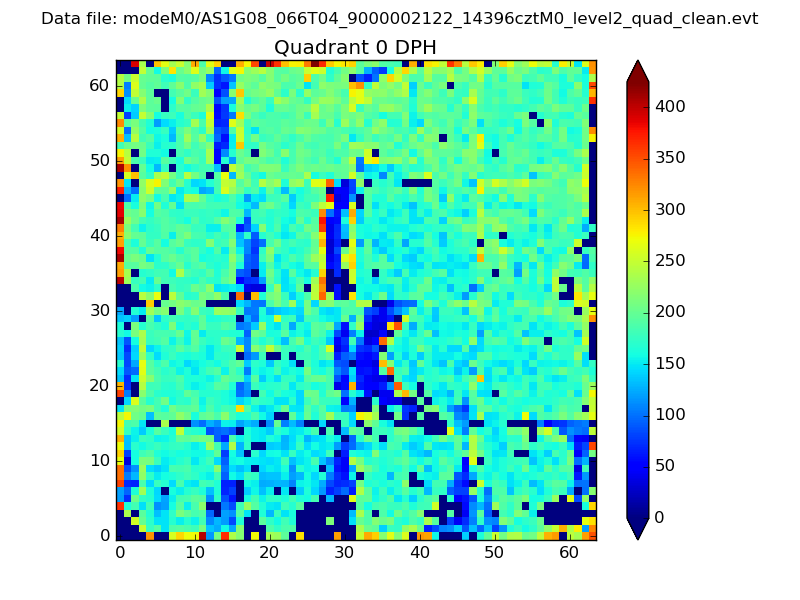 |
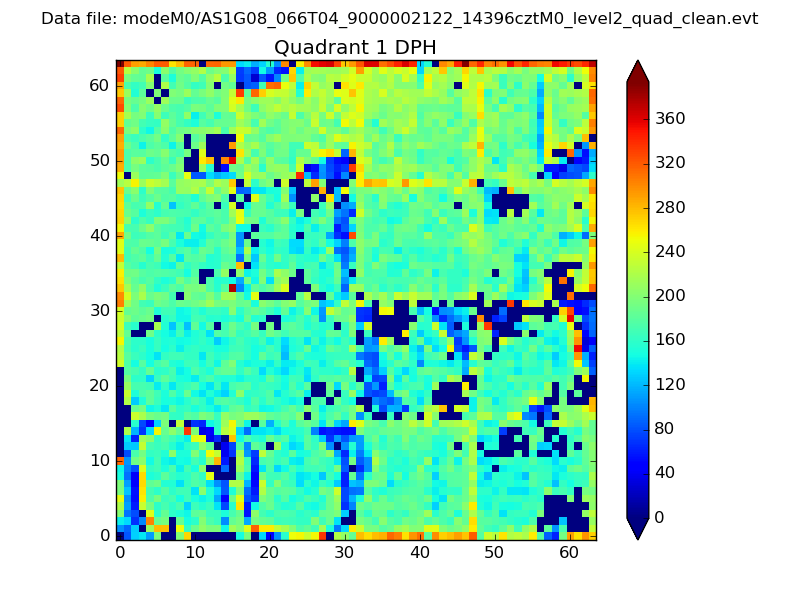 |
Quadrant B |
|---|---|---|---|
| Quadrant D | 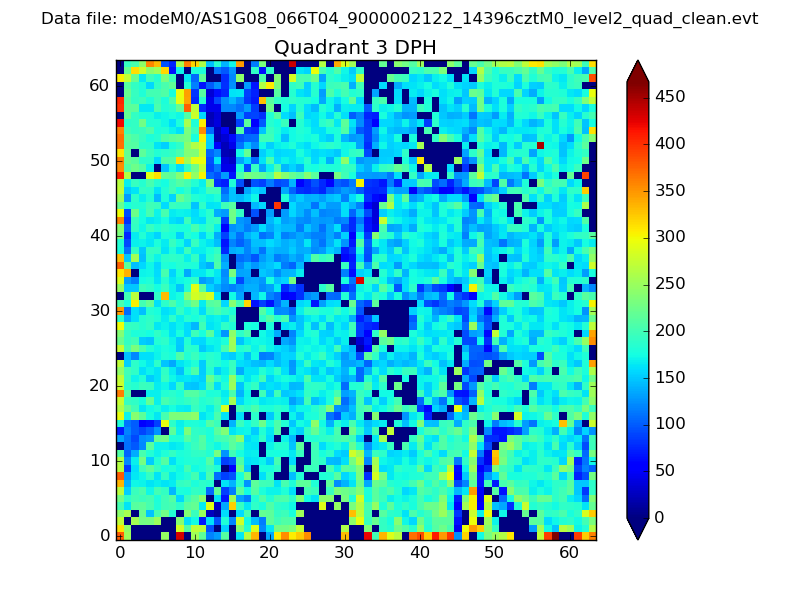 |
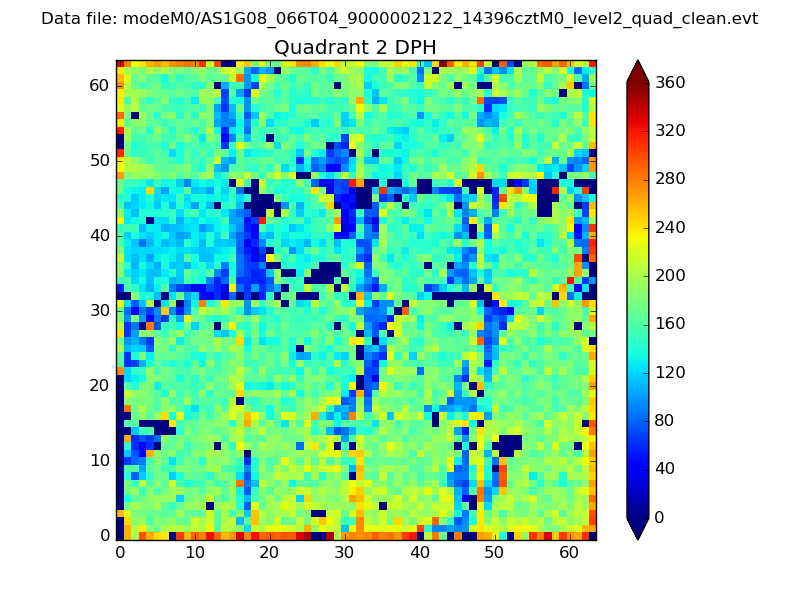 |
Quadrant C |
| Plot type | Count rate plots | Images |
|---|---|---|
| Comparison with Poisson distribution Blue bars denote a histogram of data divided into 1 sec bins. Red curve is a Poisson curve with rate = median count rate of data. |
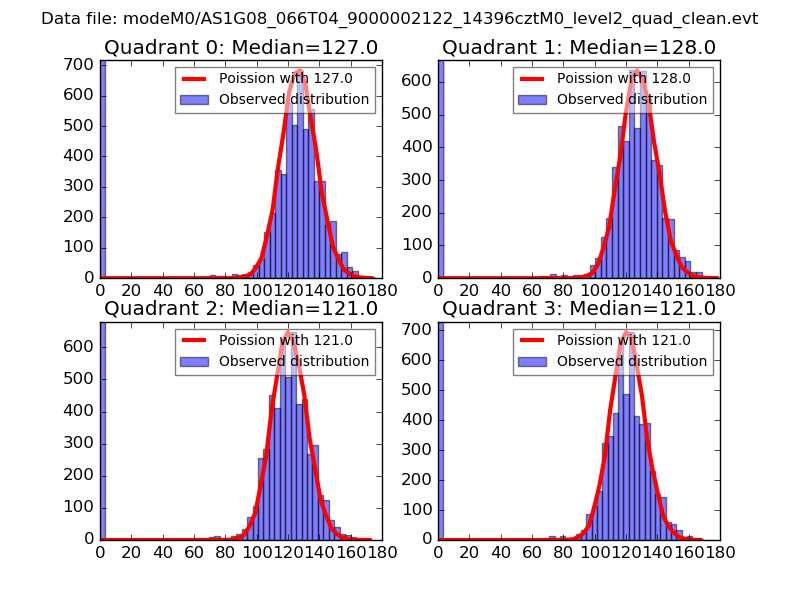 |
 |
| Quadrant-wise count rates Data is divided into 100 sec bins |
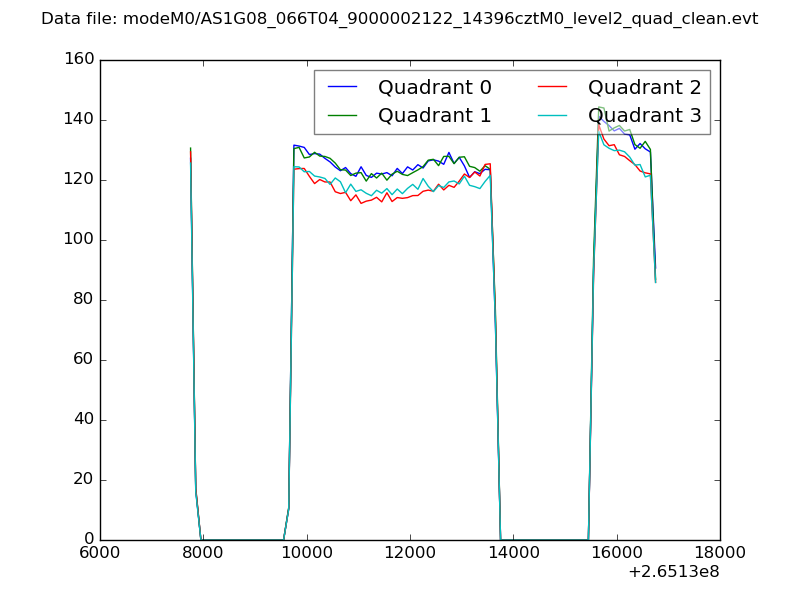 |
|
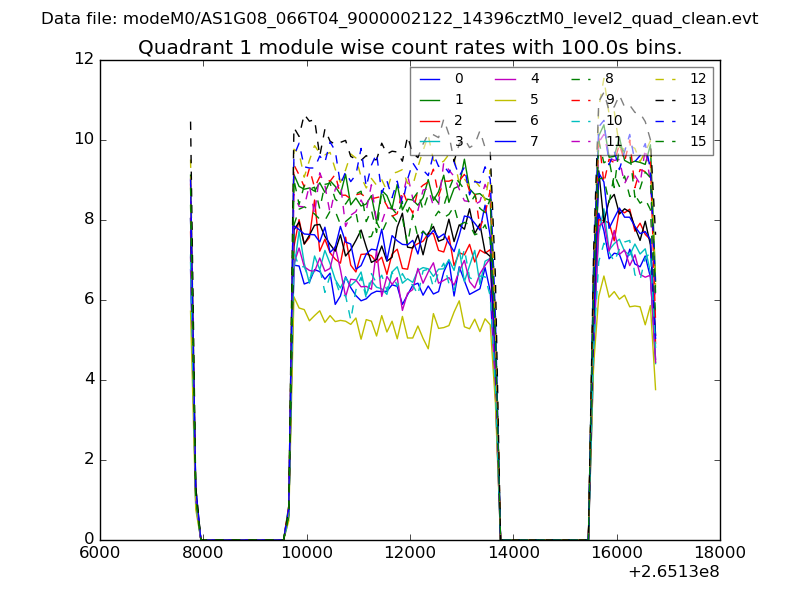
| Module-wise count rates for Quadrant A Data is divided into 100 sec bins |
 |
 |
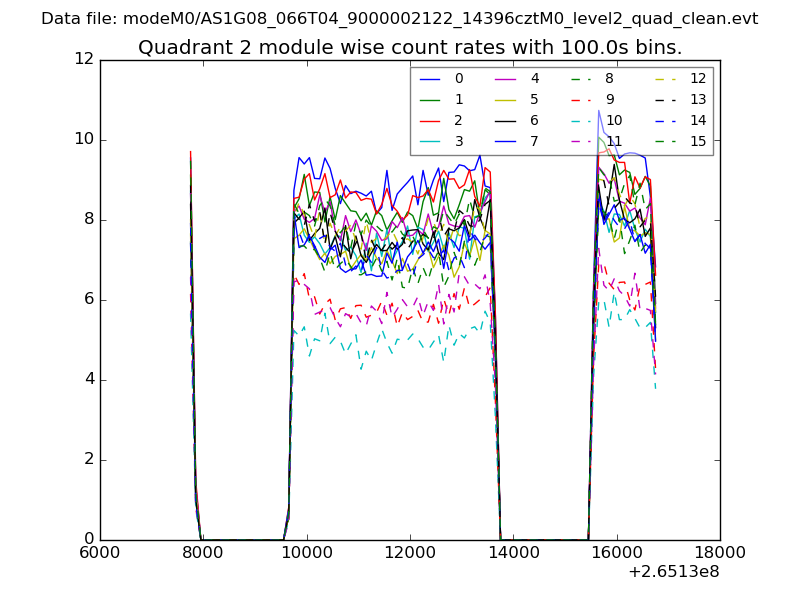
| Module-wise count rates for Quadrant B Data is divided into 100 sec bins |
 |
 |
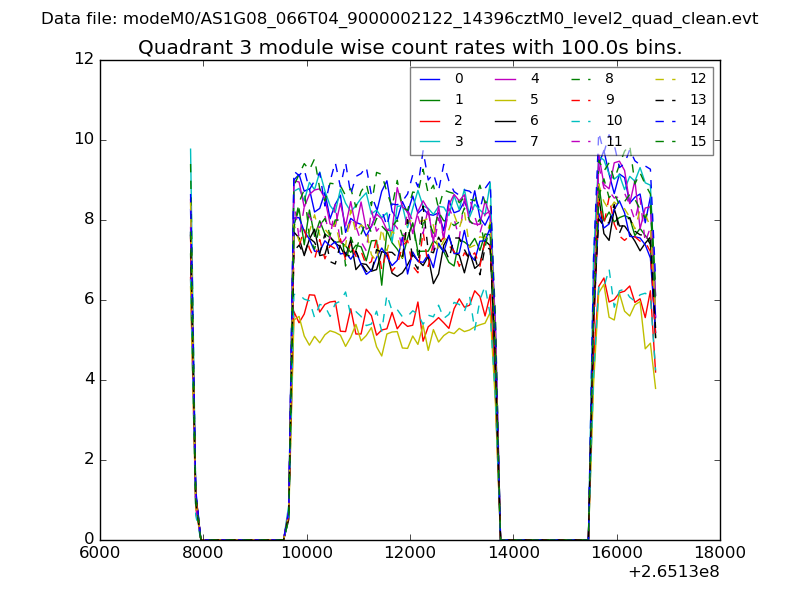
| Module-wise count rates for Quadrant C Data is divided into 100 sec bins |
 |
 |
| Module-wise count rates for Quadrant D Data is divided into 100 sec bins |
 |
 |
| Parameter | Plot |
|---|---|
| CZT HV Monitor | 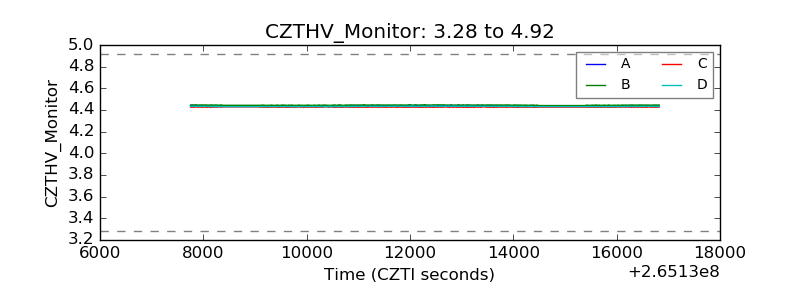 |
| D_VDD | 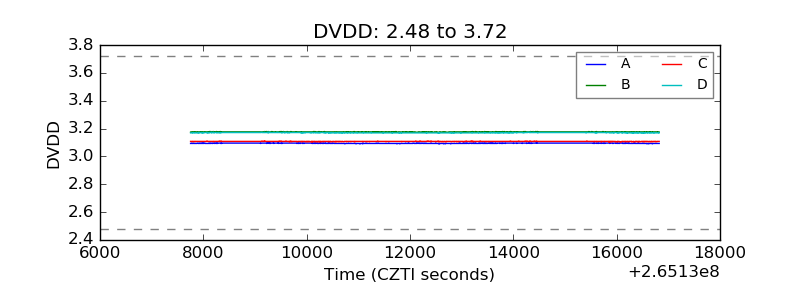 |
| Temperature 1 | 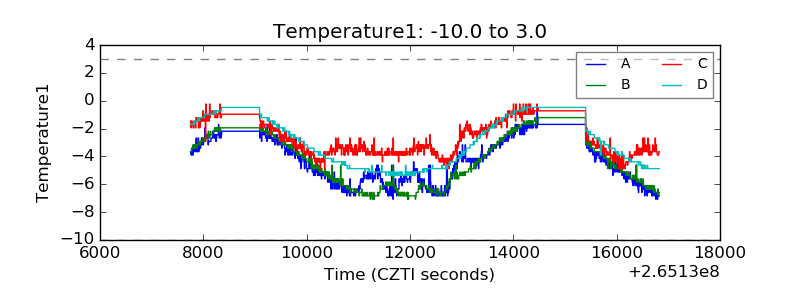 |
| Veto HV Monitor | 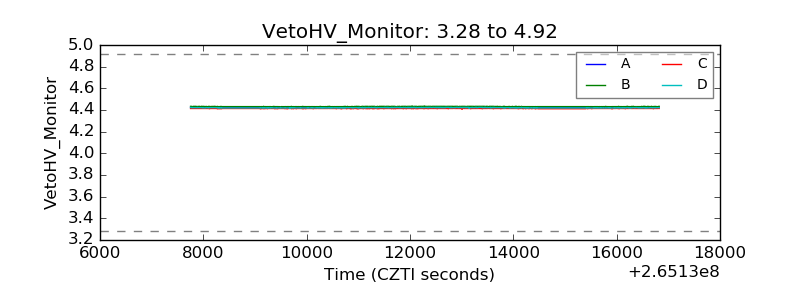 |
| Veto LLD | 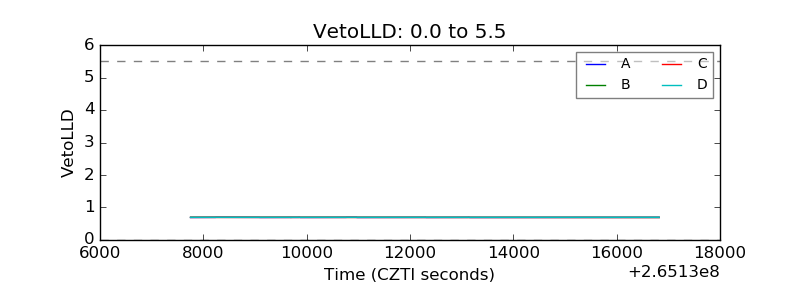 |
| Alpha Counter | 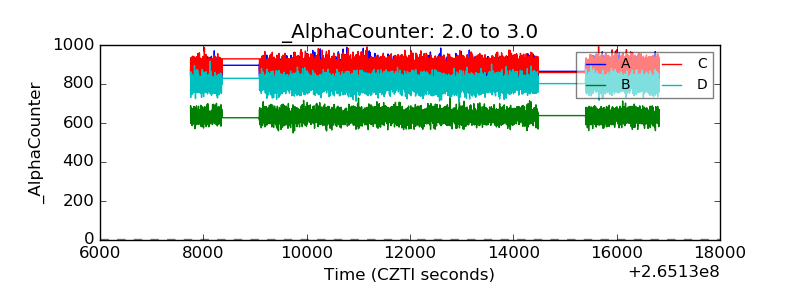 |
| _CPM_Rate | 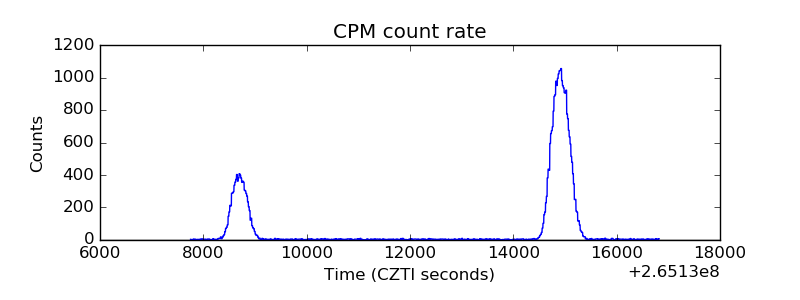 |
| CZT Counter | 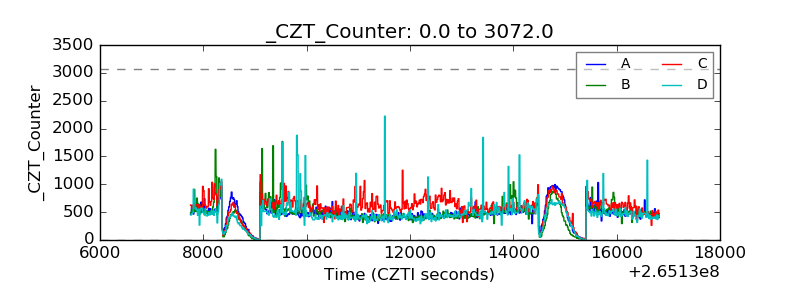 |
| +2.5 Volts monitor | 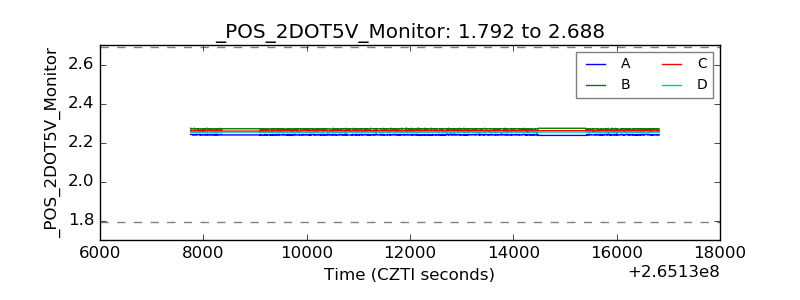 |
| +5 Volts monitor |  |
| _ROLL_ROT | 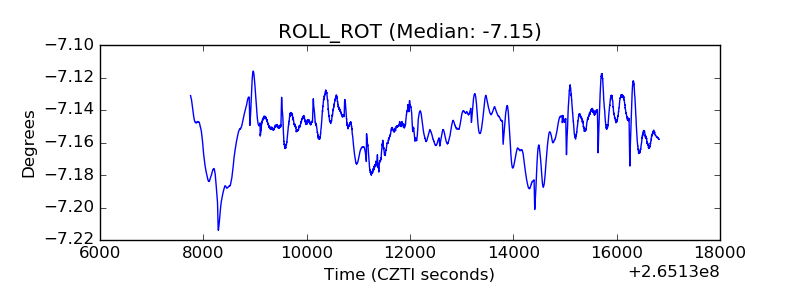 |
| _Roll_DEC | 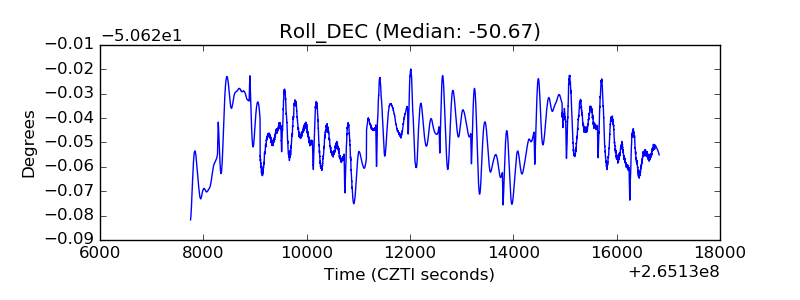 |
| _Roll_RA | 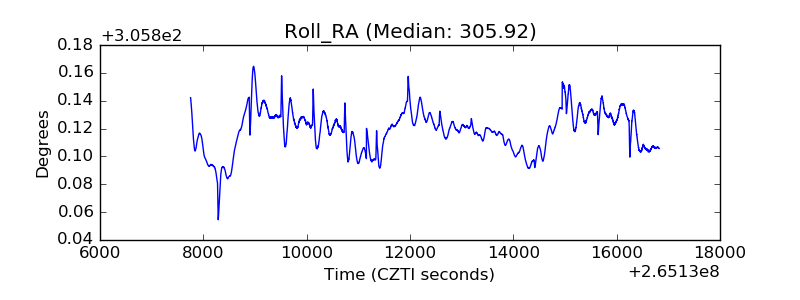 |
| Veto Counter | 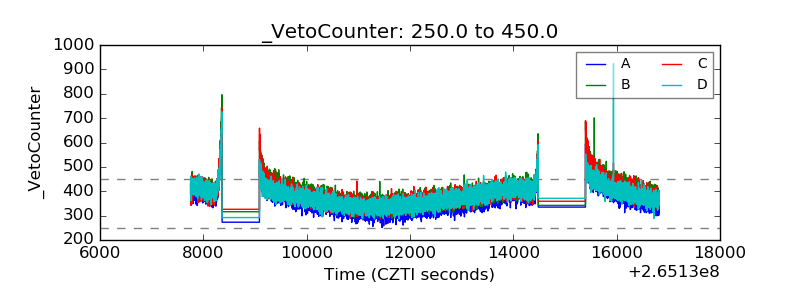 |