| Param | Original file | Final file |
|---|---|---|
| Filename | modeM0/AS1G08_066T04_9000002122_14397cztM0_level2.evt | modeM0/AS1G08_066T04_9000002122_14397cztM0_level2_quad_clean.evt |
| Size (bytes) | 497,033,280 | 104,221,440 |
| Size | 474.0 MB | 99.4 MB |
| Events in quadrant A | 3,286,846 | 682,806 |
| Events in quadrant B | 3,500,465 | 692,038 |
| Events in quadrant C | 4,246,681 | 654,884 |
| Events in quadrant D | 3,552,059 | 647,644 |
| Mode SS | |||
|---|---|---|---|
| Quadrant | BADHDUFLAG | Total packets | Discarded packets |
| A | 0 | 142 | 0 |
| B | 0 | 142 | 0 |
| C | 0 | 142 | 0 |
| D | 0 | 142 | 0 |
| Mode M0 | |||
|---|---|---|---|
| Quadrant | BADHDUFLAG | Total packets | Discarded packets |
| A | 0 | 14214 | 3 |
| B | 0 | 14949 | 2 |
| C | 0 | 17169 | 2 |
| D | 0 | 15203 | 2 |
| Mode M9 | |||
|---|---|---|---|
| Quadrant | BADHDUFLAG | Total packets | Discarded packets |
| A | 0 | 20 | 0 |
| B | 0 | 20 | 0 |
| C | 0 | 20 | 0 |
| D | 0 | 20 | 0 |
| Quadrant | Total seconds | Saturated seconds | Saturation percentage |
|---|---|---|---|
| A | 6875 | 52 | 0.756364% |
| B | 6875 | 89 | 1.294545% |
| C | 6875 | 40 | 0.581818% |
| D | 6875 | 61 | 0.887273% |
Noise dominated data is calculated using 1-second bins in cleaned event files. If a bin has >2000 counts, and if more than 50% of those come from <1% of pixels, then it is considered to be noise-dominated and hence unusable.
| Quadrant | # 1 sec bins | Bins with >0 counts | Bins with >2000 counts | High rate bins dominated by noise | Noise dominated (total time) | Noise dominated (detector-on time) | Marked lightcurve |
|---|---|---|---|---|---|---|---|
| A | 8851 | 6877 | 2 | 2 | 0.02% | 0.03% | 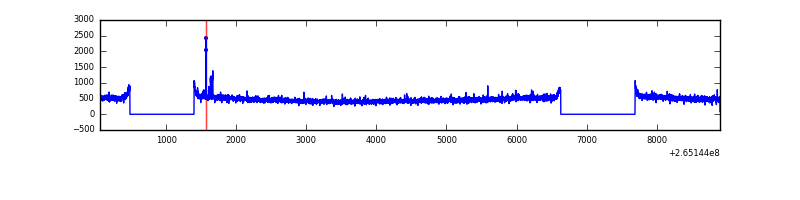 |
| B | 8851 | 6877 | 6 | 6 | 0.07% | 0.09% | 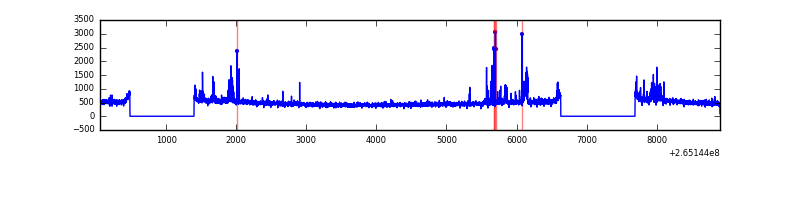 |
| C | 8851 | 6877 | 1 | 1 | 0.01% | 0.01% | 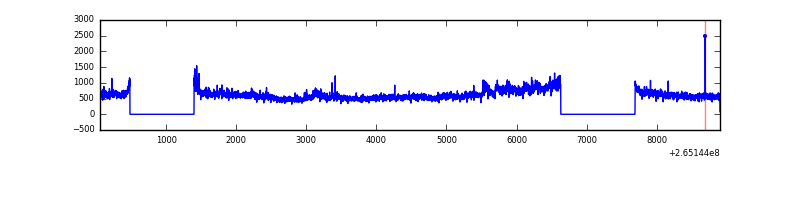 |
| D | 8851 | 6876 | 32 | 32 | 0.36% | 0.47% | 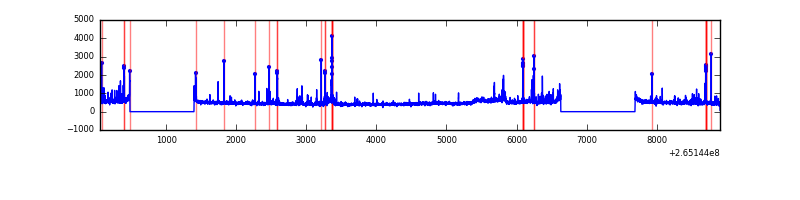 |
Top three noisy pixels from each quadrant. If the there are fewer than three noisy pixels in the level2.evt file, extra rows are filled as -1
| Pixel properties | Quadrant properties | ||||||
|---|---|---|---|---|---|---|---|
| Quadrant | DetID | PixID | Counts | Sigma | Mean | Median | Sigma |
| A | 8 | 15 | 24740 | 142.04 | 835 | 815 | 168.4 |
| A | 12 | 189 | 16369 | 92.34 | 835 | 815 | 168.4 |
| A | 15 | 157 | 15006 | 84.25 | 835 | 815 | 168.4 |
| B | 0 | 189 | 75799 | 468.99 | 838 | 817 | 159.9 |
| B | 4 | 142 | 72387 | 447.65 | 838 | 817 | 159.9 |
| B | 4 | 173 | 22938 | 138.36 | 838 | 817 | 159.9 |
| C | 3 | 233 | 1089535 | 5847.27 | 808 | 813 | 186.2 |
| C | 13 | 61 | 5627 | 25.85 | 808 | 813 | 186.2 |
| C | 14 | 234 | 5039 | 22.7 | 808 | 813 | 186.2 |
| D | 2 | 120 | 204588 | 1055.34 | 804 | 783 | 193.1 |
| D | 12 | 227 | 114839 | 590.6 | 804 | 783 | 193.1 |
| D | 10 | 199 | 43572 | 221.57 | 804 | 783 | 193.1 |
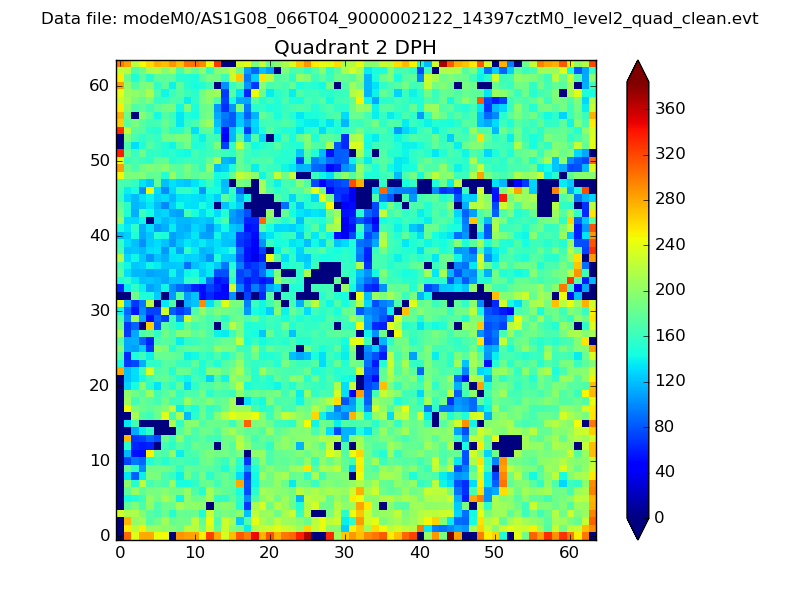
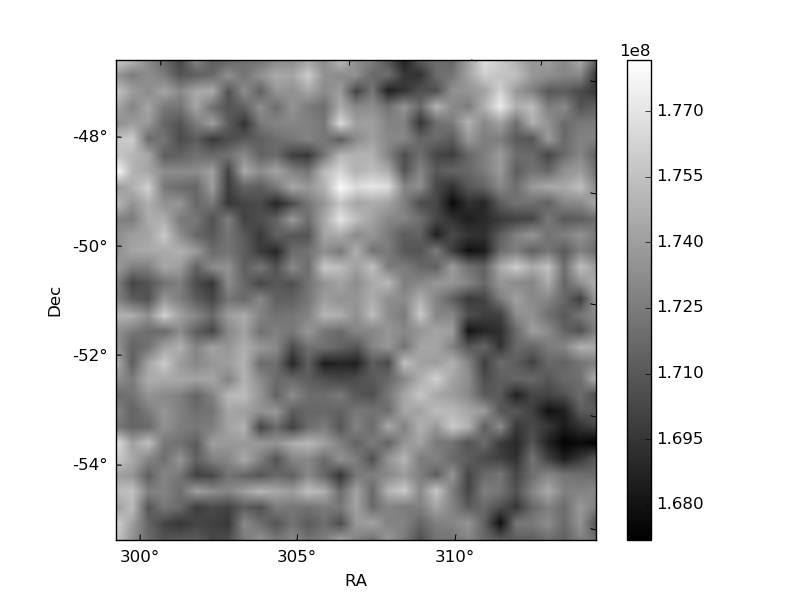
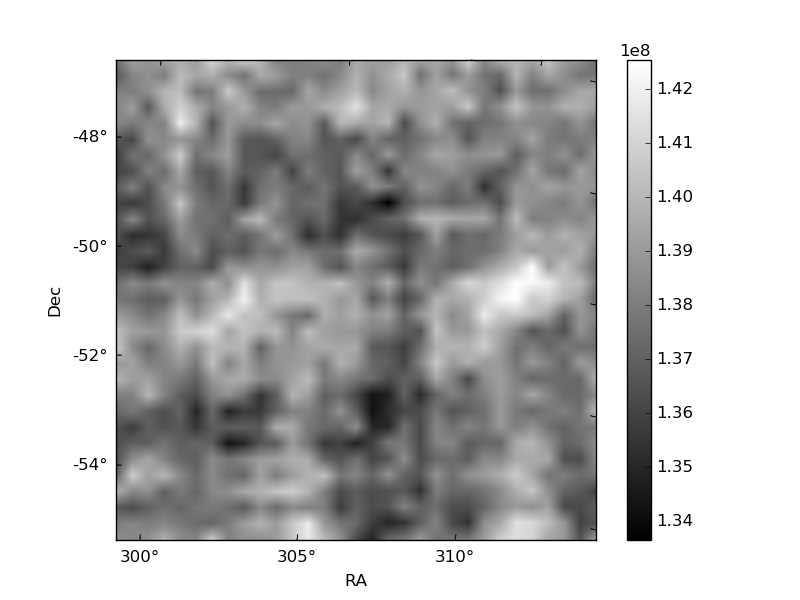
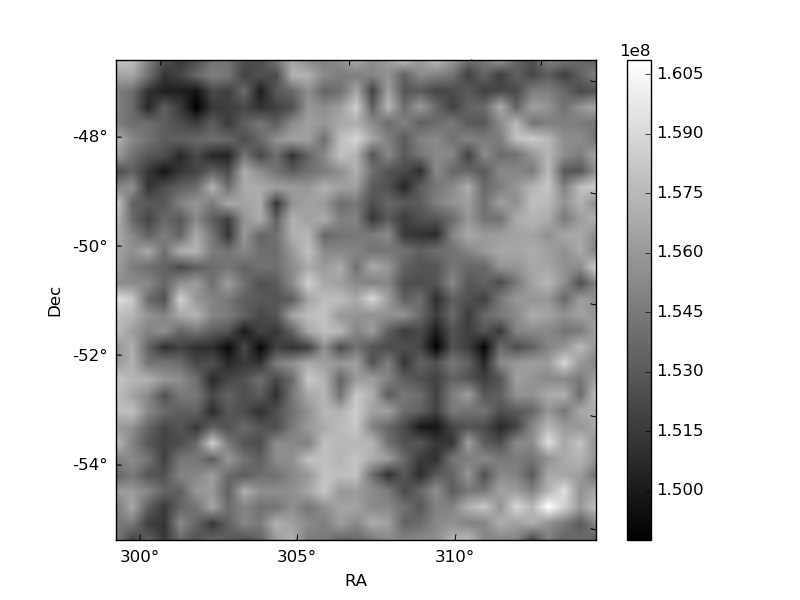
Histogram calculated using DETX and DETY for each event in the final _common_clean file
| Quadrant A | 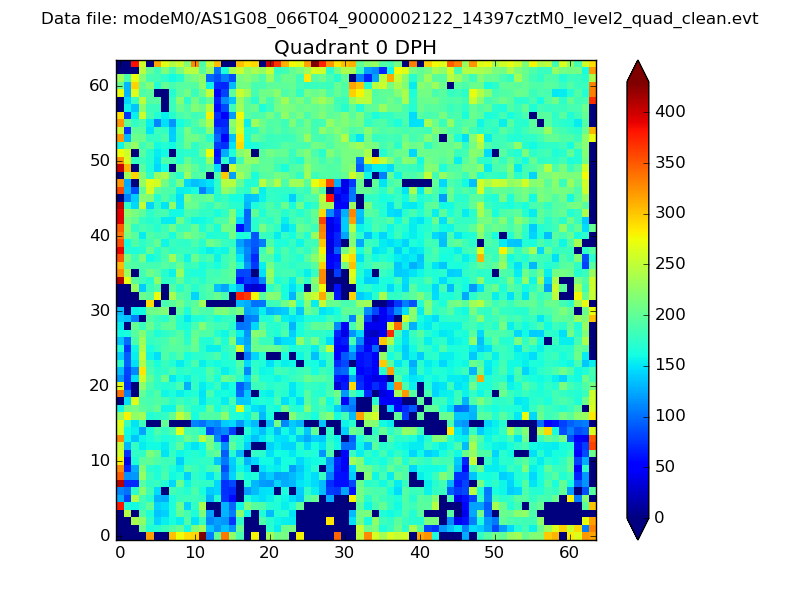 |
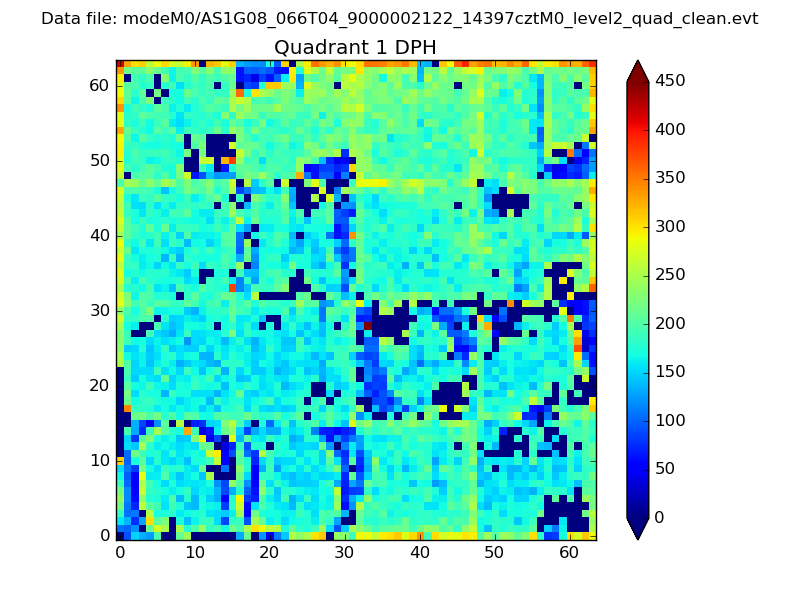 |
Quadrant B |
|---|---|---|---|
| Quadrant D | 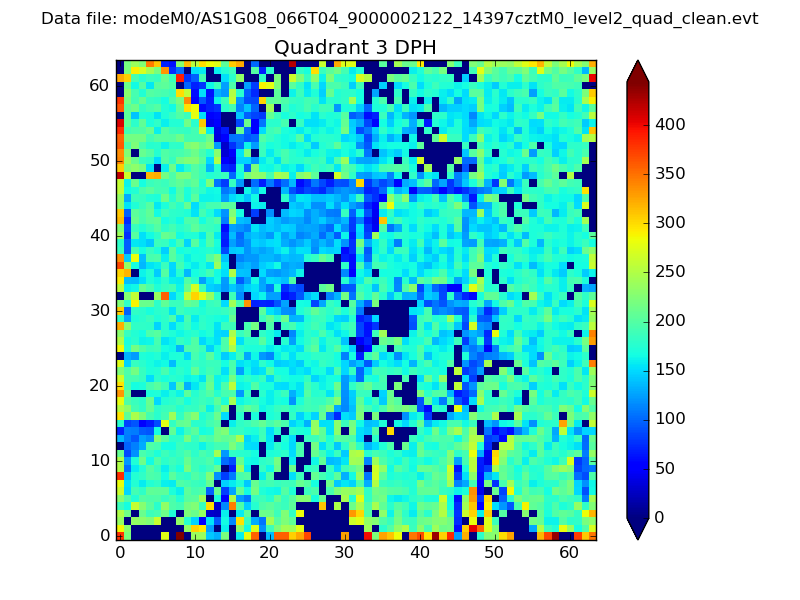 |
 |
Quadrant C |
| Plot type | Count rate plots | Images |
|---|---|---|
| Comparison with Poisson distribution Blue bars denote a histogram of data divided into 1 sec bins. Red curve is a Poisson curve with rate = median count rate of data. |
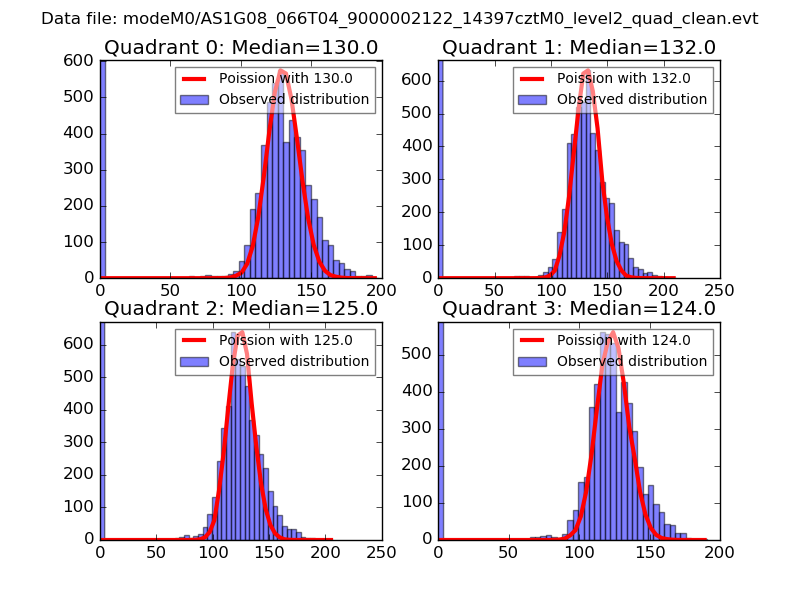 |
 |
| Quadrant-wise count rates Data is divided into 100 sec bins |
 |
|
| Module-wise count rates for Quadrant A Data is divided into 100 sec bins |
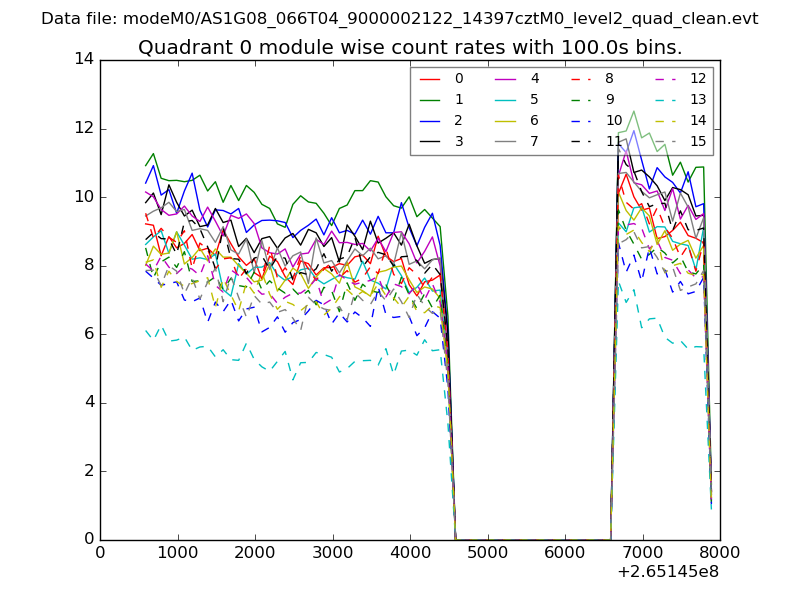 |
 |
| Module-wise count rates for Quadrant B Data is divided into 100 sec bins |
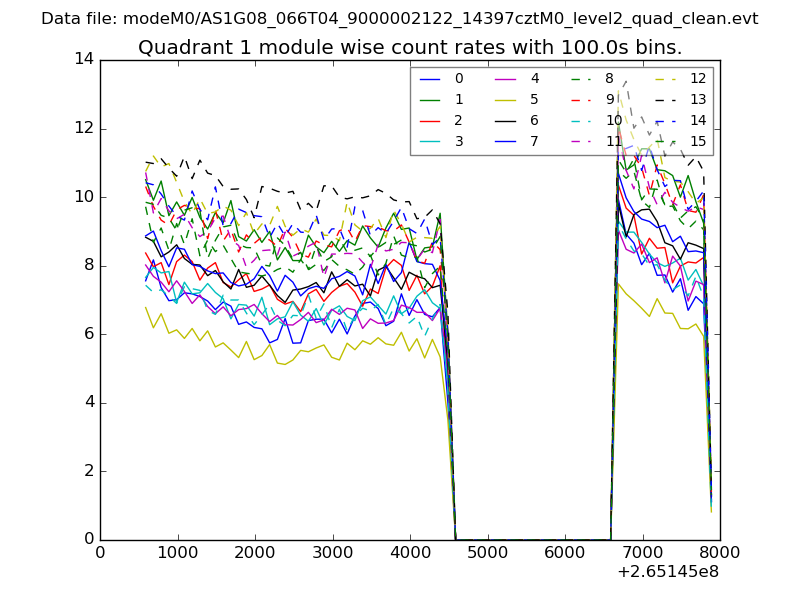 |
 |
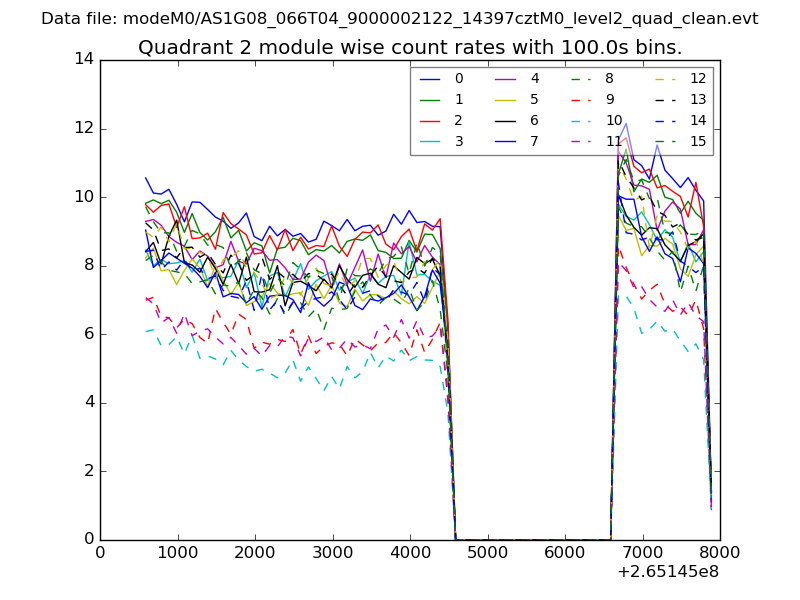
| Module-wise count rates for Quadrant C Data is divided into 100 sec bins |
 |
 |
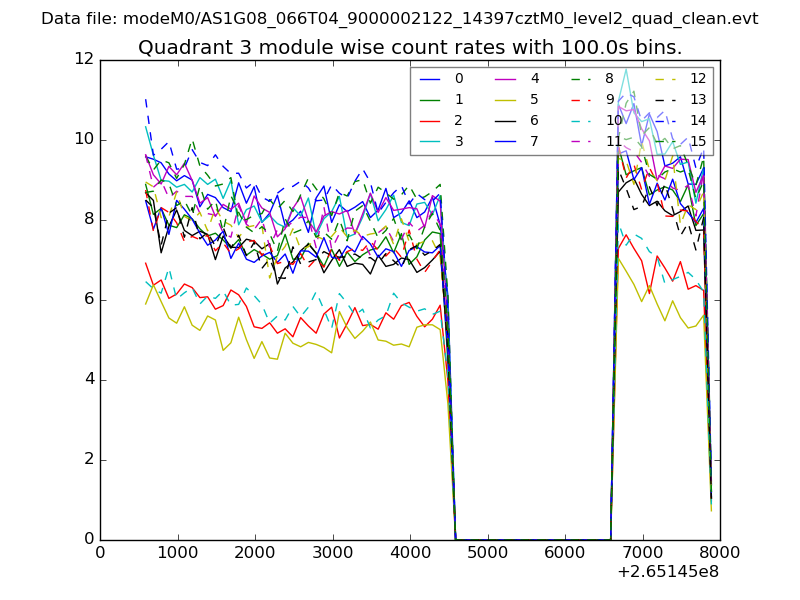
| Module-wise count rates for Quadrant D Data is divided into 100 sec bins |
 |
 |
| Parameter | Plot |
|---|---|
| CZT HV Monitor | 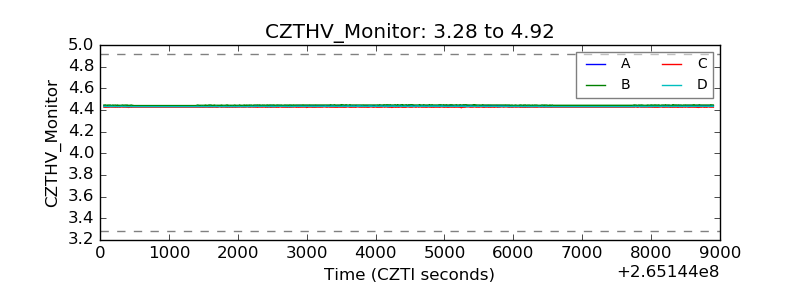 |
| D_VDD | 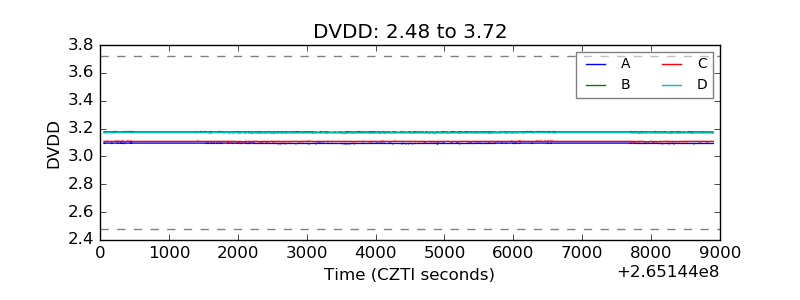 |
| Temperature 1 | 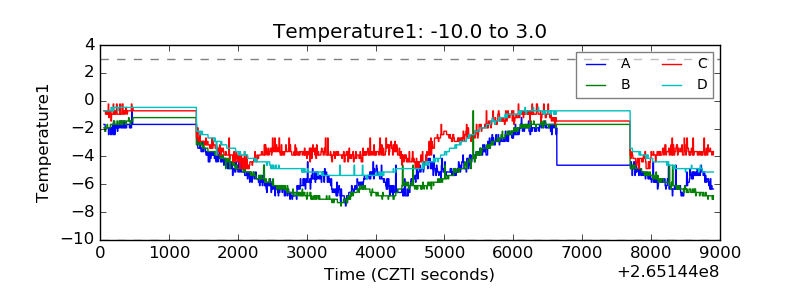 |
| Veto HV Monitor | 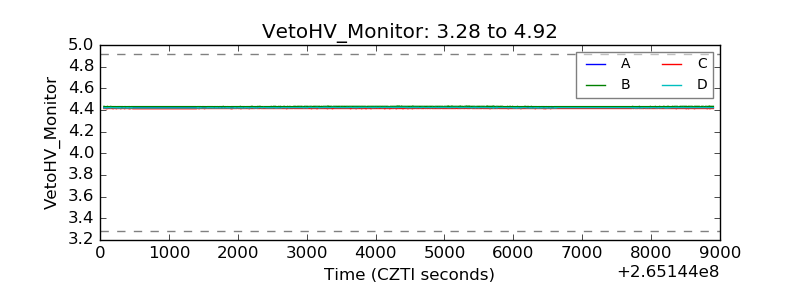 |
| Veto LLD | 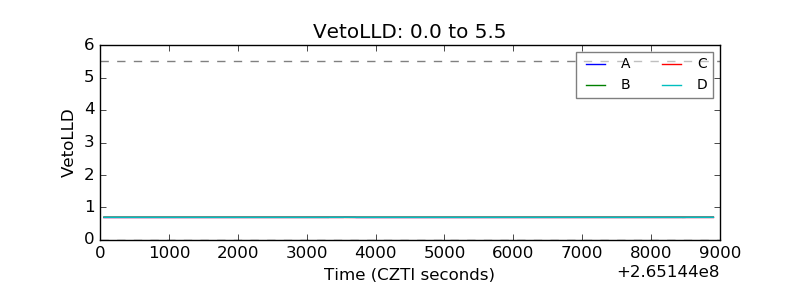 |
| Alpha Counter | 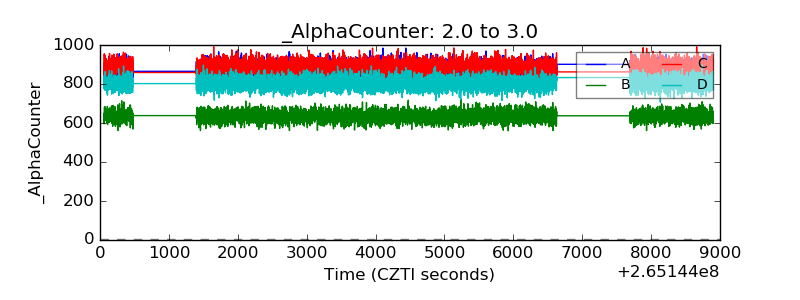 |
| _CPM_Rate | 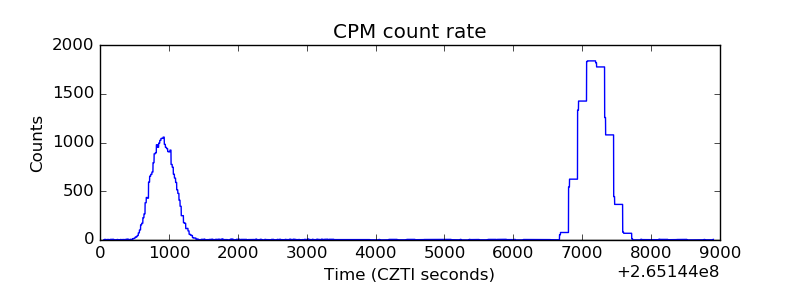 |
| CZT Counter |  |
| +2.5 Volts monitor |  |
| +5 Volts monitor |  |
| _ROLL_ROT | 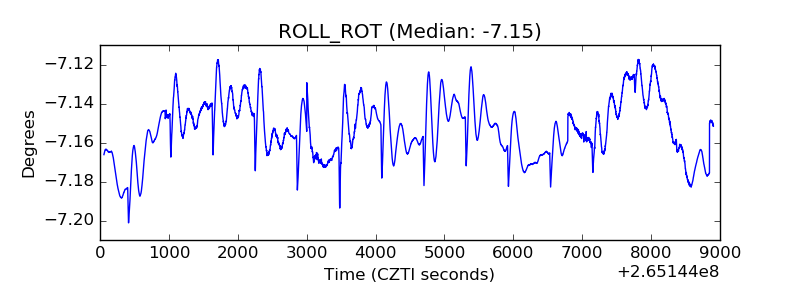 |
| _Roll_DEC | 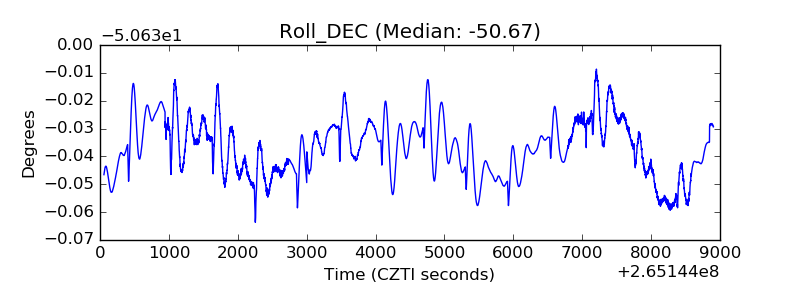 |
| _Roll_RA |  |
| Veto Counter | 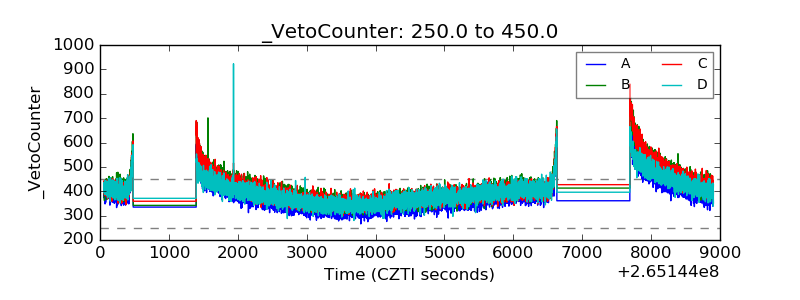 |