| Param | Original file | Final file |
|---|---|---|
| Filename | modeM0/AS1G08_066T04_9000002122_14400cztM0_level2.evt | modeM0/AS1G08_066T04_9000002122_14400cztM0_level2_quad_clean.evt |
| Size (bytes) | 526,193,280 | 109,661,760 |
| Size | 501.8 MB | 104.6 MB |
| Events in quadrant A | 3,219,421 | 728,170 |
| Events in quadrant B | 3,398,583 | 749,582 |
| Events in quadrant C | 3,772,182 | 724,533 |
| Events in quadrant D | 5,101,126 | 662,122 |
| Mode SS | |||
|---|---|---|---|
| Quadrant | BADHDUFLAG | Total packets | Discarded packets |
| A | 0 | 134 | 0 |
| B | 0 | 134 | 0 |
| C | 0 | 134 | 0 |
| D | 0 | 134 | 0 |
| Mode M0 | |||
|---|---|---|---|
| Quadrant | BADHDUFLAG | Total packets | Discarded packets |
| A | 0 | 13678 | 3 |
| B | 0 | 14210 | 2 |
| C | 0 | 15156 | 2 |
| D | 0 | 19521 | 2 |
| Mode M9 | |||
|---|---|---|---|
| Quadrant | BADHDUFLAG | Total packets | Discarded packets |
| A | 0 | 19 | 0 |
| B | 0 | 19 | 0 |
| C | 0 | 19 | 0 |
| D | 0 | 20 | 0 |
| Quadrant | Total seconds | Saturated seconds | Saturation percentage |
|---|---|---|---|
| A | 6547 | 9 | 0.137468% |
| B | 6547 | 31 | 0.473499% |
| C | 6547 | 11 | 0.168016% |
| D | 6547 | 768 | 11.730564% |
Noise dominated data is calculated using 1-second bins in cleaned event files. If a bin has >2000 counts, and if more than 50% of those come from <1% of pixels, then it is considered to be noise-dominated and hence unusable.
| Quadrant | # 1 sec bins | Bins with >0 counts | Bins with >2000 counts | High rate bins dominated by noise | Noise dominated (total time) | Noise dominated (detector-on time) | Marked lightcurve |
|---|---|---|---|---|---|---|---|
| A | 7848 | 6549 | 0 | 0 | 0.00% | 0.00% | 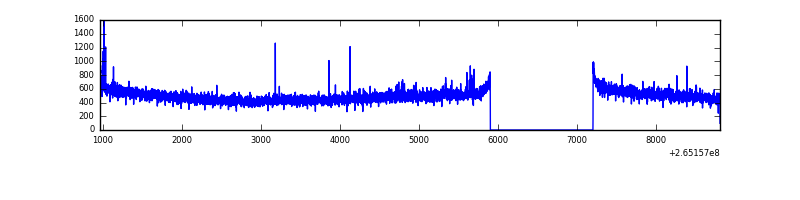 |
| B | 7848 | 6549 | 6 | 6 | 0.08% | 0.09% | 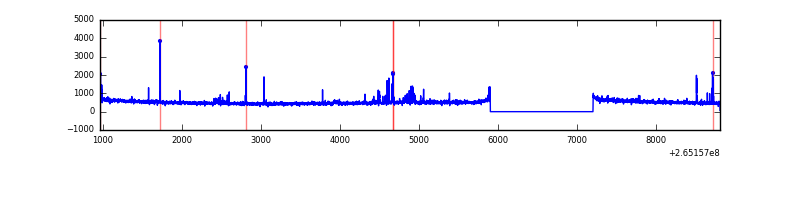 |
| C | 7848 | 6549 | 1 | 1 | 0.01% | 0.02% | 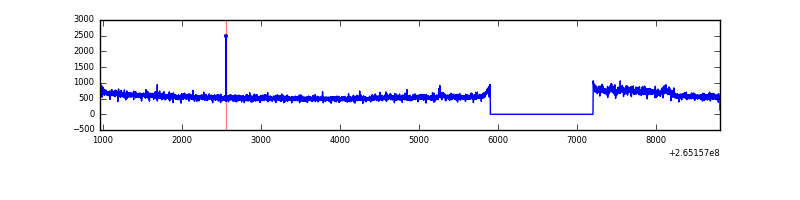 |
| D | 7848 | 6548 | 740 | 740 | 9.43% | 11.30% | 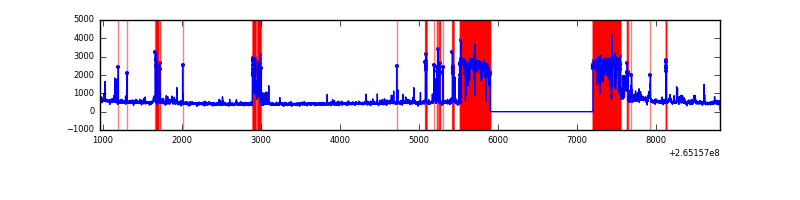 |
Top three noisy pixels from each quadrant. If the there are fewer than three noisy pixels in the level2.evt file, extra rows are filled as -1
| Pixel properties | Quadrant properties | ||||||
|---|---|---|---|---|---|---|---|
| Quadrant | DetID | PixID | Counts | Sigma | Mean | Median | Sigma |
| A | 12 | 189 | 23537 | 137.84 | 821 | 805 | 164.9 |
| A | 8 | 15 | 17086 | 98.73 | 821 | 805 | 164.9 |
| A | 4 | 2 | 9305 | 51.54 | 821 | 805 | 164.9 |
| B | 0 | 229 | 38953 | 249.92 | 830 | 810 | 152.6 |
| B | 0 | 189 | 31826 | 203.22 | 830 | 810 | 152.6 |
| B | 4 | 173 | 24956 | 158.21 | 830 | 810 | 152.6 |
| C | 3 | 233 | 573028 | 3067.58 | 820 | 825 | 186.5 |
| C | 13 | 61 | 5716 | 26.22 | 820 | 825 | 186.5 |
| C | 14 | 234 | 3801 | 15.95 | 820 | 825 | 186.5 |
| D | 15 | 0 | 949836 | 5362.36 | 755 | 741 | 177.0 |
| D | 13 | 122 | 845584 | 4773.33 | 755 | 741 | 177.0 |
| D | 10 | 172 | 181233 | 1019.77 | 755 | 741 | 177.0 |
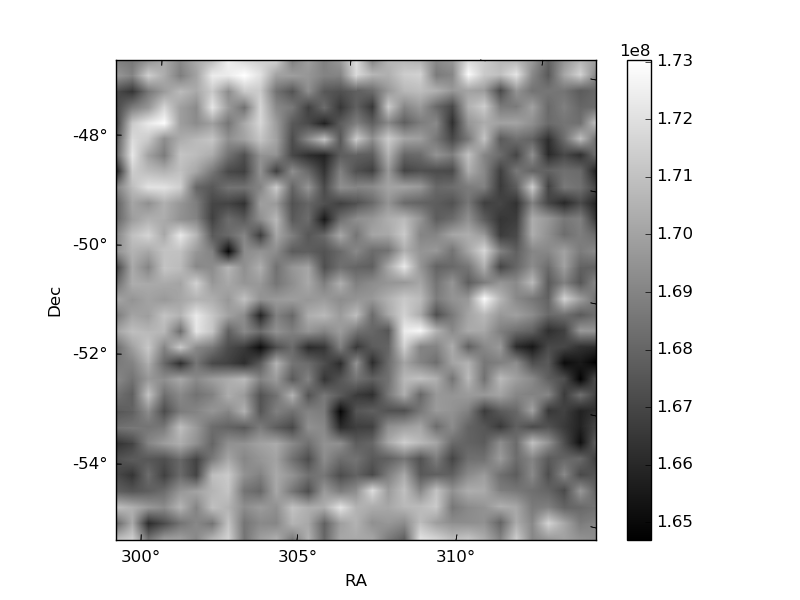
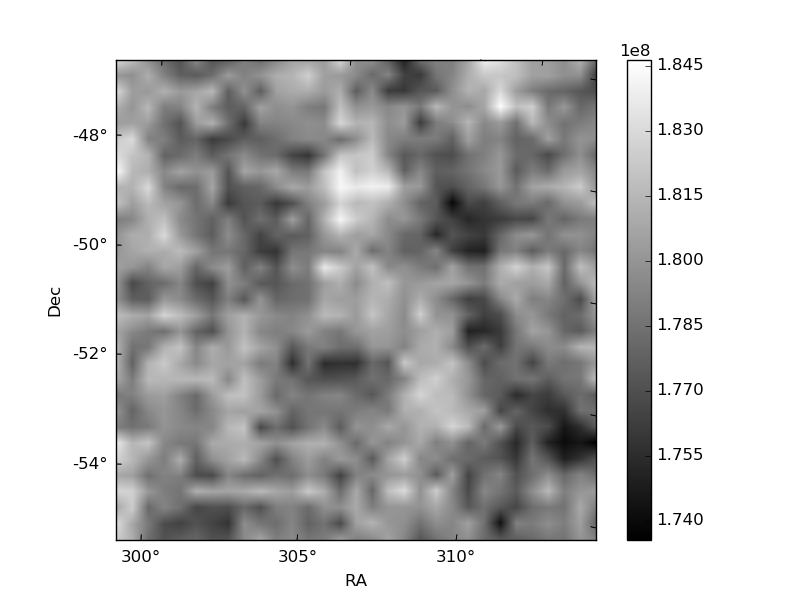
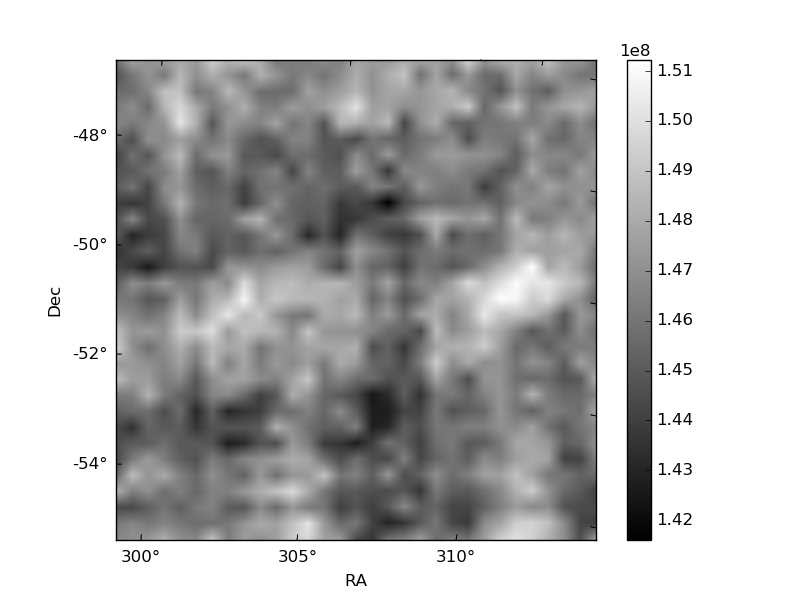
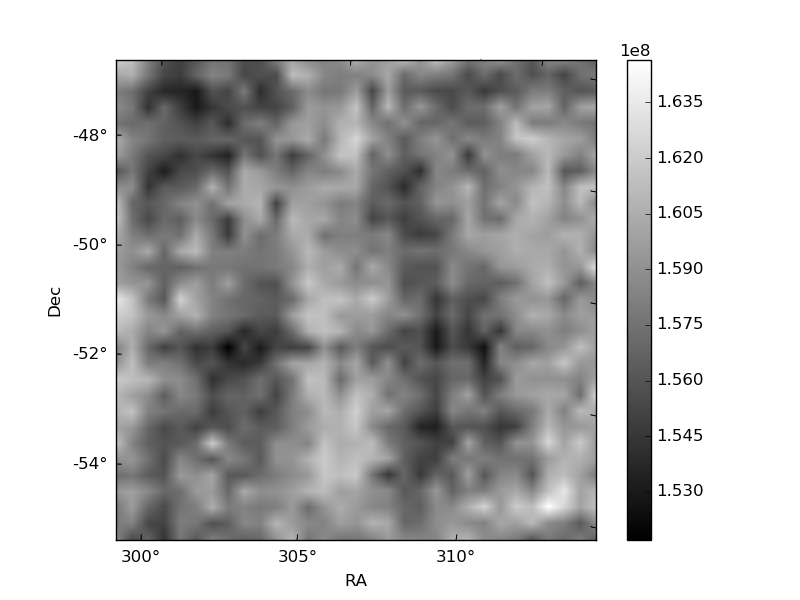
Histogram calculated using DETX and DETY for each event in the final _common_clean file
| Quadrant A |  |
 |
Quadrant B |
|---|---|---|---|
| Quadrant D | 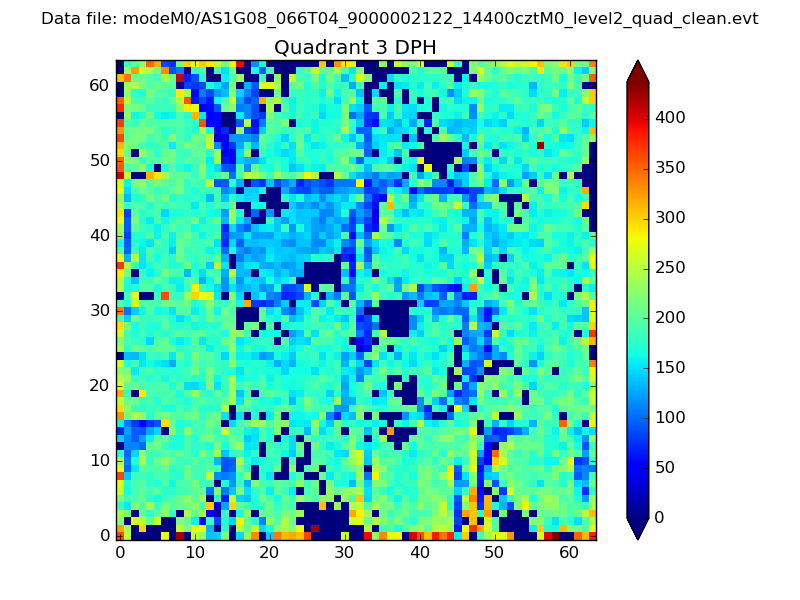 |
 |
Quadrant C |
| Plot type | Count rate plots | Images |
|---|---|---|
| Comparison with Poisson distribution Blue bars denote a histogram of data divided into 1 sec bins. Red curve is a Poisson curve with rate = median count rate of data. |
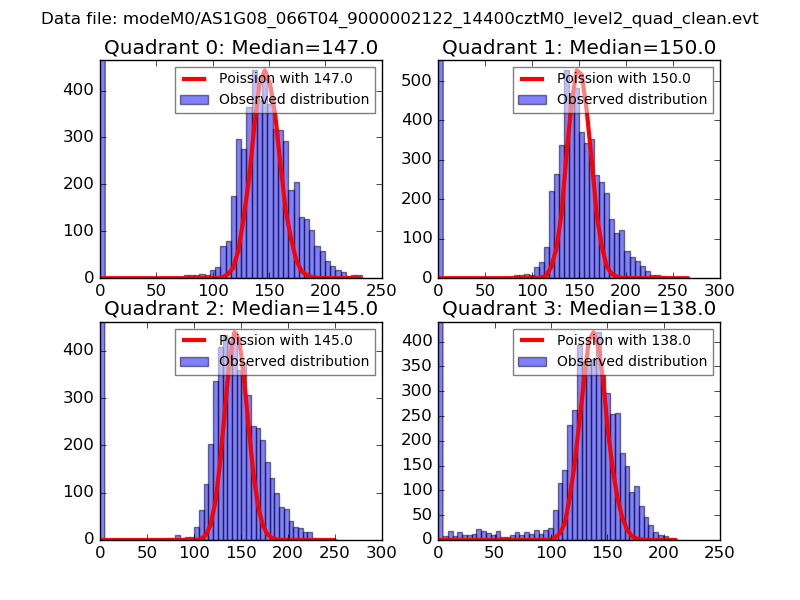 |
 |
| Quadrant-wise count rates Data is divided into 100 sec bins |
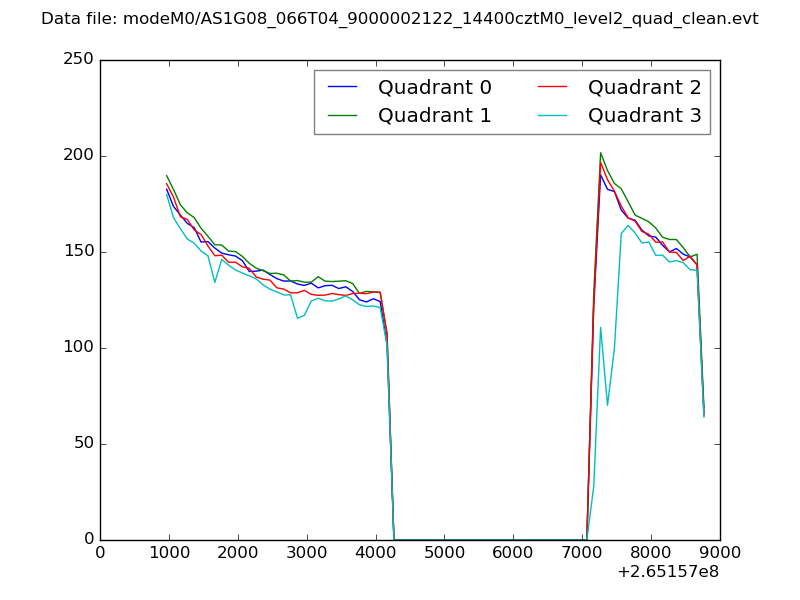 |
|
| Module-wise count rates for Quadrant A Data is divided into 100 sec bins |
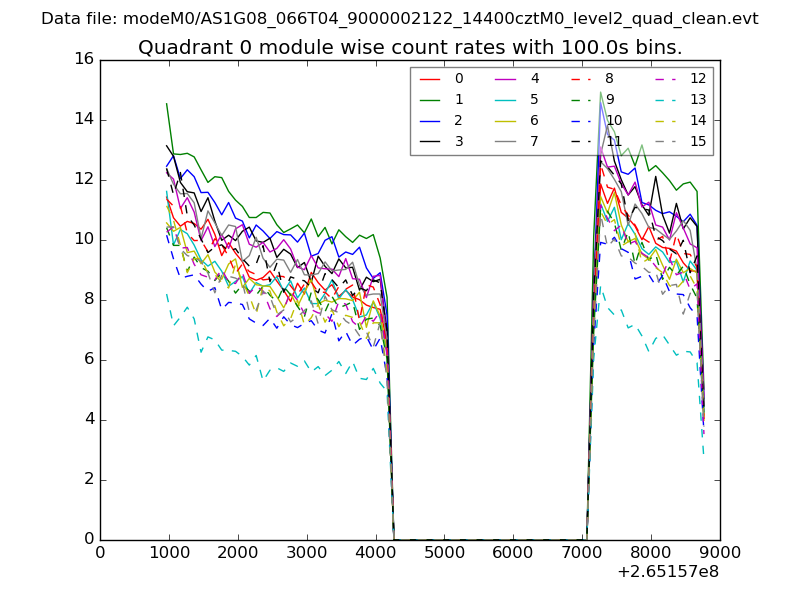 |
 |
| Module-wise count rates for Quadrant B Data is divided into 100 sec bins |
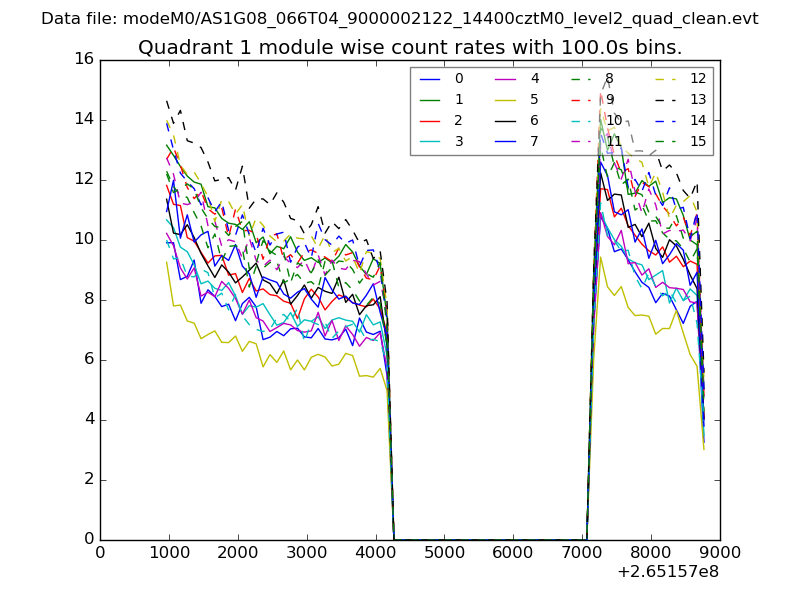 |
 |
| Module-wise count rates for Quadrant C Data is divided into 100 sec bins |
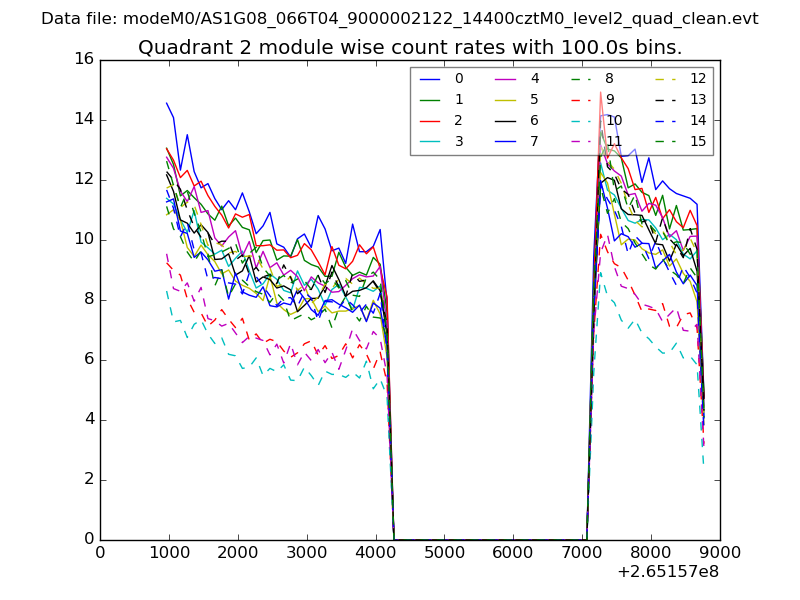 |
 |
| Module-wise count rates for Quadrant D Data is divided into 100 sec bins |
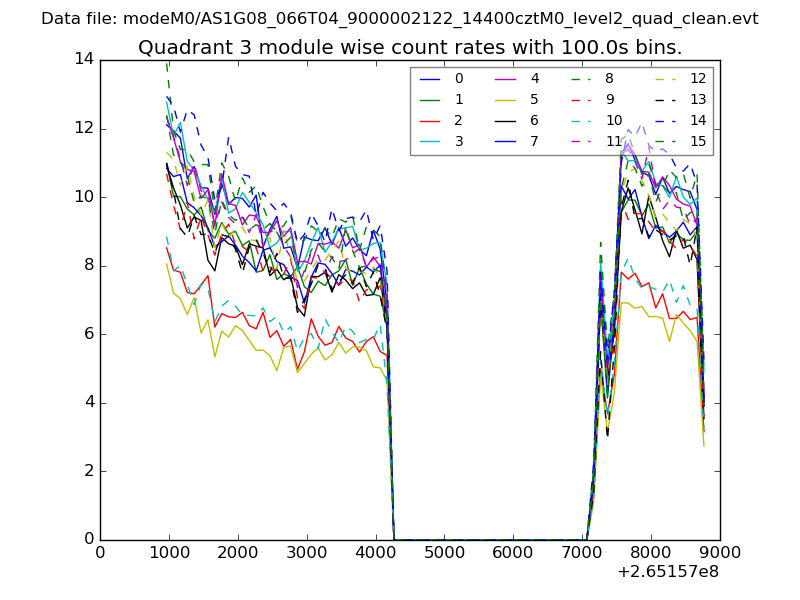 |
 |
| Parameter | Plot |
|---|---|
| CZT HV Monitor | 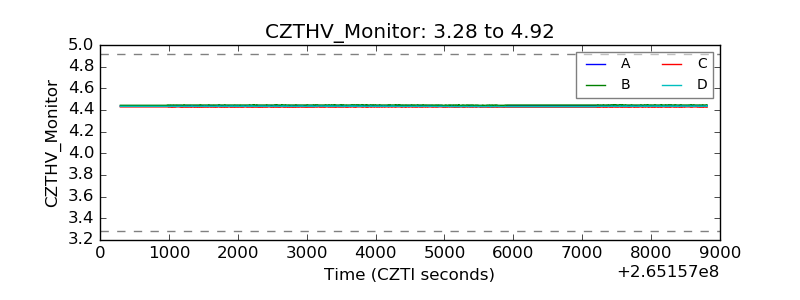 |
| D_VDD | 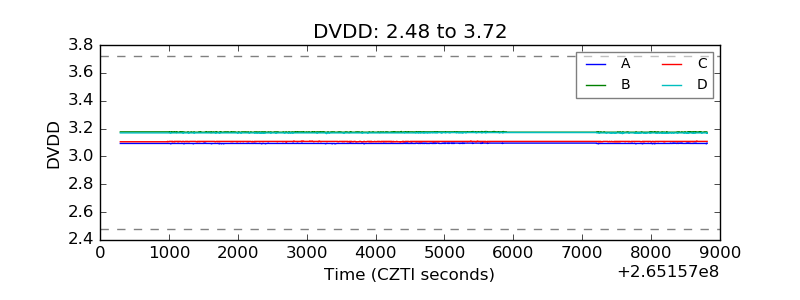 |
| Temperature 1 | 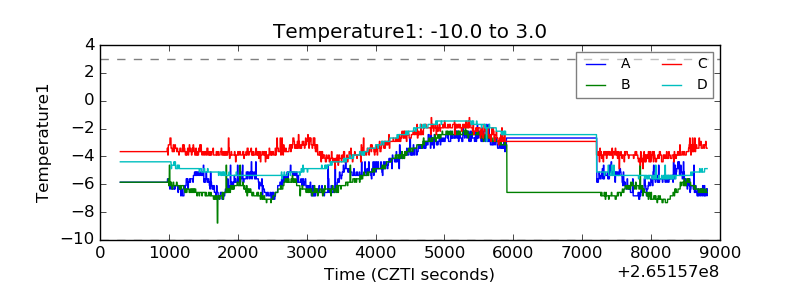 |
| Veto HV Monitor | 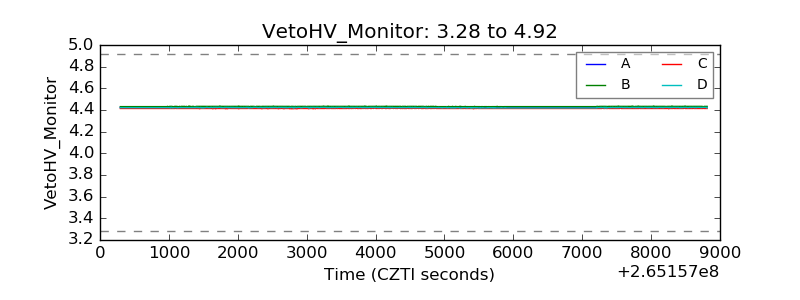 |
| Veto LLD | 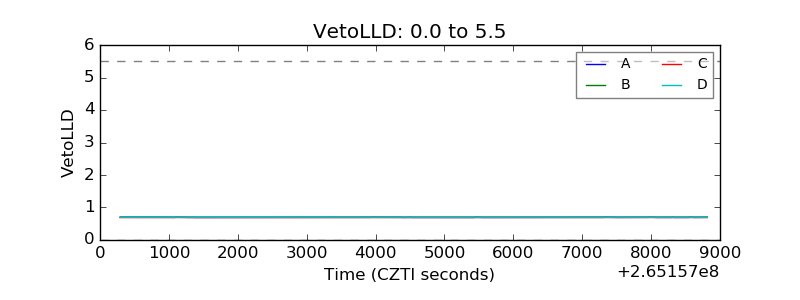 |
| Alpha Counter | 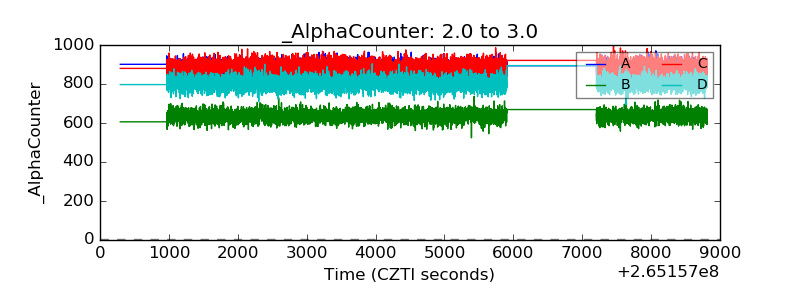 |
| _CPM_Rate | 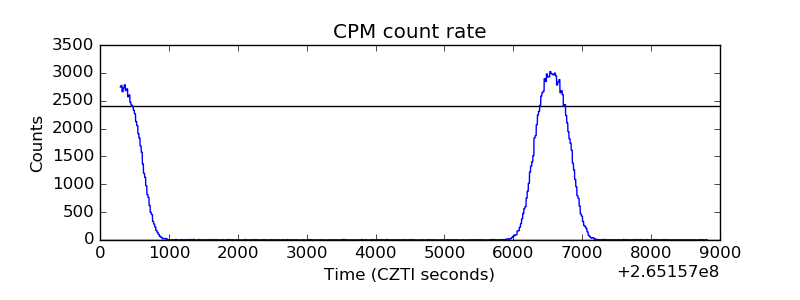 |
| CZT Counter | 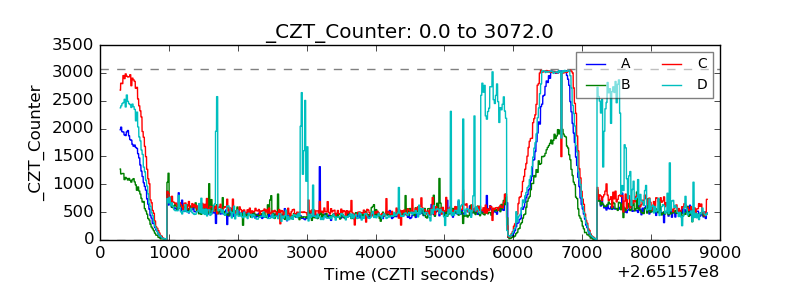 |
| +2.5 Volts monitor |  |
| +5 Volts monitor | 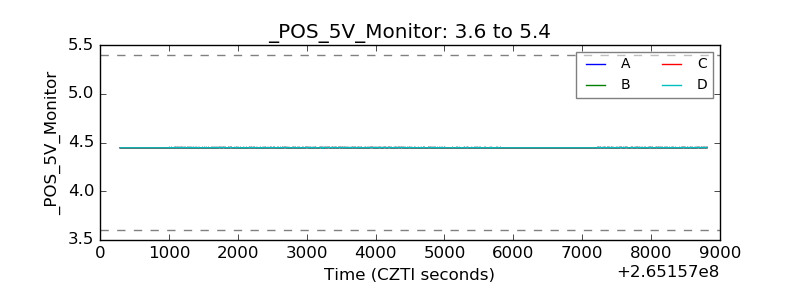 |
| _ROLL_ROT | 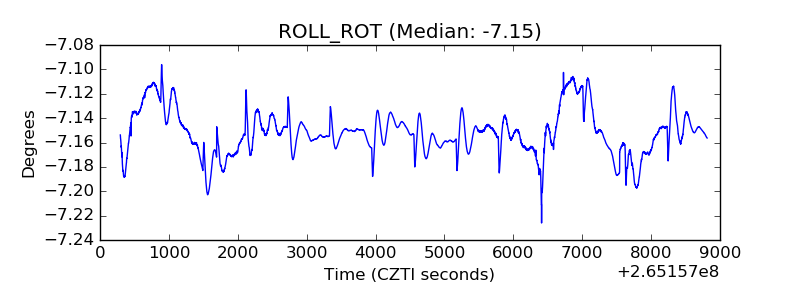 |
| _Roll_DEC | 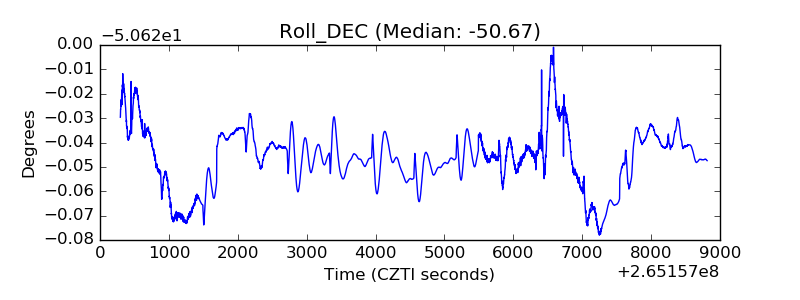 |
| _Roll_RA | 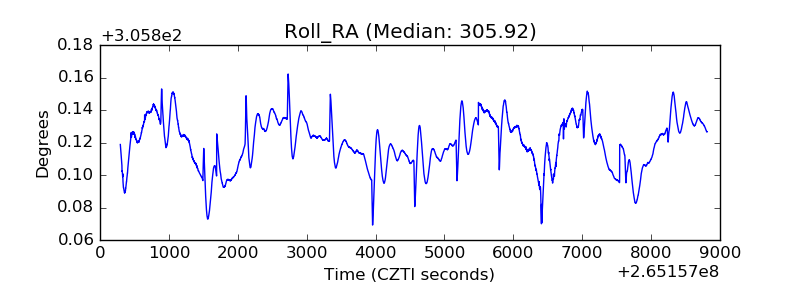 |
| Veto Counter | 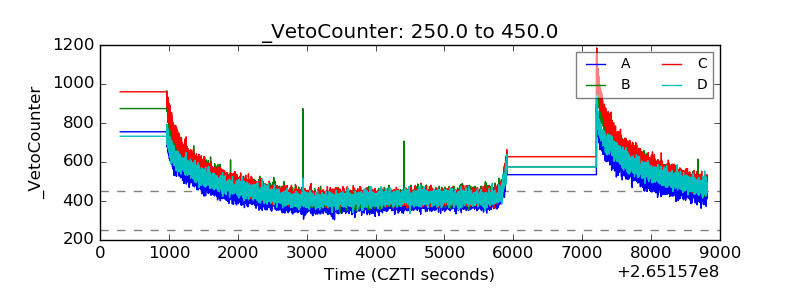 |