| Param | Original file | Final file |
|---|---|---|
| Filename | modeM0/AS1G08_066T04_9000002122_14402cztM0_level2.evt | modeM0/AS1G08_066T04_9000002122_14402cztM0_level2_quad_clean.evt |
| Size (bytes) | 459,054,720 | 88,367,040 |
| Size | 437.8 MB | 84.3 MB |
| Events in quadrant A | 2,874,827 | 579,565 |
| Events in quadrant B | 3,022,859 | 598,691 |
| Events in quadrant C | 3,419,687 | 582,274 |
| Events in quadrant D | 4,206,489 | 525,152 |
| Mode SS | |||
|---|---|---|---|
| Quadrant | BADHDUFLAG | Total packets | Discarded packets |
| A | 0 | 112 | 0 |
| B | 0 | 112 | 0 |
| C | 0 | 112 | 0 |
| D | 0 | 112 | 0 |
| Mode M0 | |||
|---|---|---|---|
| Quadrant | BADHDUFLAG | Total packets | Discarded packets |
| A | 0 | 11916 | 2 |
| B | 0 | 12429 | 2 |
| C | 0 | 13866 | 2 |
| D | 0 | 16107 | 2 |
| Mode M9 | |||
|---|---|---|---|
| Quadrant | BADHDUFLAG | Total packets | Discarded packets |
| A | 0 | 22 | 0 |
| B | 0 | 22 | 0 |
| C | 0 | 22 | 0 |
| D | 0 | 23 | 0 |
| Quadrant | Total seconds | Saturated seconds | Saturation percentage |
|---|---|---|---|
| A | 5584 | 23 | 0.411891% |
| B | 5584 | 53 | 0.949140% |
| C | 5584 | 32 | 0.573066% |
| D | 5584 | 444 | 7.951289% |
Noise dominated data is calculated using 1-second bins in cleaned event files. If a bin has >2000 counts, and if more than 50% of those come from <1% of pixels, then it is considered to be noise-dominated and hence unusable.
| Quadrant | # 1 sec bins | Bins with >0 counts | Bins with >2000 counts | High rate bins dominated by noise | Noise dominated (total time) | Noise dominated (detector-on time) | Marked lightcurve |
|---|---|---|---|---|---|---|---|
| A | 6940 | 5586 | 2 | 2 | 0.03% | 0.04% |  |
| B | 6940 | 5586 | 12 | 12 | 0.17% | 0.21% |  |
| C | 6940 | 5586 | 0 | 0 | 0.00% | 0.00% |  |
| D | 6940 | 5586 | 412 | 412 | 5.94% | 7.38% |  |
Top three noisy pixels from each quadrant. If the there are fewer than three noisy pixels in the level2.evt file, extra rows are filled as -1
| Pixel properties | Quadrant properties | ||||||
|---|---|---|---|---|---|---|---|
| Quadrant | DetID | PixID | Counts | Sigma | Mean | Median | Sigma |
| A | 12 | 189 | 43380 | 293.66 | 724 | 708 | 145.3 |
| A | 8 | 15 | 19912 | 132.16 | 724 | 708 | 145.3 |
| A | 11 | 29 | 15012 | 98.44 | 724 | 708 | 145.3 |
| B | 0 | 189 | 59438 | 432.96 | 727 | 709 | 135.6 |
| B | 0 | 229 | 52986 | 385.39 | 727 | 709 | 135.6 |
| B | 4 | 173 | 44042 | 319.46 | 727 | 709 | 135.6 |
| C | 3 | 233 | 595148 | 3623.03 | 723 | 729 | 164.1 |
| C | 13 | 61 | 5132 | 26.84 | 723 | 729 | 164.1 |
| C | 14 | 234 | 3411 | 16.35 | 723 | 729 | 164.1 |
| D | 13 | 122 | 909715 | 5627.12 | 684 | 670 | 161.5 |
| D | 15 | 0 | 450709 | 2785.8 | 684 | 670 | 161.5 |
| D | 2 | 120 | 153533 | 946.24 | 684 | 670 | 161.5 |
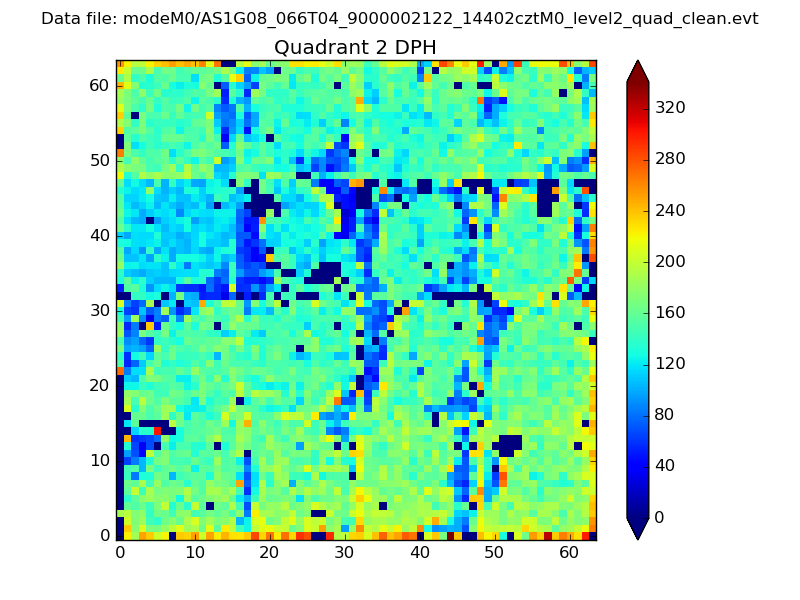
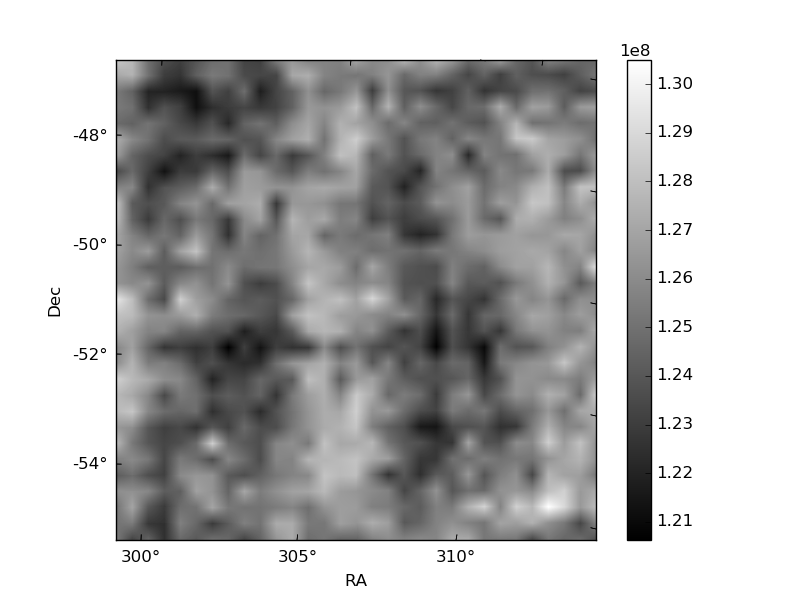
Histogram calculated using DETX and DETY for each event in the final _common_clean file
| Quadrant A | 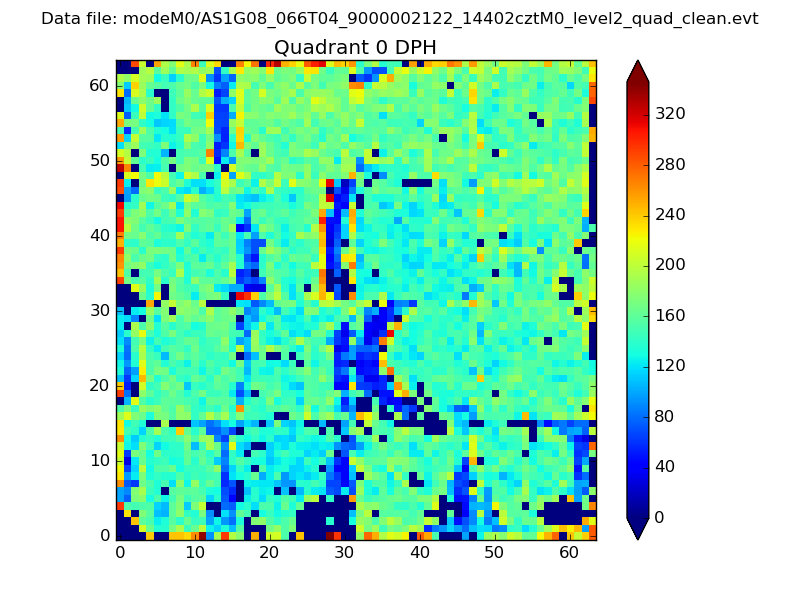 |
 |
Quadrant B |
|---|---|---|---|
| Quadrant D | 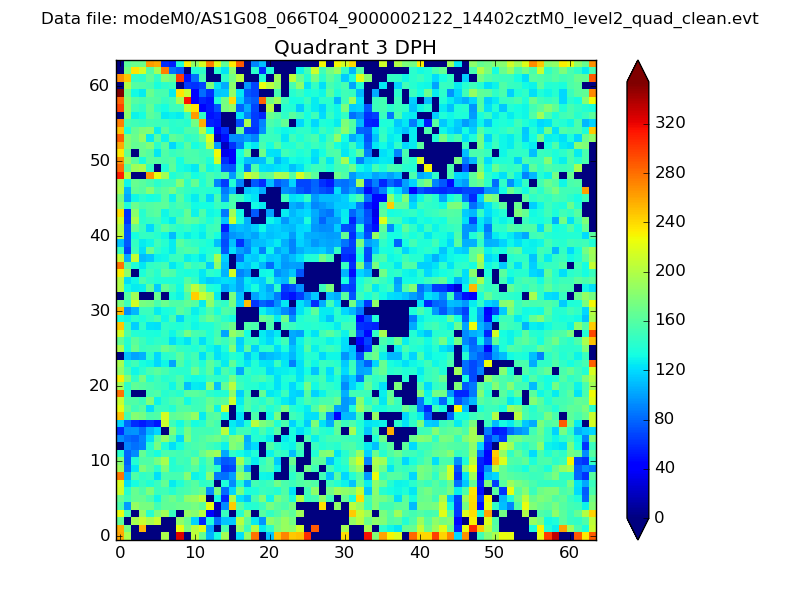 |
 |
Quadrant C |
| Plot type | Count rate plots | Images |
|---|---|---|
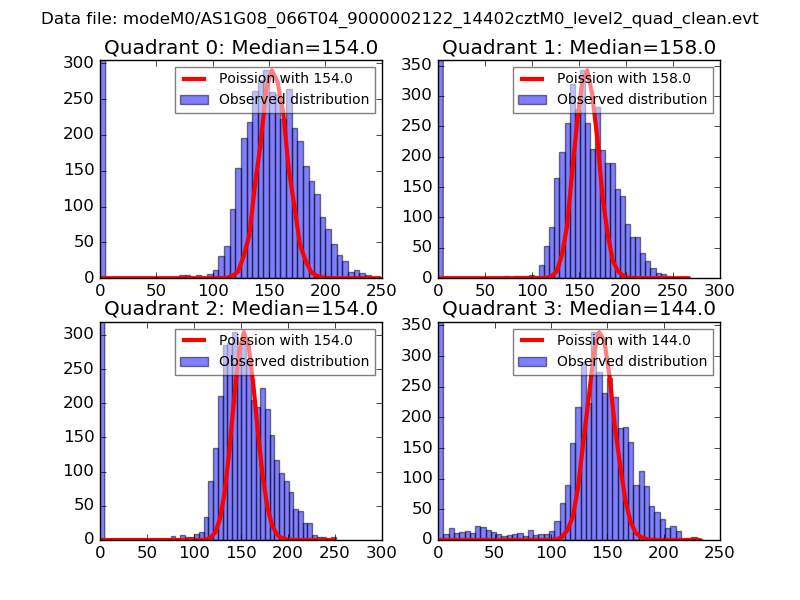
| Comparison with Poisson distribution Blue bars denote a histogram of data divided into 1 sec bins. Red curve is a Poisson curve with rate = median count rate of data. |
 |
 |
| Quadrant-wise count rates Data is divided into 100 sec bins |
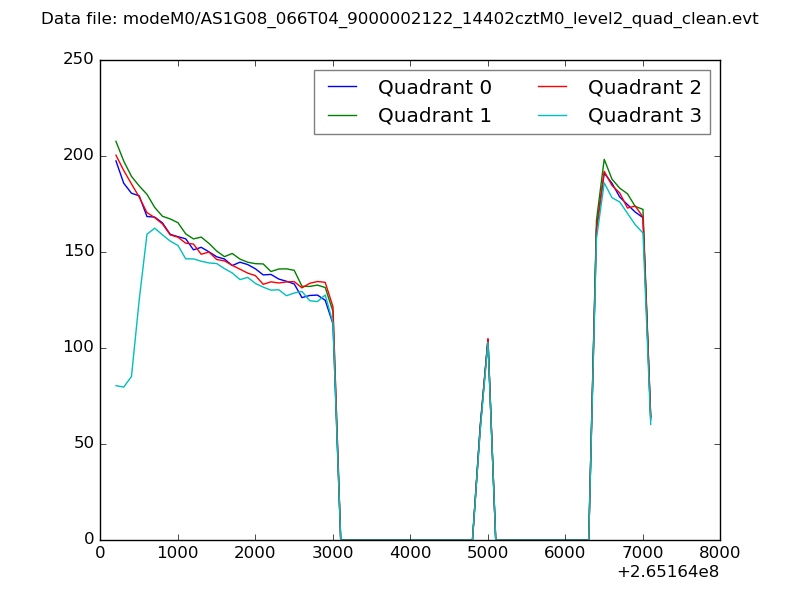 |
|
| Module-wise count rates for Quadrant A Data is divided into 100 sec bins |
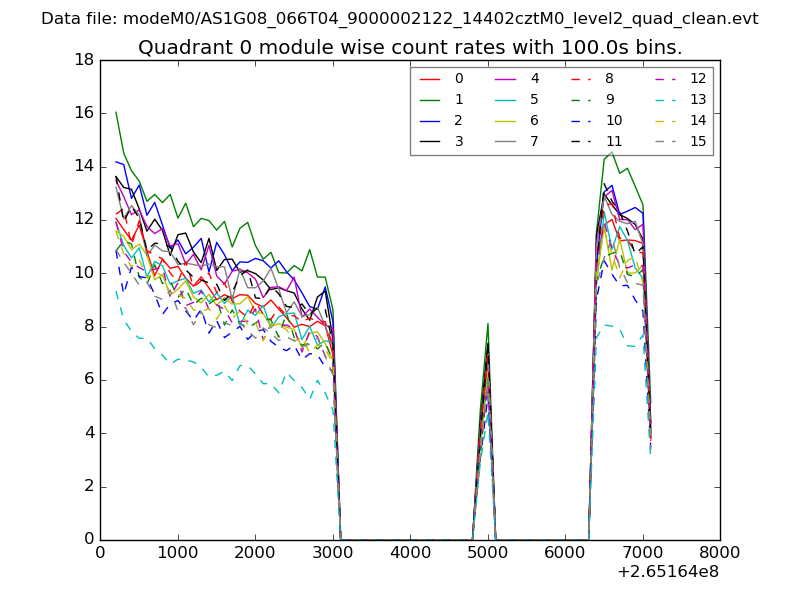 |
 |
| Module-wise count rates for Quadrant B Data is divided into 100 sec bins |
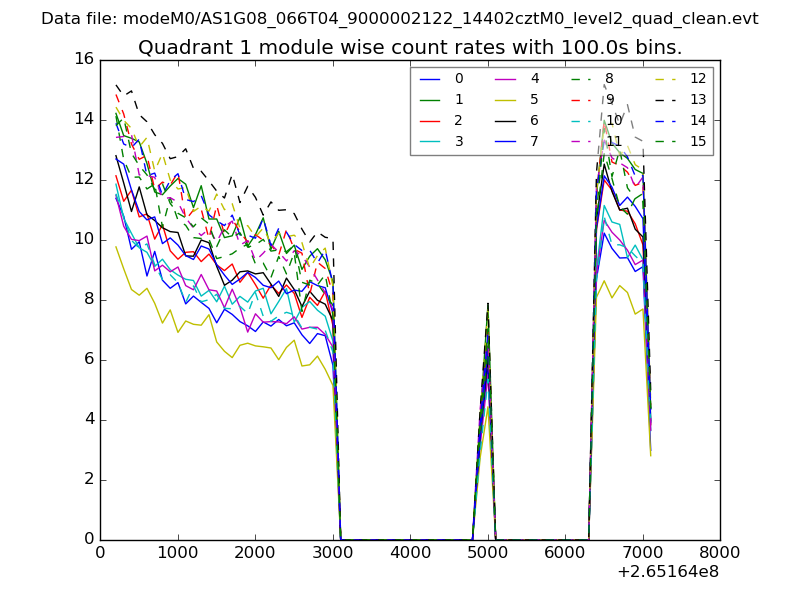 |
 |
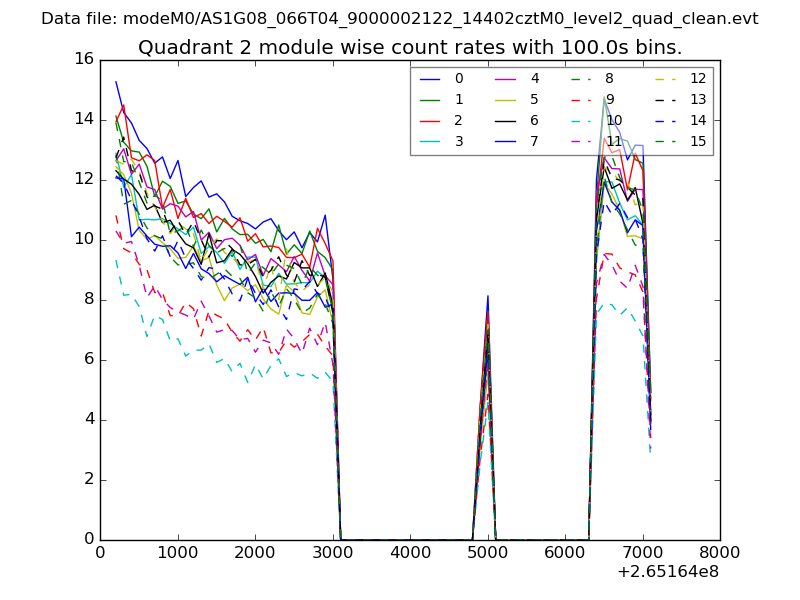
| Module-wise count rates for Quadrant C Data is divided into 100 sec bins |
 |
 |
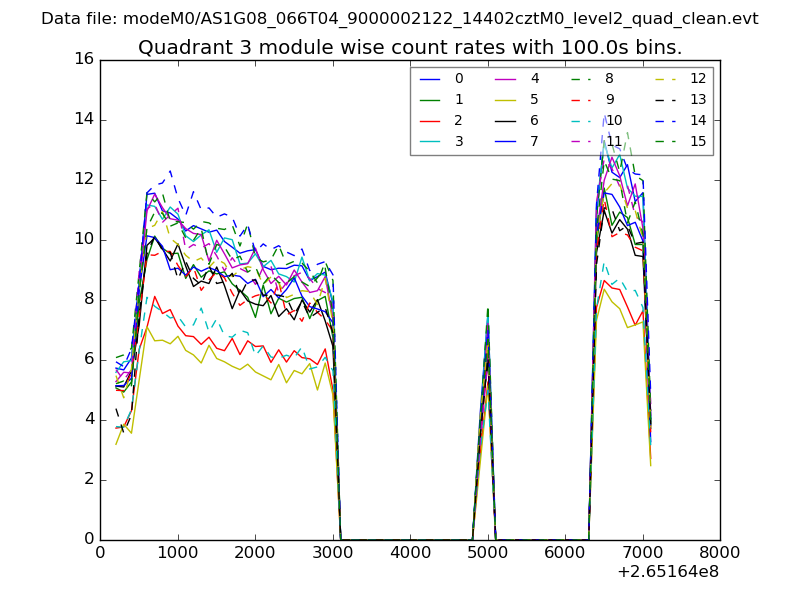
| Module-wise count rates for Quadrant D Data is divided into 100 sec bins |
 |
 |
| Parameter | Plot |
|---|---|
| CZT HV Monitor | 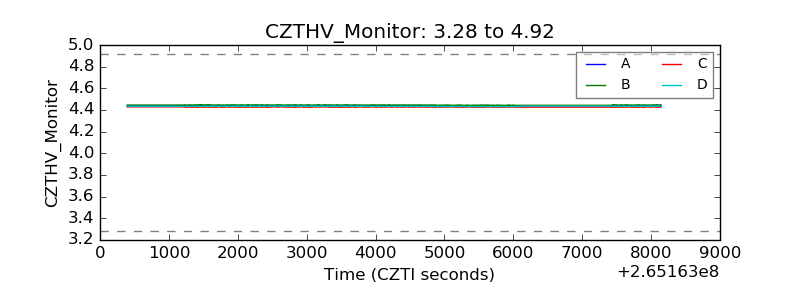 |
| D_VDD | 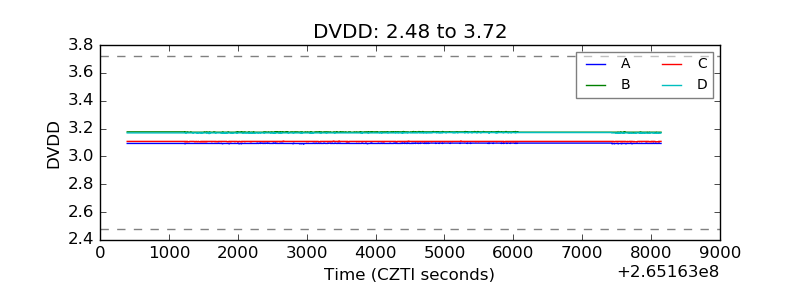 |
| Temperature 1 | 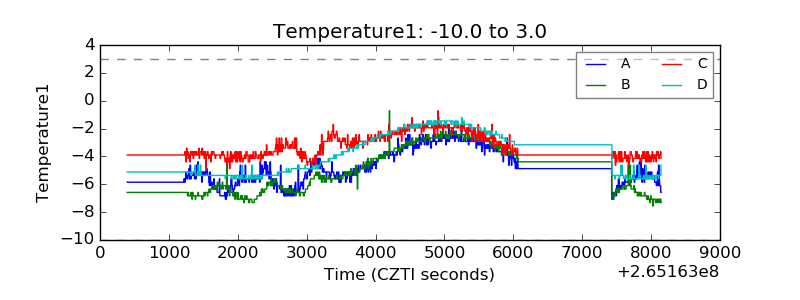 |
| Veto HV Monitor | 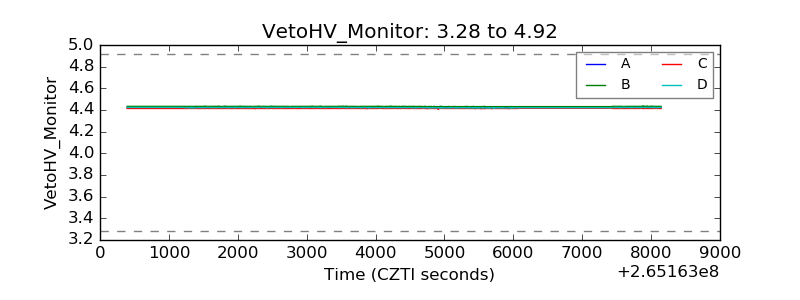 |
| Veto LLD | 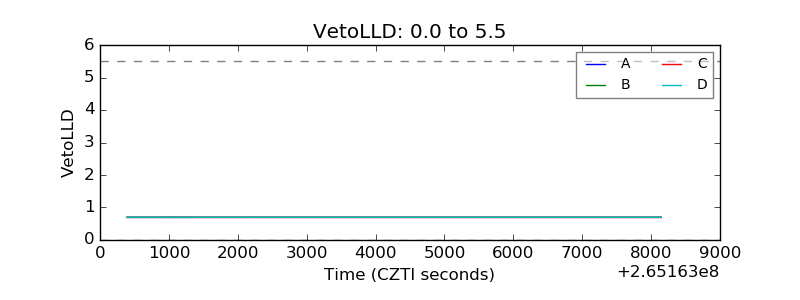 |
| Alpha Counter | 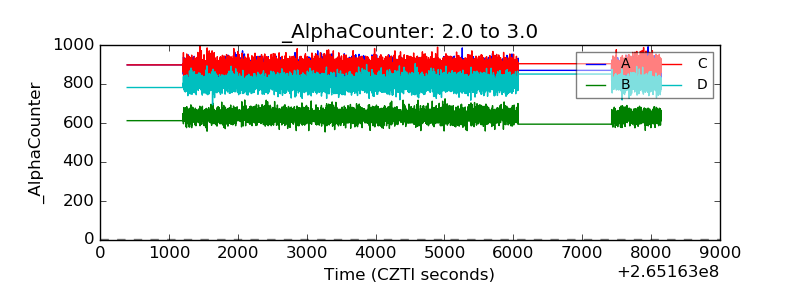 |
| _CPM_Rate |  |
| CZT Counter | 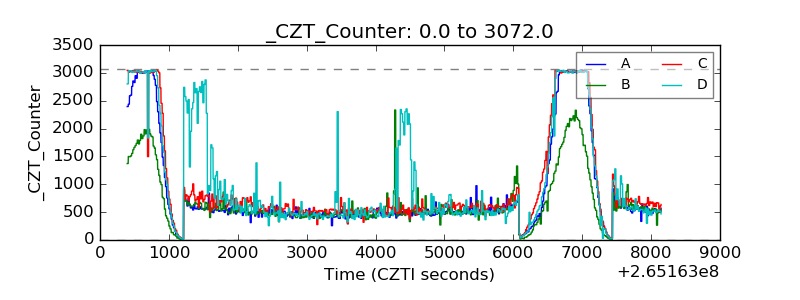 |
| +2.5 Volts monitor |  |
| +5 Volts monitor |  |
| _ROLL_ROT | 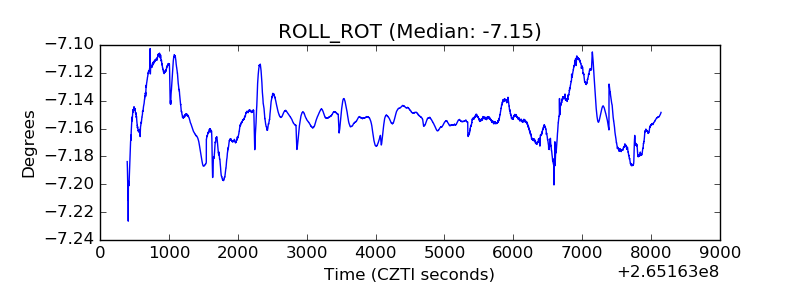 |
| _Roll_DEC | 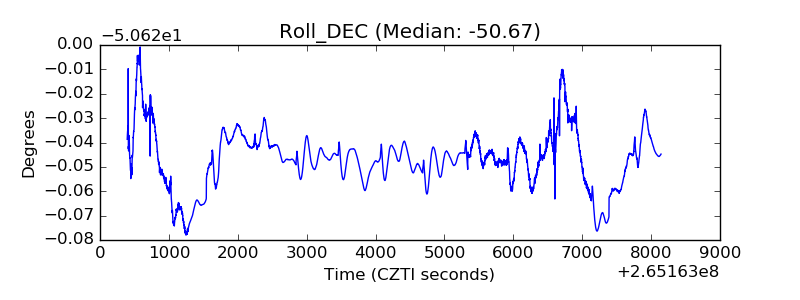 |
| _Roll_RA | 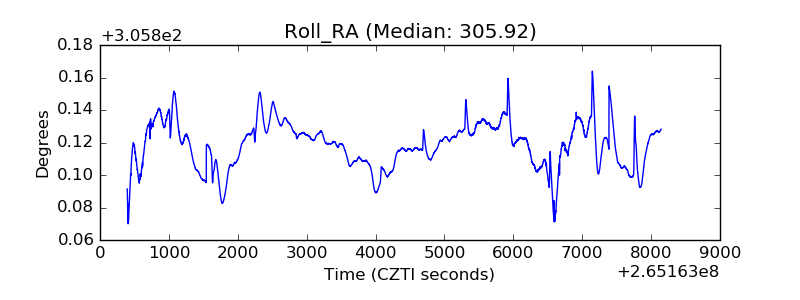 |
| Veto Counter | 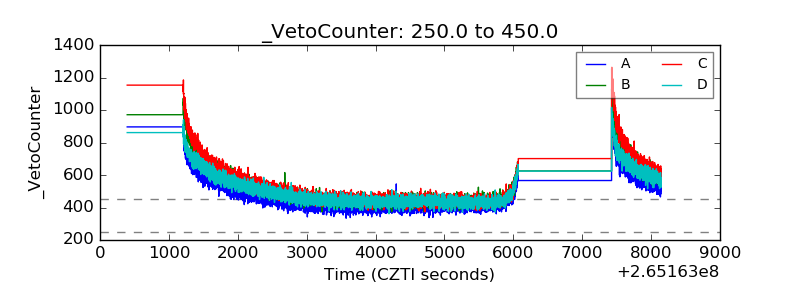 |