| Param | Original file | Final file |
|---|---|---|
| Filename | modeM0/AS1A04_023T02_9000002124cztM0_level2.fits | modeM0/AS1A04_023T02_9000002124cztM0_level2_quad_clean.evt |
| Size (bytes) | 327,908,160 | 315,745,920 |
| Size | 312.7 MB | 301.1 MB |
| Events in quadrant A | 2,010,636 | 1,919,423 |
| Events in quadrant B | 1,929,662 | 1,893,766 |
| Events in quadrant C | 1,965,076 | 1,799,700 |
| Events in quadrant D | 1,713,698 | 1,638,301 |
| Mode M9 | |||
|---|---|---|---|
| Quadrant | BADHDUFLAG | Total packets | Discarded packets |
| A | 0 | 42 | 0 |
| B | 0 | 42 | 0 |
| C | 0 | 42 | 0 |
| D | 0 | 42 | 0 |
| Mode M0 | |||
|---|---|---|---|
| Quadrant | BADHDUFLAG | Total packets | Discarded packets |
| A | 0 | 70977 | 0 |
| B | 0 | 75000 | 0 |
| C | 0 | 85706 | 0 |
| D | 0 | 81998 | 0 |
| Mode SS | |||
|---|---|---|---|
| Quadrant | BADHDUFLAG | Total packets | Discarded packets |
| A | 0 | 682 | 0 |
| B | 0 | 682 | 0 |
| C | 0 | 682 | 0 |
| D | 0 | 682 | 0 |
| Quadrant | Total seconds | Saturated seconds | Saturation percentage |
|---|---|---|---|
| A | 33637 | 827 | 2.458602% |
| B | 33637 | 1183 | 3.516960% |
| C | 33637 | 739 | 2.196985% |
| D | 33637 | 1346 | 4.001546% |
Noise dominated data is calculated using 1-second bins in cleaned event files. If a bin has >2000 counts, and if more than 50% of those come from <1% of pixels, then it is considered to be noise-dominated and hence unusable.
| Quadrant | # 1 sec bins | Bins with >0 counts | Bins with >2000 counts | High rate bins dominated by noise | Noise dominated (total time) | Noise dominated (detector-on time) | Marked lightcurve |
|---|---|---|---|---|---|---|---|
| A | 37799 | 33632 | 0 | 0 | 0.00% | 0.00% | 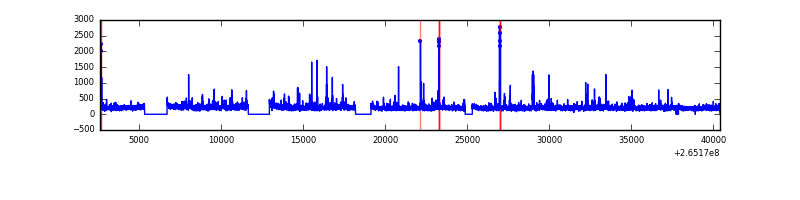 |
| B | 37799 | 33631 | 0 | 0 | 0.00% | 0.00% |  |
| C | 37799 | 33634 | 0 | 0 | 0.00% | 0.00% | 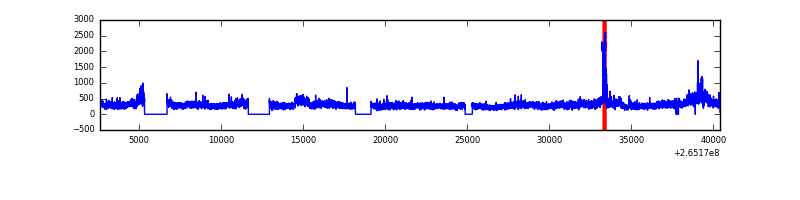 |
| D | 37799 | 33626 | 0 | 0 | 0.00% | 0.00% |  |
Top three noisy pixels from each quadrant. If the there are fewer than three noisy pixels in the level2.evt file, extra rows are filled as -1
| Pixel properties | Quadrant properties | ||||||
|---|---|---|---|---|---|---|---|
| Quadrant | DetID | PixID | Counts | Sigma | Mean | Median | Sigma |
| A | 0 | 29 | 1992 | 11.49 | 523 | 490 | 130.7 |
| A | 7 | 110 | 1637 | 8.78 | 523 | 490 | 130.7 |
| A | 15 | 236 | 1572 | 8.28 | 523 | 490 | 130.7 |
| B | 2 | 9 | 1626 | 10.88 | 509 | 484 | 105.0 |
| B | 3 | 17 | 1292 | 7.69 | 509 | 484 | 105.0 |
| B | 5 | 232 | 1261 | 7.4 | 509 | 484 | 105.0 |
| C | 1 | 80 | 1407 | 6.78 | 519 | 482 | 136.5 |
| C | 1 | 81 | 1393 | 6.68 | 519 | 482 | 136.5 |
| C | 3 | 126 | 1391 | 6.66 | 519 | 482 | 136.5 |
| D | 6 | 231 | 1270 | 6.22 | 489 | 445 | 132.6 |
| D | 3 | 14 | 1269 | 6.21 | 489 | 445 | 132.6 |
| D | 7 | 5 | 1241 | 6.0 | 489 | 445 | 132.6 |
Histogram calculated using DETX and DETY for each event in the final _common_clean file
| Quadrant A | 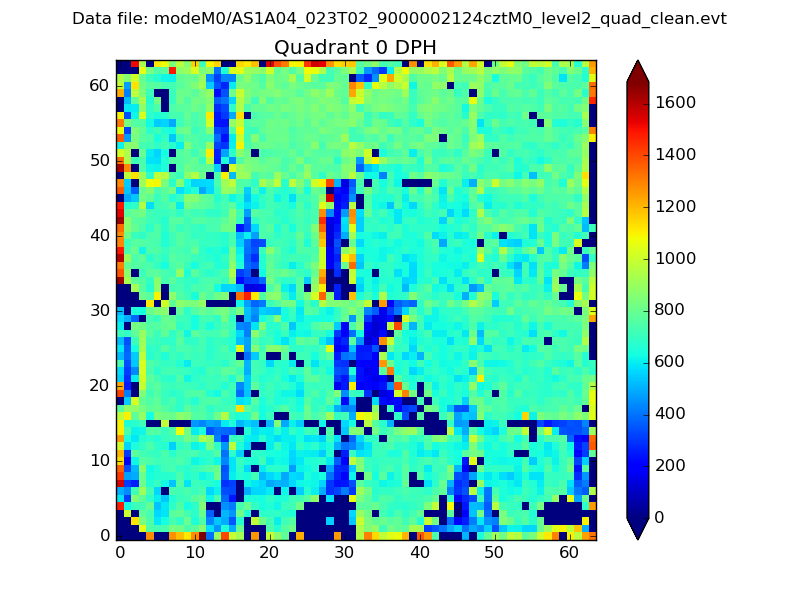 |
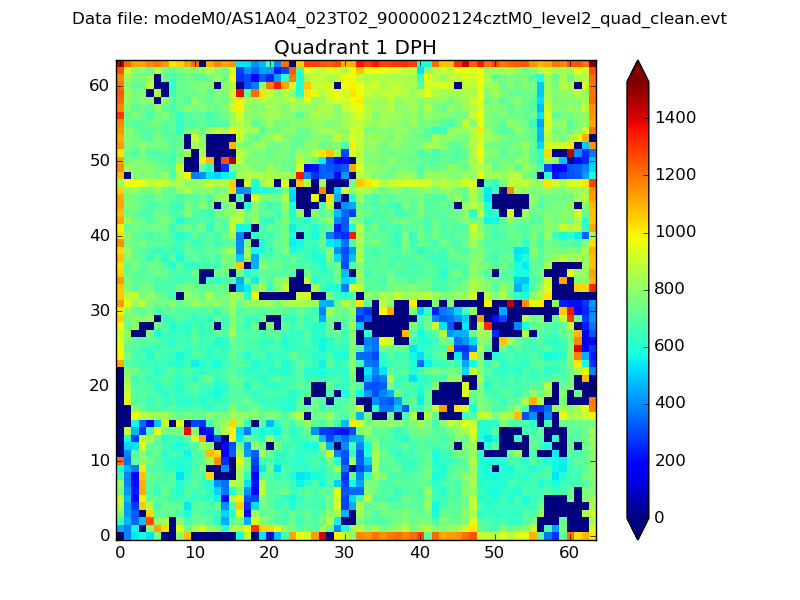 |
Quadrant B |
|---|---|---|---|
| Quadrant D |  |
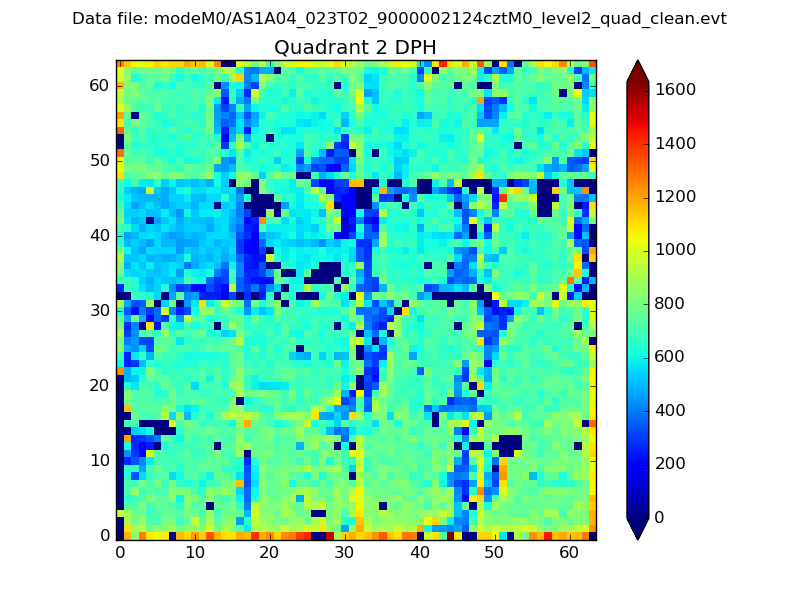 |
Quadrant C |
| Plot type | Count rate plots | Images |
|---|---|---|
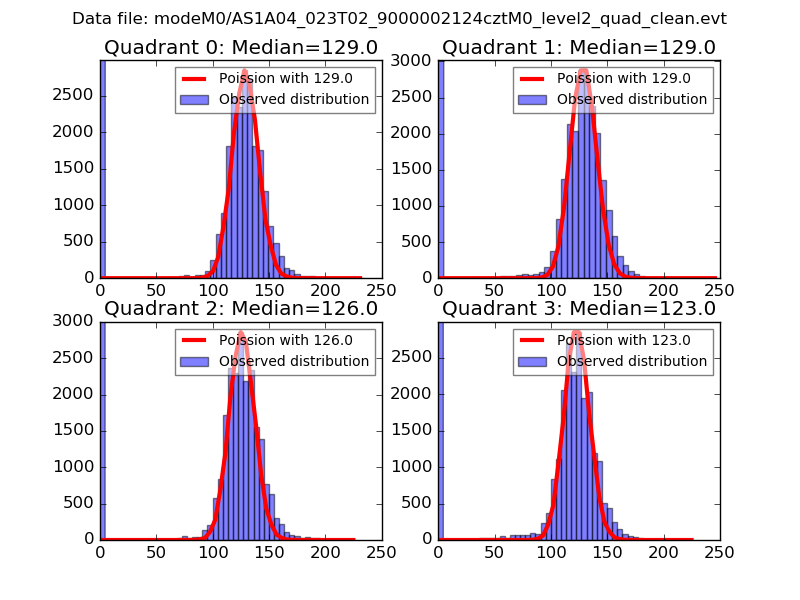
| Comparison with Poisson distribution Blue bars denote a histogram of data divided into 1 sec bins. Red curve is a Poisson curve with rate = median count rate of data. |
 |
 |
| Quadrant-wise count rates Data is divided into 100 sec bins |
 |
|
| Module-wise count rates for Quadrant A Data is divided into 100 sec bins |
 |
 |
| Module-wise count rates for Quadrant B Data is divided into 100 sec bins |
 |
 |
| Module-wise count rates for Quadrant C Data is divided into 100 sec bins |
 |
 |
| Module-wise count rates for Quadrant D Data is divided into 100 sec bins |
 |
 |
| Parameter | Plot |
|---|---|
| CZT HV Monitor | 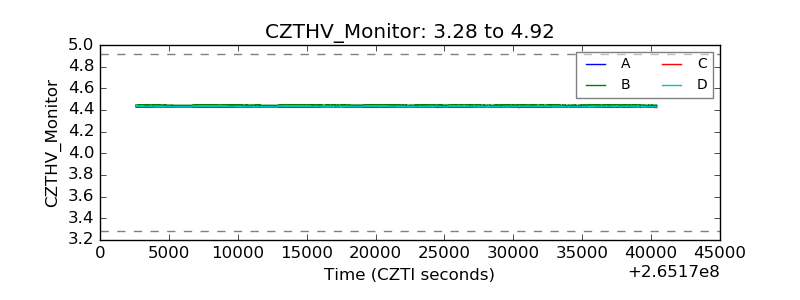 |
| D_VDD | 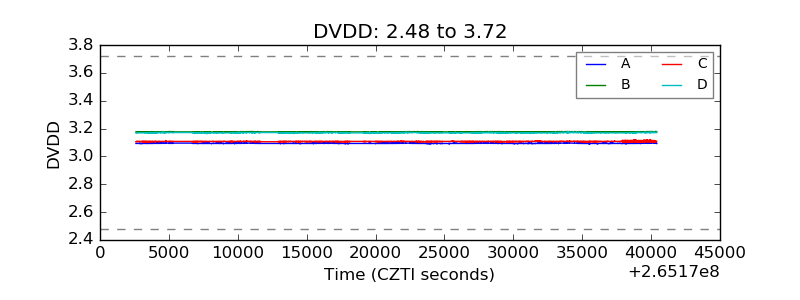 |
| Temperature 1 |  |
| Veto HV Monitor | 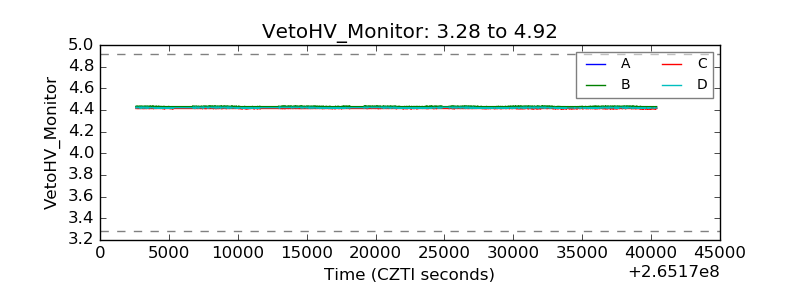 |
| Veto LLD | 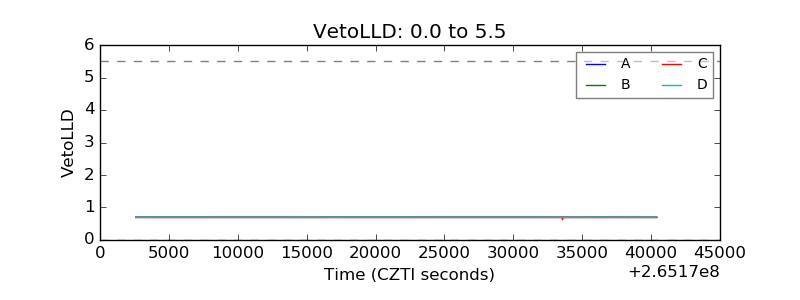 |
| Alpha Counter | 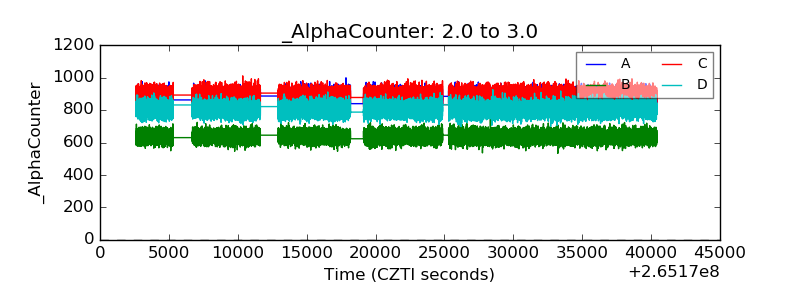 |
| _CPM_Rate |  |
| CZT Counter |  |
| +2.5 Volts monitor |  |
| +5 Volts monitor |  |
| _ROLL_ROT |  |
| _Roll_DEC |  |
| _Roll_RA | 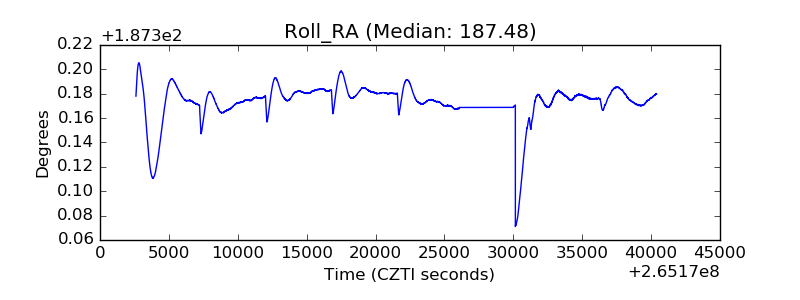 |
| Veto Counter | 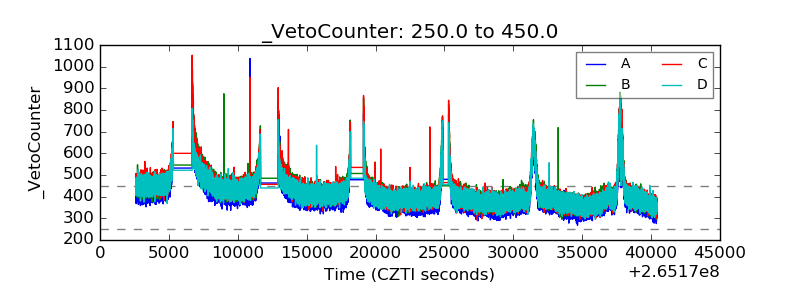 |