| Param | Original file | Final file |
|---|---|---|
| Filename | modeM0/AS1A04_023T02_9000002124_14402cztM0_level2.evt | modeM0/AS1A04_023T02_9000002124_14402cztM0_level2_quad_clean.evt |
| Size (bytes) | 308,134,080 | 50,483,520 |
| Size | 293.9 MB | 48.1 MB |
| Events in quadrant A | 2,065,721 | 316,413 |
| Events in quadrant B | 2,187,407 | 320,495 |
| Events in quadrant C | 2,586,741 | 314,555 |
| Events in quadrant D | 2,226,224 | 301,625 |
| Mode M9 | |||
|---|---|---|---|
| Quadrant | BADHDUFLAG | Total packets | Discarded packets |
| A | 0 | 13 | 0 |
| B | 0 | 13 | 0 |
| C | 0 | 13 | 0 |
| D | 0 | 13 | 0 |
| Mode M0 | |||
|---|---|---|---|
| Quadrant | BADHDUFLAG | Total packets | Discarded packets |
| A | 0 | 8334 | 2 |
| B | 0 | 8773 | 1 |
| C | 0 | 10437 | 1 |
| D | 0 | 9018 | 1 |
| Mode SS | |||
|---|---|---|---|
| Quadrant | BADHDUFLAG | Total packets | Discarded packets |
| A | 0 | 80 | 0 |
| B | 0 | 80 | 0 |
| C | 0 | 80 | 0 |
| D | 0 | 80 | 0 |
| Quadrant | Total seconds | Saturated seconds | Saturation percentage |
|---|---|---|---|
| A | 3898 | 38 | 0.974859% |
| B | 3898 | 62 | 1.590559% |
| C | 3898 | 80 | 2.052335% |
| D | 3898 | 85 | 2.180605% |
Noise dominated data is calculated using 1-second bins in cleaned event files. If a bin has >2000 counts, and if more than 50% of those come from <1% of pixels, then it is considered to be noise-dominated and hence unusable.
| Quadrant | # 1 sec bins | Bins with >0 counts | Bins with >2000 counts | High rate bins dominated by noise | Noise dominated (total time) | Noise dominated (detector-on time) | Marked lightcurve |
|---|---|---|---|---|---|---|---|
| A | 5274 | 3900 | 7 | 7 | 0.13% | 0.18% | 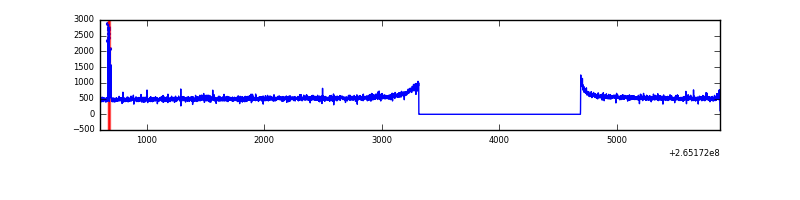 |
| B | 5274 | 3899 | 4 | 4 | 0.08% | 0.10% | 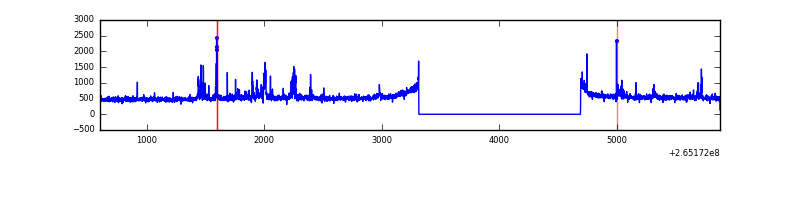 |
| C | 5274 | 3900 | 0 | 0 | 0.00% | 0.00% | 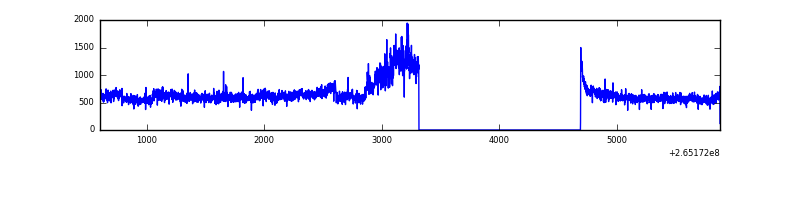 |
| D | 5274 | 3900 | 72 | 72 | 1.37% | 1.85% | 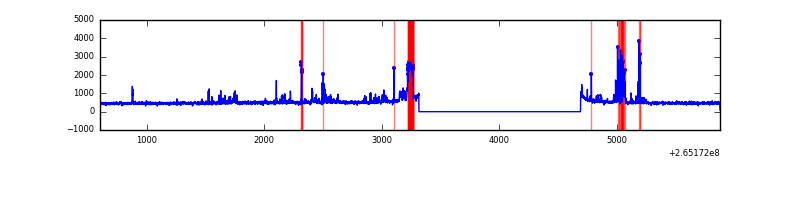 |
Top three noisy pixels from each quadrant. If the there are fewer than three noisy pixels in the level2.evt file, extra rows are filled as -1
| Pixel properties | Quadrant properties | ||||||
|---|---|---|---|---|---|---|---|
| Quadrant | DetID | PixID | Counts | Sigma | Mean | Median | Sigma |
| A | 9 | 143 | 34670 | 321.24 | 522 | 512 | 106.3 |
| A | 12 | 189 | 13197 | 119.3 | 522 | 512 | 106.3 |
| A | 11 | 29 | 5571 | 47.58 | 522 | 512 | 106.3 |
| B | 0 | 189 | 64519 | 645.54 | 518 | 507 | 99.2 |
| B | 0 | 229 | 41415 | 412.54 | 518 | 507 | 99.2 |
| B | 4 | 173 | 26342 | 260.54 | 518 | 507 | 99.2 |
| C | 3 | 233 | 613267 | 5191.19 | 506 | 510 | 118.0 |
| C | 13 | 61 | 3570 | 25.92 | 506 | 510 | 118.0 |
| C | 3 | 232 | 1396 | 7.51 | 506 | 510 | 118.0 |
| D | 2 | 120 | 173451 | 1431.08 | 499 | 488 | 120.9 |
| D | 15 | 0 | 120995 | 997.06 | 499 | 488 | 120.9 |
| D | 10 | 199 | 15394 | 123.33 | 499 | 488 | 120.9 |
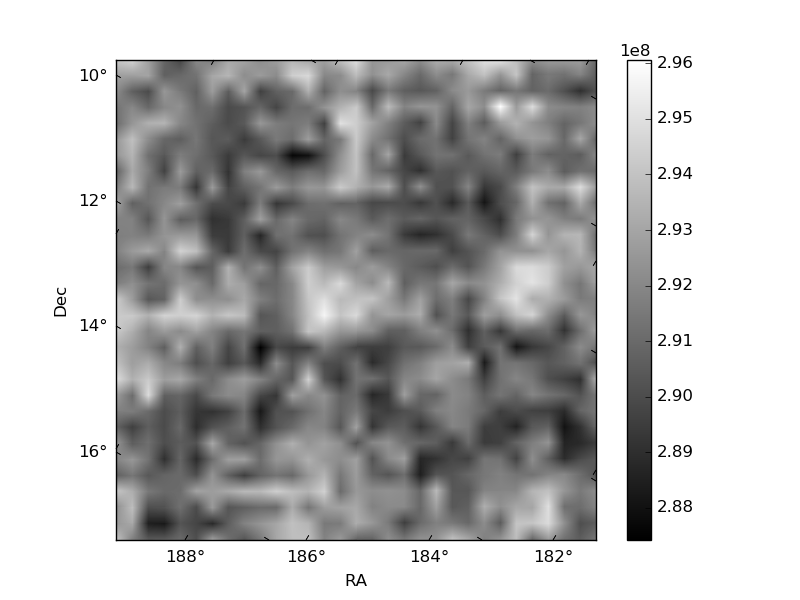
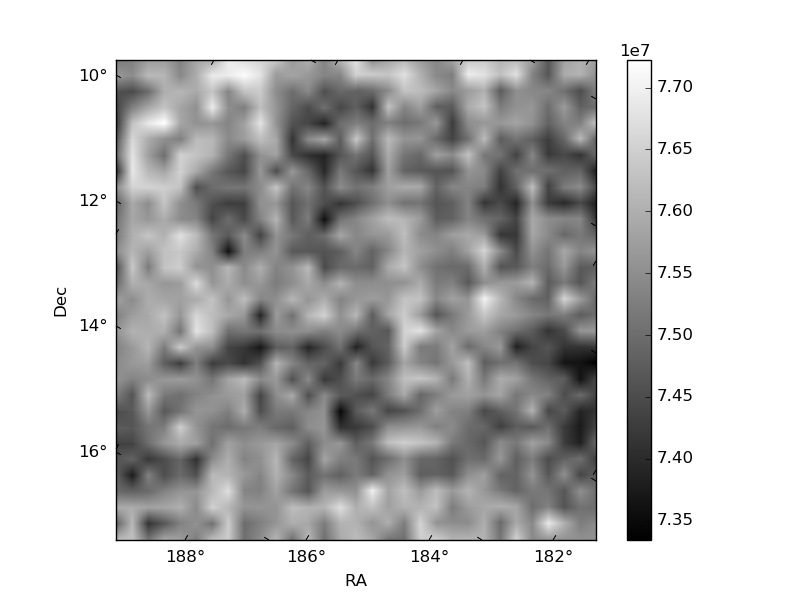
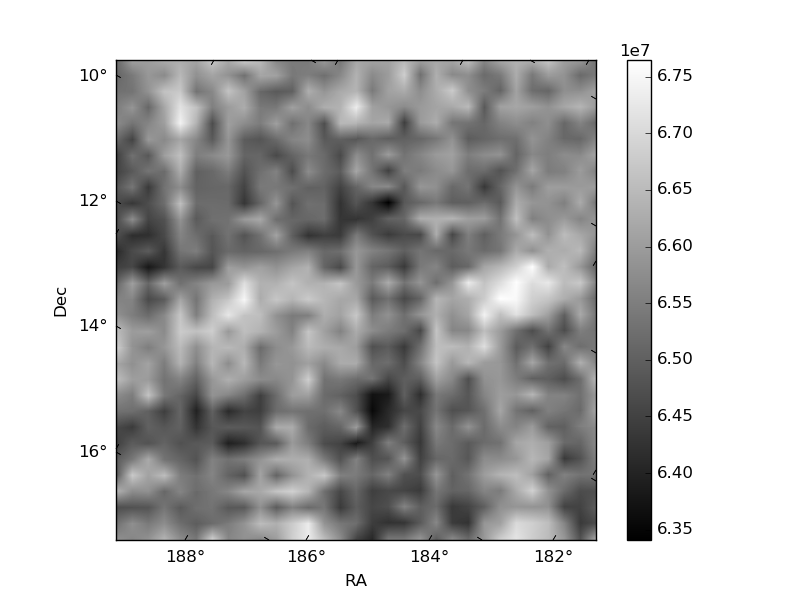
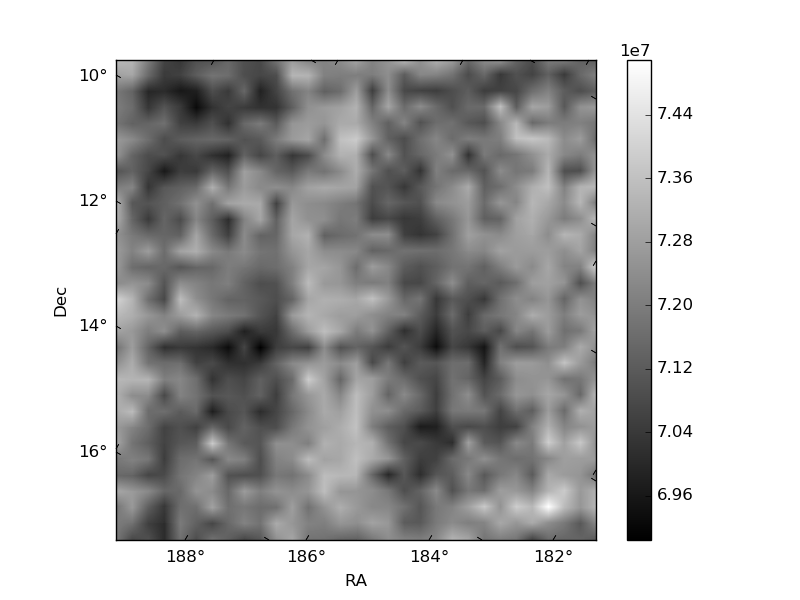
Histogram calculated using DETX and DETY for each event in the final _common_clean file
| Quadrant A | 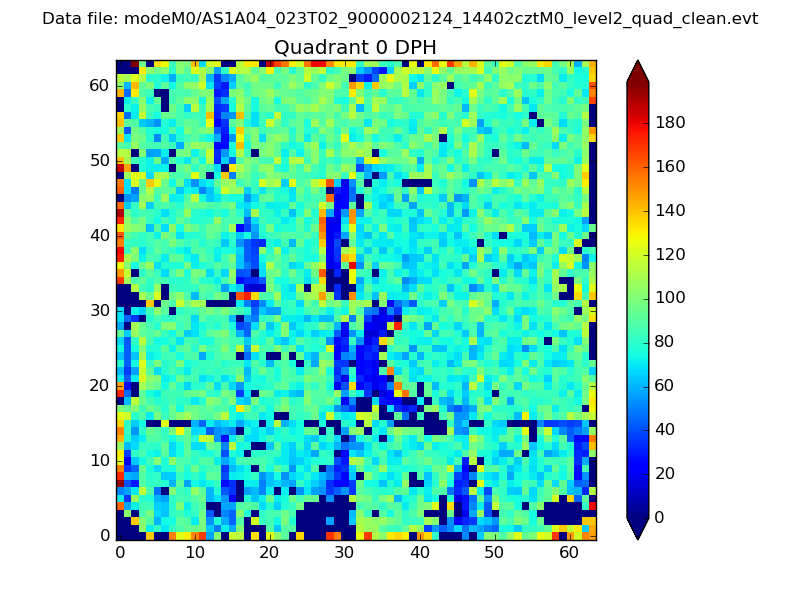 |
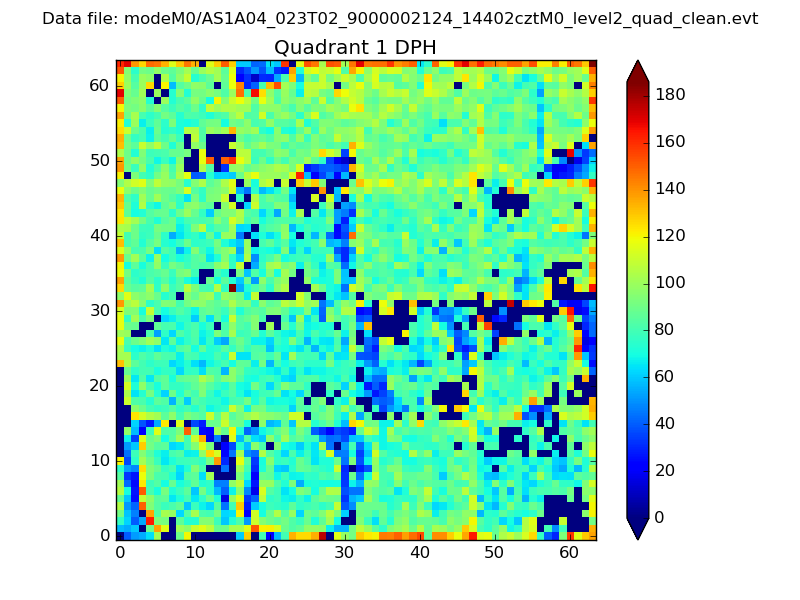 |
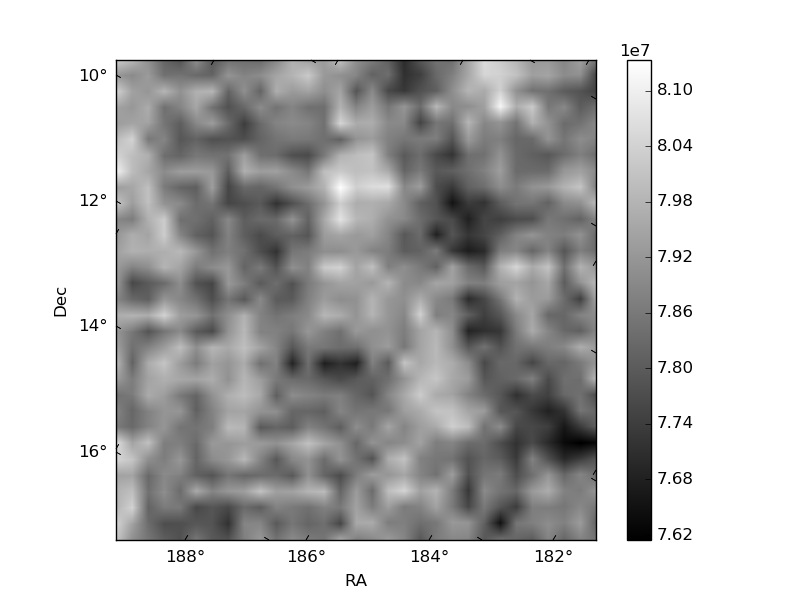
Quadrant B |
|---|---|---|---|
| Quadrant D | 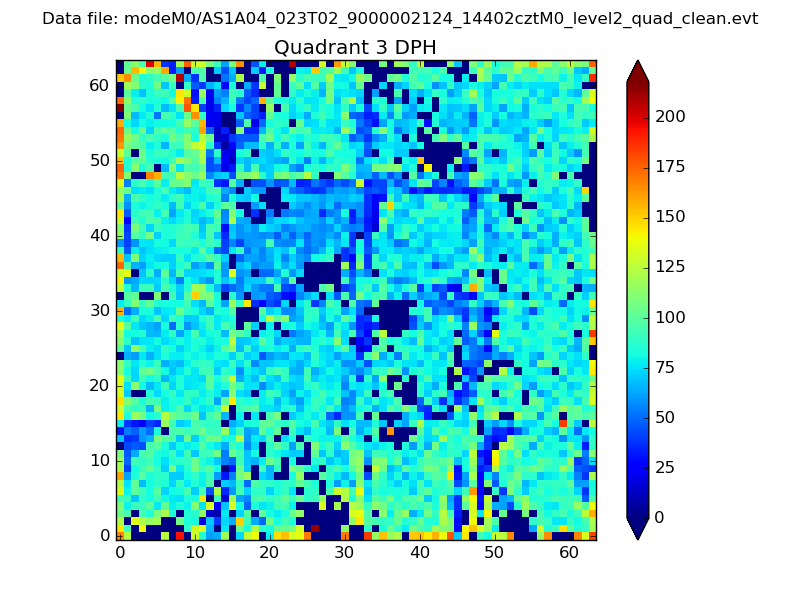 |
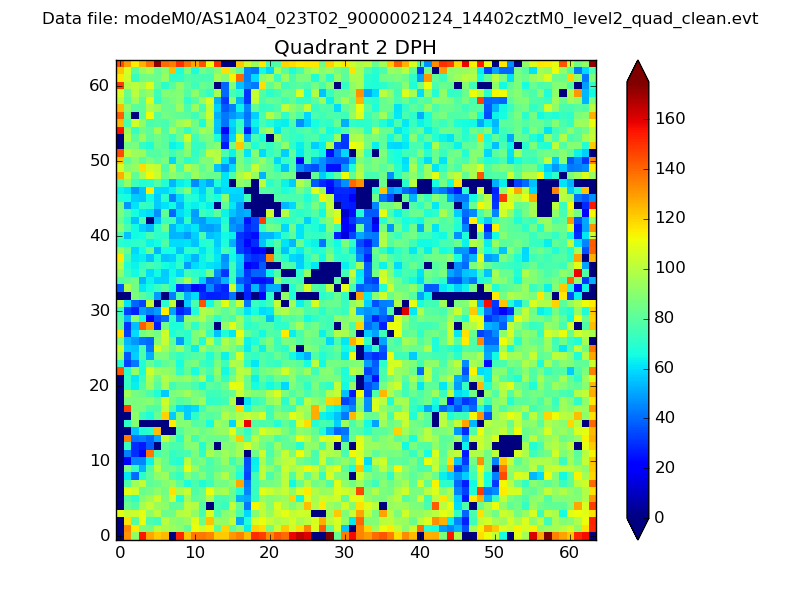 |
Quadrant C |
| Plot type | Count rate plots | Images |
|---|---|---|
| Comparison with Poisson distribution Blue bars denote a histogram of data divided into 1 sec bins. Red curve is a Poisson curve with rate = median count rate of data. |
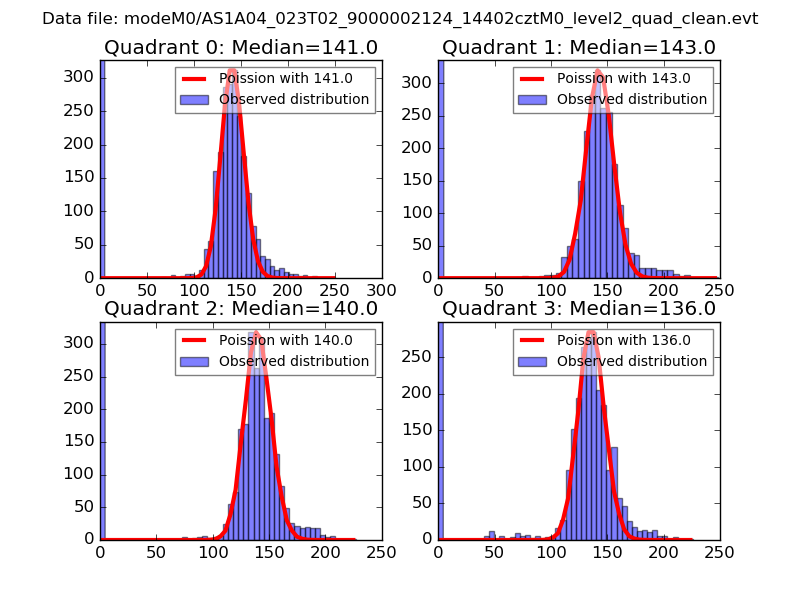 |
 |
| Quadrant-wise count rates Data is divided into 100 sec bins |
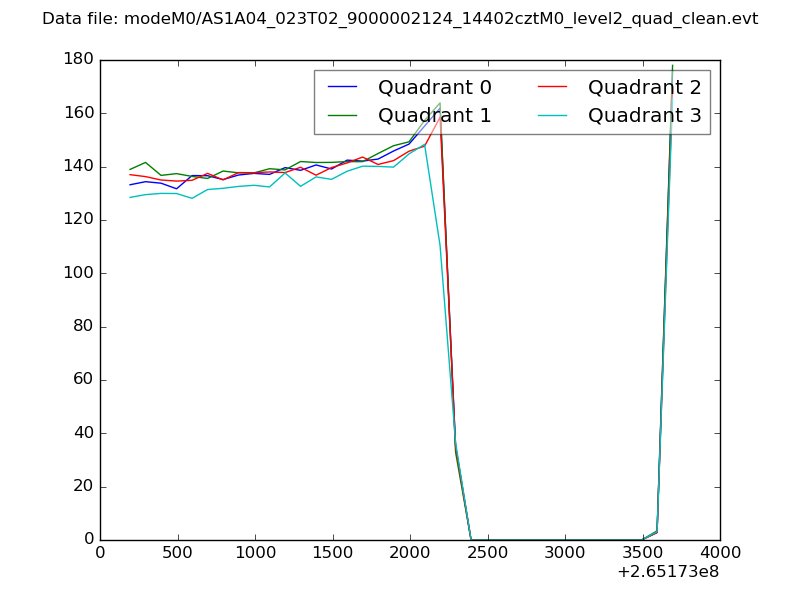 |
|
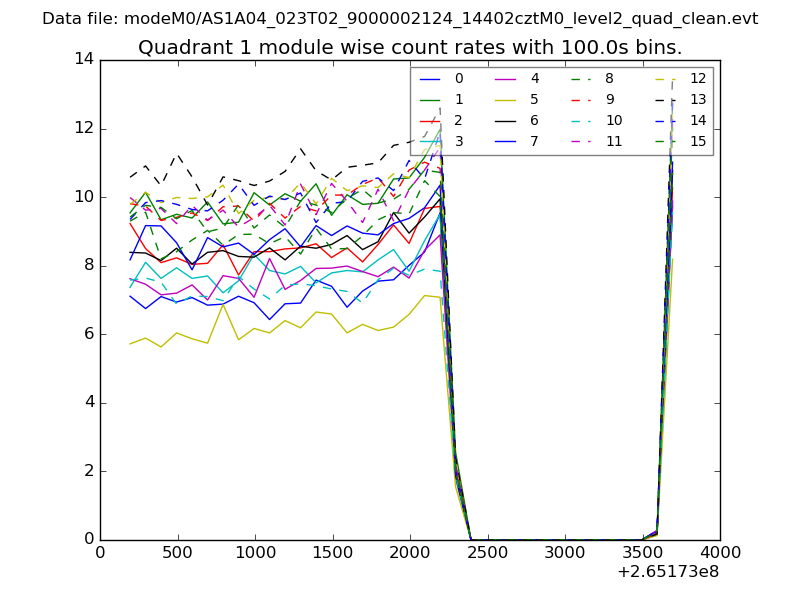
| Module-wise count rates for Quadrant A Data is divided into 100 sec bins |
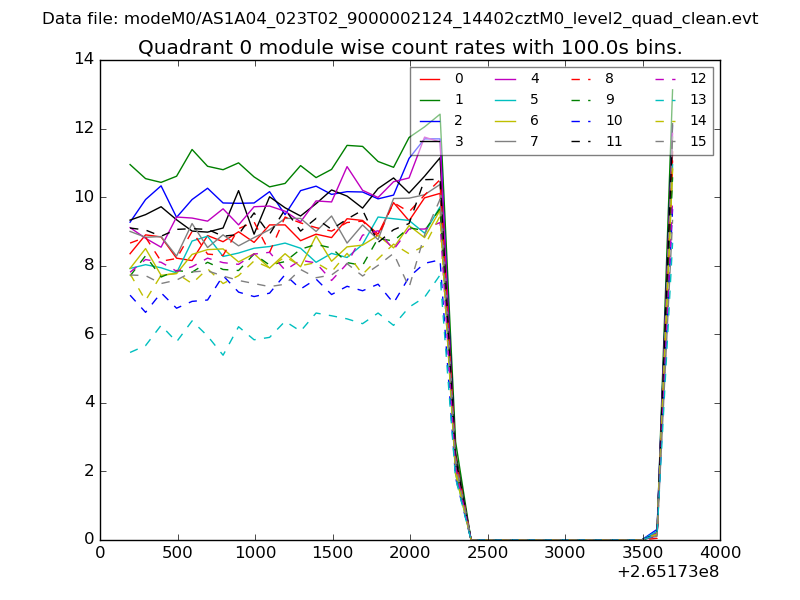 |
 |
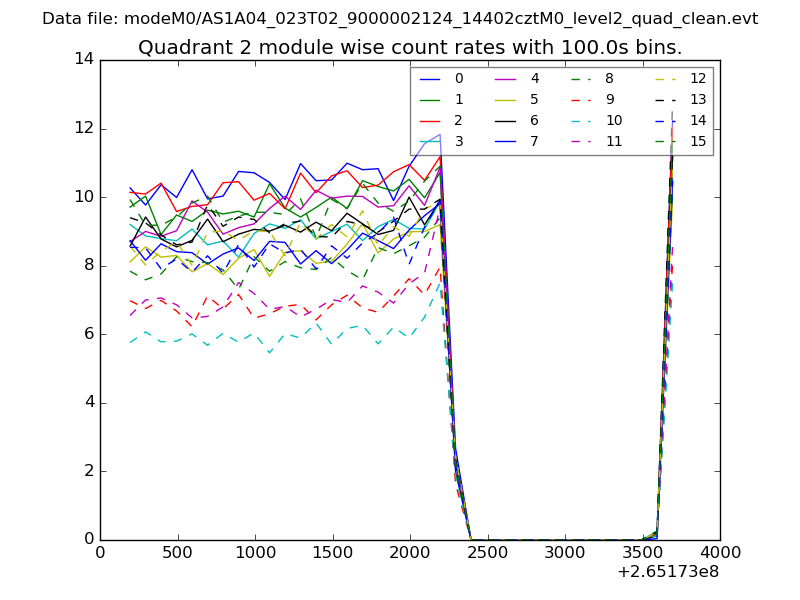
| Module-wise count rates for Quadrant B Data is divided into 100 sec bins |
 |
 |
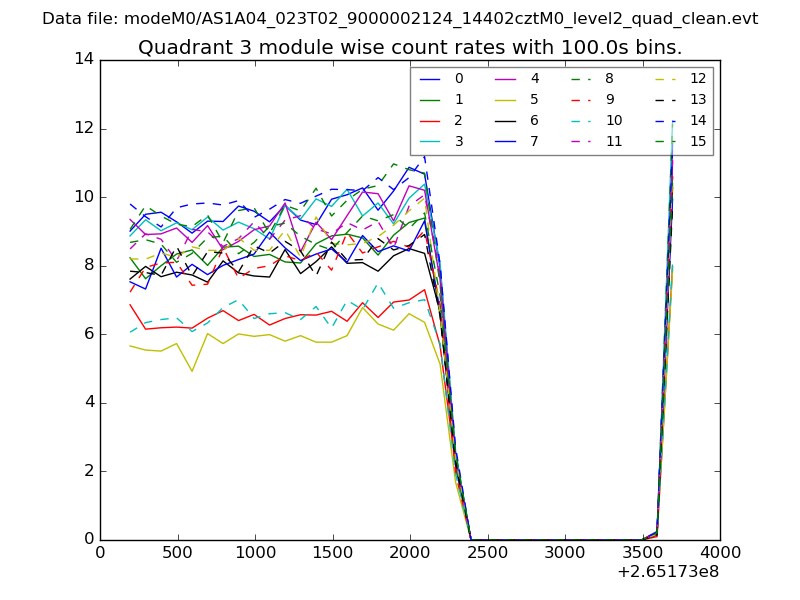
| Module-wise count rates for Quadrant C Data is divided into 100 sec bins |
 |
 |
| Module-wise count rates for Quadrant D Data is divided into 100 sec bins |
 |
 |
| Parameter | Plot |
|---|---|
| CZT HV Monitor | 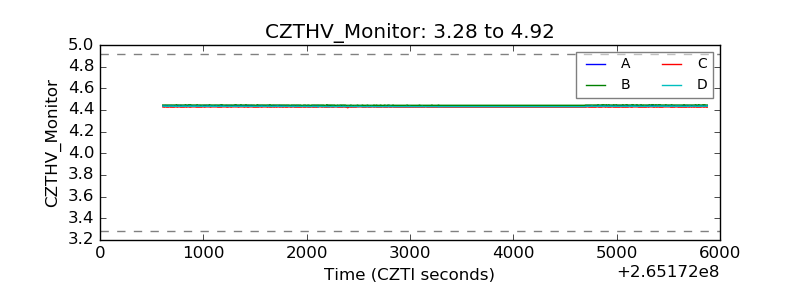 |
| D_VDD | 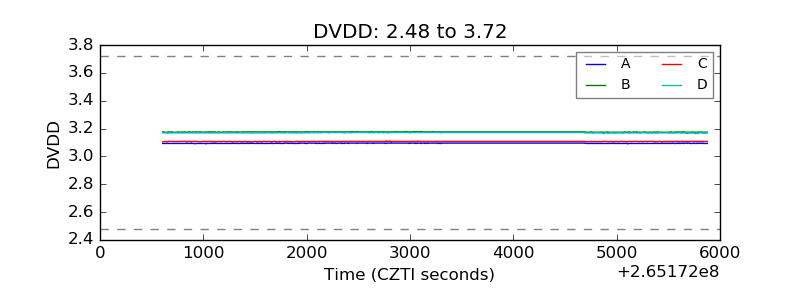 |
| Temperature 1 | 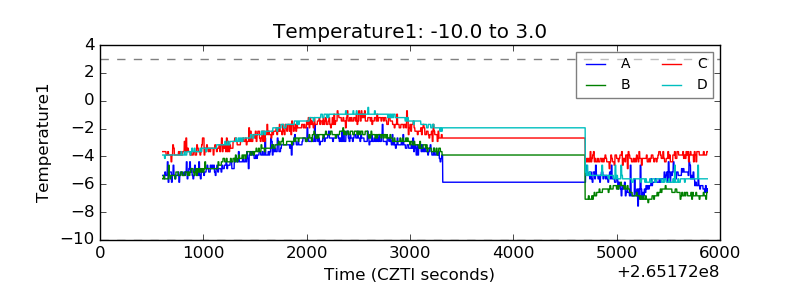 |
| Veto HV Monitor | 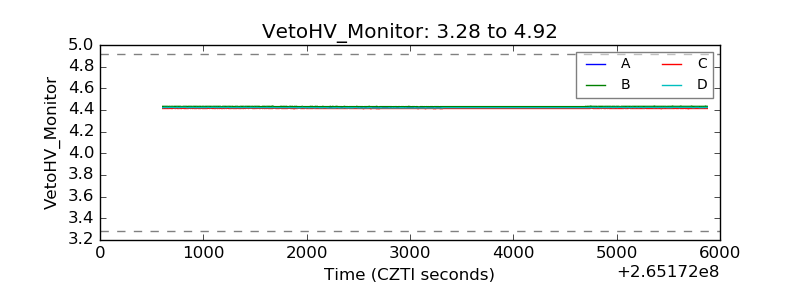 |
| Veto LLD | 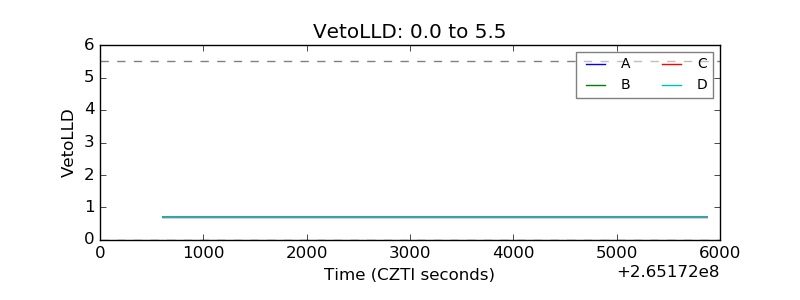 |
| Alpha Counter | 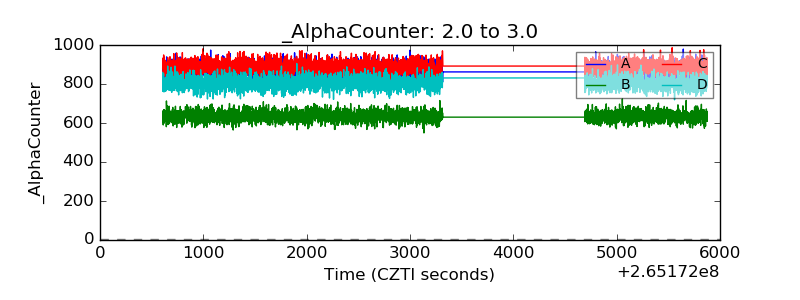 |
| _CPM_Rate | 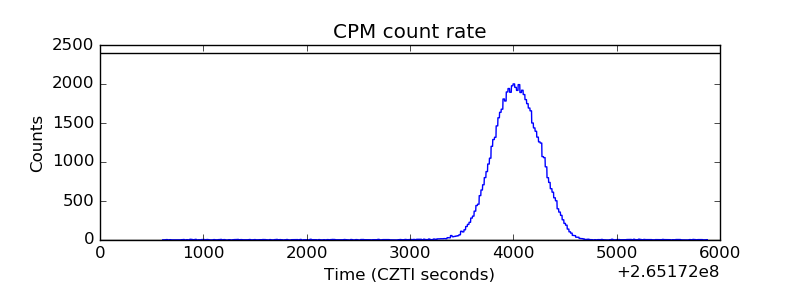 |
| CZT Counter |  |
| +2.5 Volts monitor | 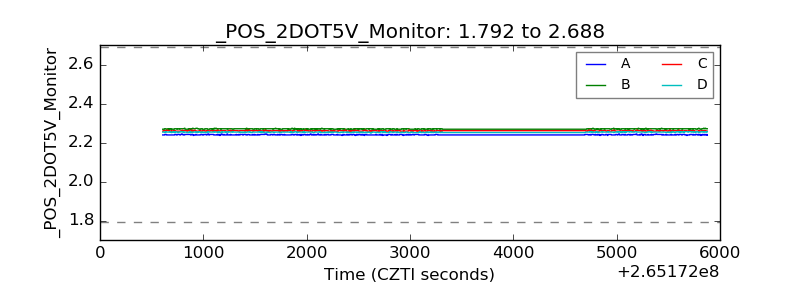 |
| +5 Volts monitor |  |
| _ROLL_ROT | 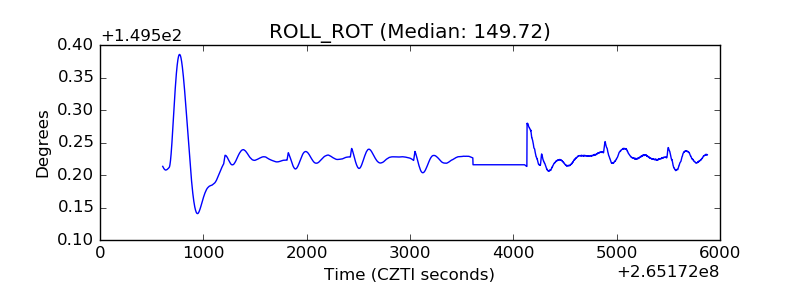 |
| _Roll_DEC |  |
| _Roll_RA | 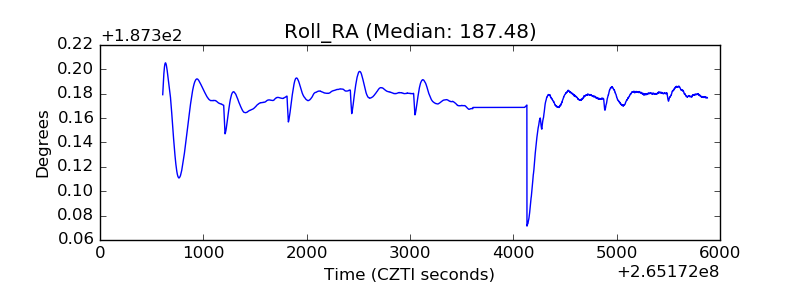 |
| Veto Counter | 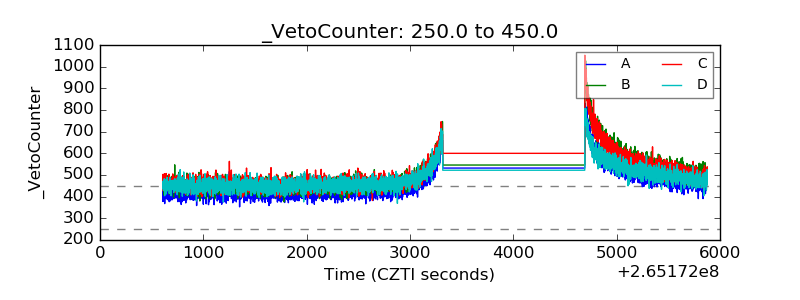 |