| Param | Original file | Final file |
|---|---|---|
| Filename | modeM0/AS1A04_023T02_9000002124_14403cztM0_level2.evt | modeM0/AS1A04_023T02_9000002124_14403cztM0_level2_quad_clean.evt |
| Size (bytes) | 470,698,560 | 61,701,120 |
| Size | 448.9 MB | 58.8 MB |
| Events in quadrant A | 3,269,245 | 362,915 |
| Events in quadrant B | 3,488,948 | 365,519 |
| Events in quadrant C | 3,771,928 | 357,651 |
| Events in quadrant D | 3,302,672 | 347,587 |
| Mode M9 | |||
|---|---|---|---|
| Quadrant | BADHDUFLAG | Total packets | Discarded packets |
| A | 0 | 13 | 0 |
| B | 0 | 13 | 0 |
| C | 0 | 13 | 0 |
| D | 0 | 13 | 0 |
| Mode M0 | |||
|---|---|---|---|
| Quadrant | BADHDUFLAG | Total packets | Discarded packets |
| A | 0 | 13253 | 2 |
| B | 0 | 13965 | 1 |
| C | 0 | 15408 | 1 |
| D | 0 | 13781 | 1 |
| Mode SS | |||
|---|---|---|---|
| Quadrant | BADHDUFLAG | Total packets | Discarded packets |
| A | 0 | 126 | 0 |
| B | 0 | 126 | 0 |
| C | 0 | 126 | 0 |
| D | 0 | 126 | 0 |
| Quadrant | Total seconds | Saturated seconds | Saturation percentage |
|---|---|---|---|
| A | 6224 | 47 | 0.755141% |
| B | 6224 | 105 | 1.687018% |
| C | 6224 | 27 | 0.433805% |
| D | 6224 | 39 | 0.626607% |
Noise dominated data is calculated using 1-second bins in cleaned event files. If a bin has >2000 counts, and if more than 50% of those come from <1% of pixels, then it is considered to be noise-dominated and hence unusable.
| Quadrant | # 1 sec bins | Bins with >0 counts | Bins with >2000 counts | High rate bins dominated by noise | Noise dominated (total time) | Noise dominated (detector-on time) | Marked lightcurve |
|---|---|---|---|---|---|---|---|
| A | 7515 | 6226 | 0 | 0 | 0.00% | 0.00% | 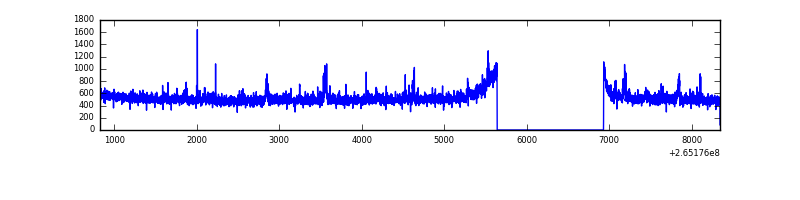 |
| B | 7515 | 6225 | 24 | 24 | 0.32% | 0.39% | 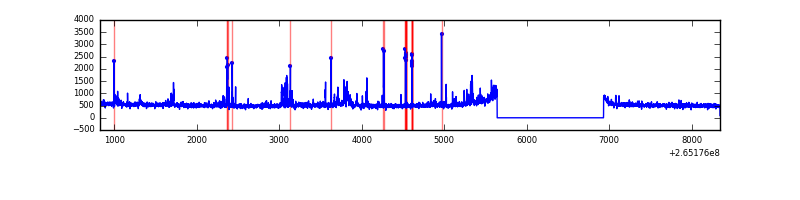 |
| C | 7515 | 6226 | 0 | 0 | 0.00% | 0.00% | 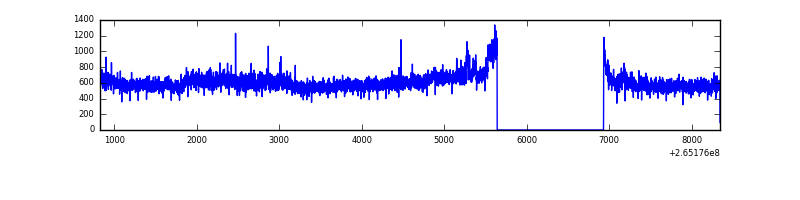 |
| D | 7515 | 6226 | 29 | 29 | 0.39% | 0.47% | 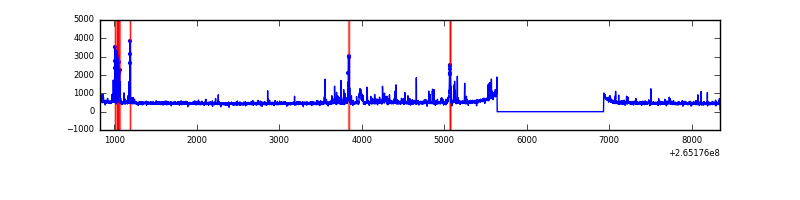 |
Top three noisy pixels from each quadrant. If the there are fewer than three noisy pixels in the level2.evt file, extra rows are filled as -1
| Pixel properties | Quadrant properties | ||||||
|---|---|---|---|---|---|---|---|
| Quadrant | DetID | PixID | Counts | Sigma | Mean | Median | Sigma |
| A | 12 | 189 | 102983 | 621.26 | 812 | 797 | 164.5 |
| A | 8 | 15 | 25803 | 152.03 | 812 | 797 | 164.5 |
| A | 0 | 226 | 7464 | 40.53 | 812 | 797 | 164.5 |
| B | 0 | 189 | 82610 | 531.33 | 811 | 793 | 154.0 |
| B | 8 | 3 | 63271 | 405.74 | 811 | 793 | 154.0 |
| B | 0 | 229 | 60009 | 384.55 | 811 | 793 | 154.0 |
| C | 3 | 233 | 715984 | 3952.36 | 783 | 788 | 181.0 |
| C | 13 | 61 | 5573 | 26.44 | 783 | 788 | 181.0 |
| C | 14 | 234 | 2809 | 11.17 | 783 | 788 | 181.0 |
| D | 2 | 120 | 212434 | 1141.8 | 777 | 759 | 185.4 |
| D | 15 | 0 | 58120 | 309.41 | 777 | 759 | 185.4 |
| D | 10 | 199 | 26195 | 137.21 | 777 | 759 | 185.4 |
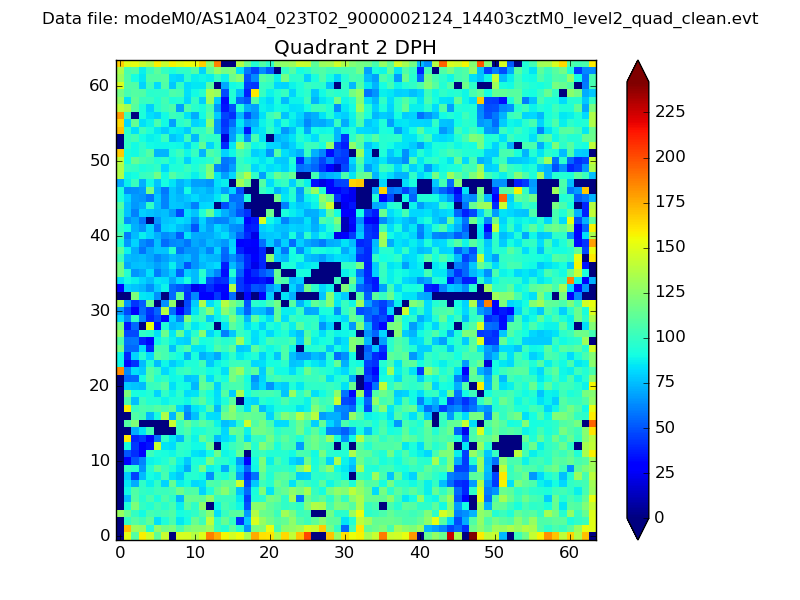
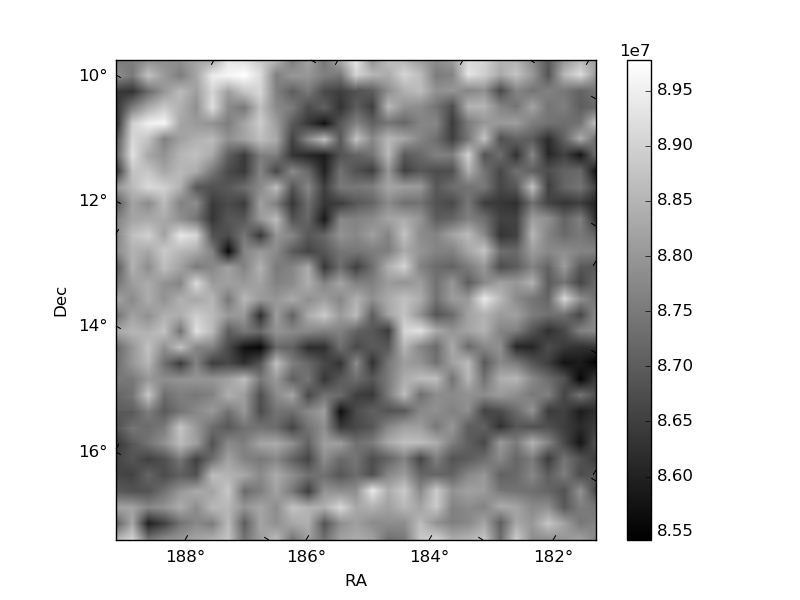
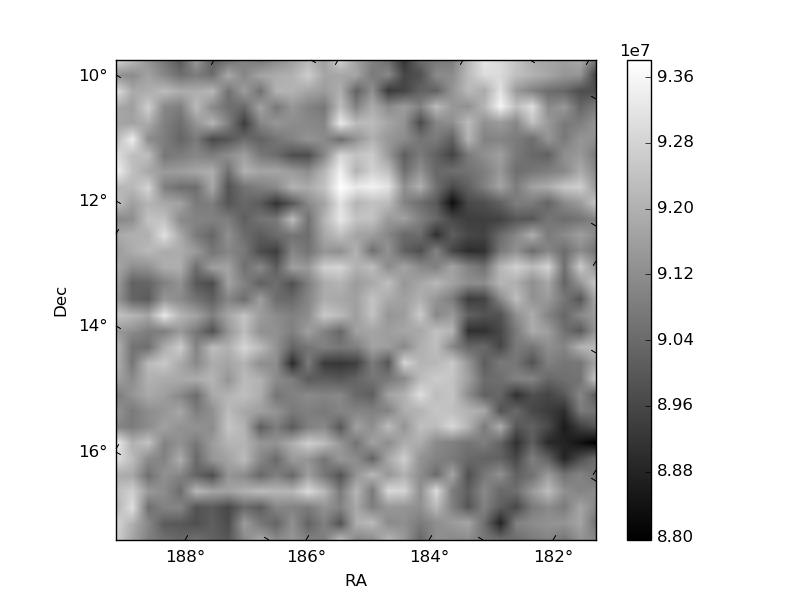
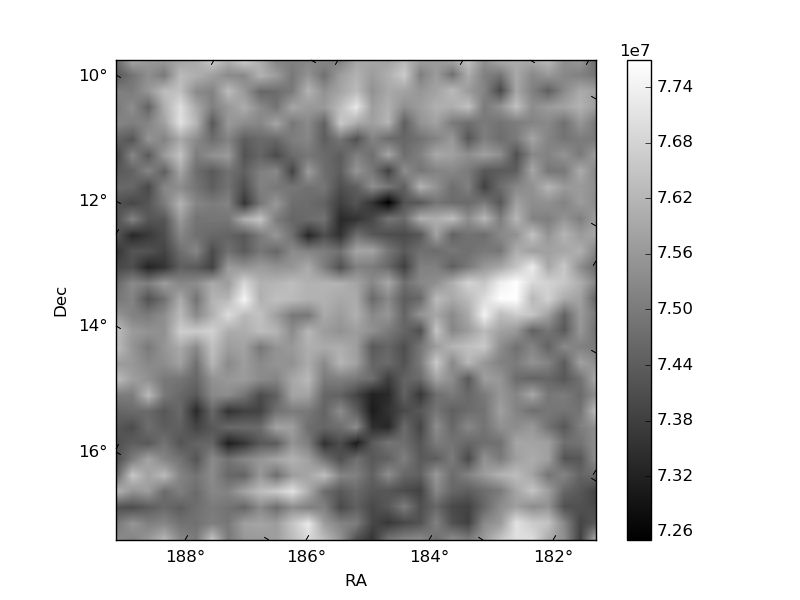
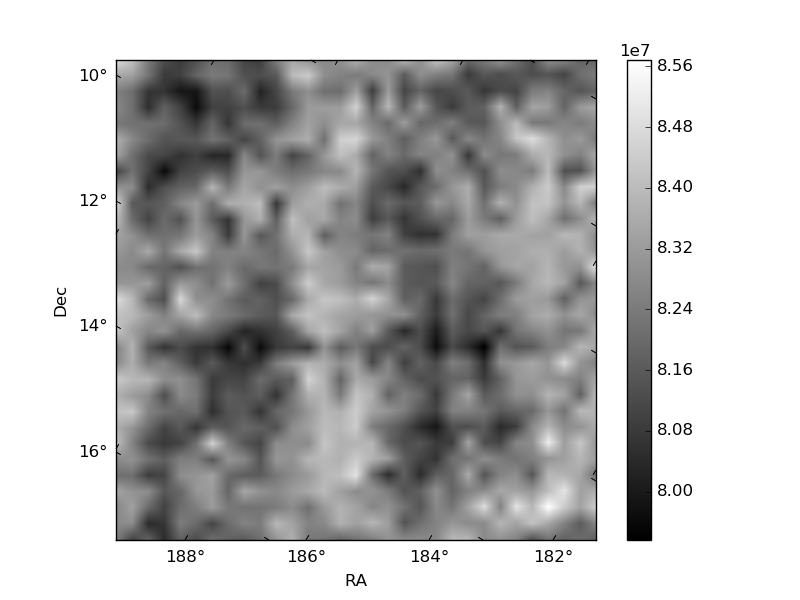
Histogram calculated using DETX and DETY for each event in the final _common_clean file
| Quadrant A |  |
 |
Quadrant B |
|---|---|---|---|
| Quadrant D | 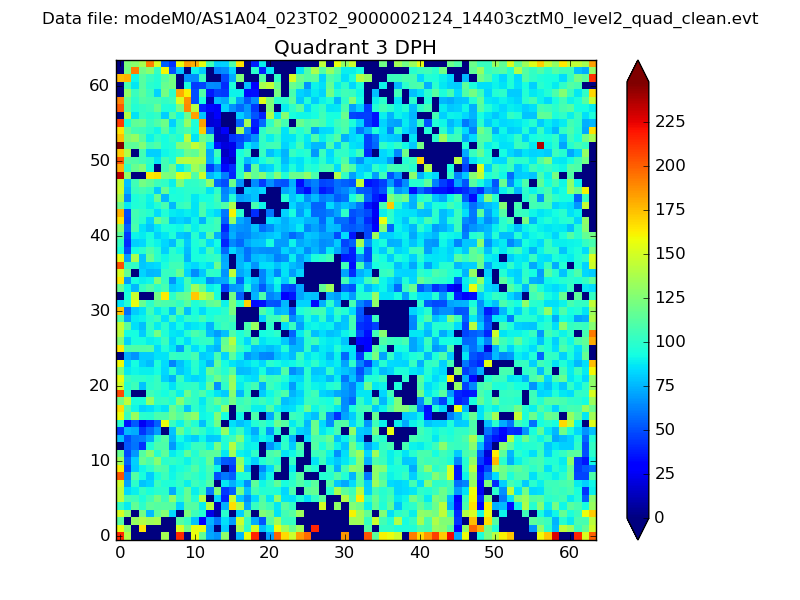 |
 |
Quadrant C |
| Plot type | Count rate plots | Images |
|---|---|---|
| Comparison with Poisson distribution Blue bars denote a histogram of data divided into 1 sec bins. Red curve is a Poisson curve with rate = median count rate of data. |
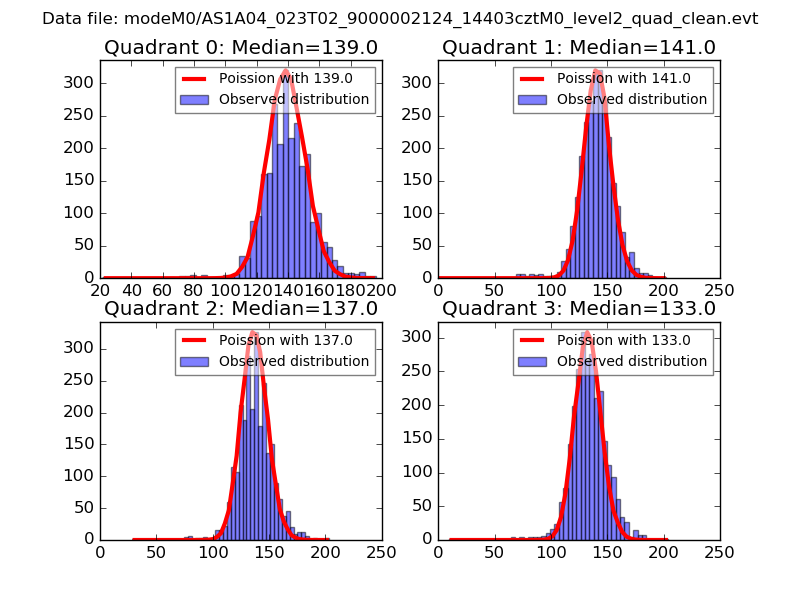 |
 |
| Quadrant-wise count rates Data is divided into 100 sec bins |
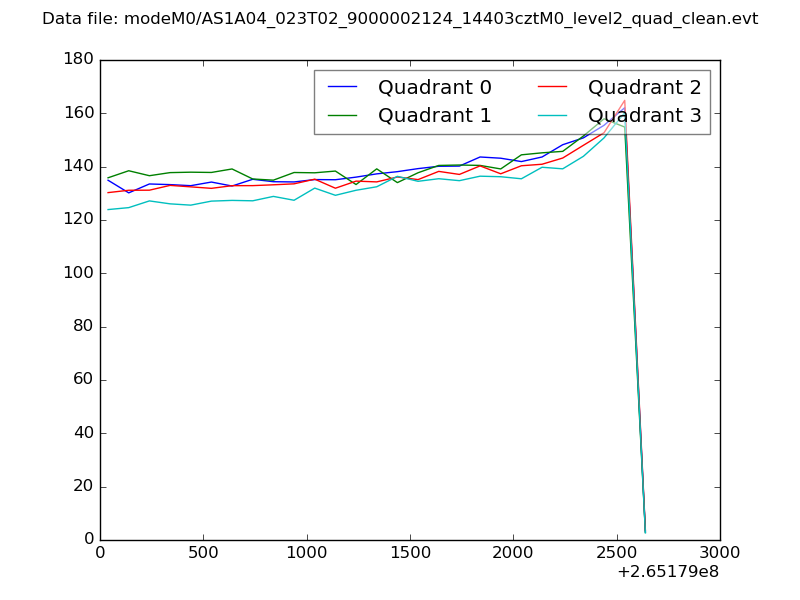 |
|
| Module-wise count rates for Quadrant A Data is divided into 100 sec bins |
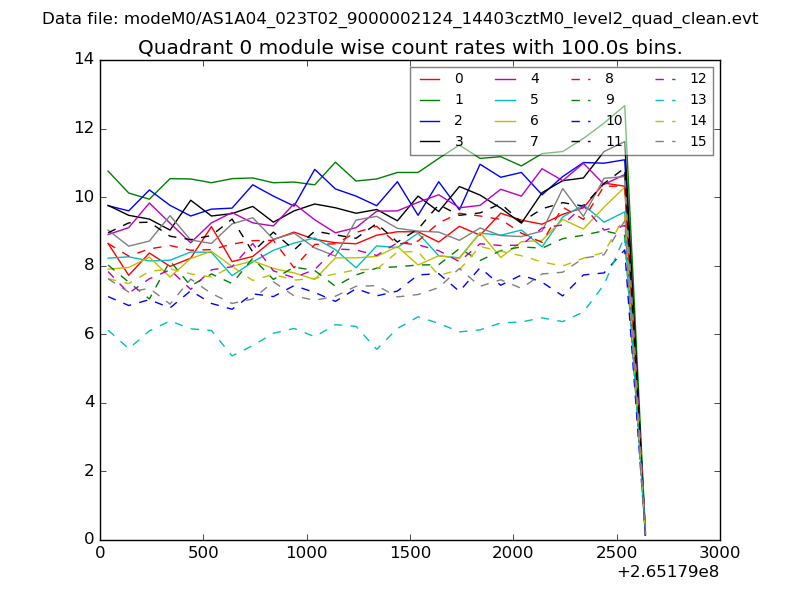 |
 |
| Module-wise count rates for Quadrant B Data is divided into 100 sec bins |
 |
 |
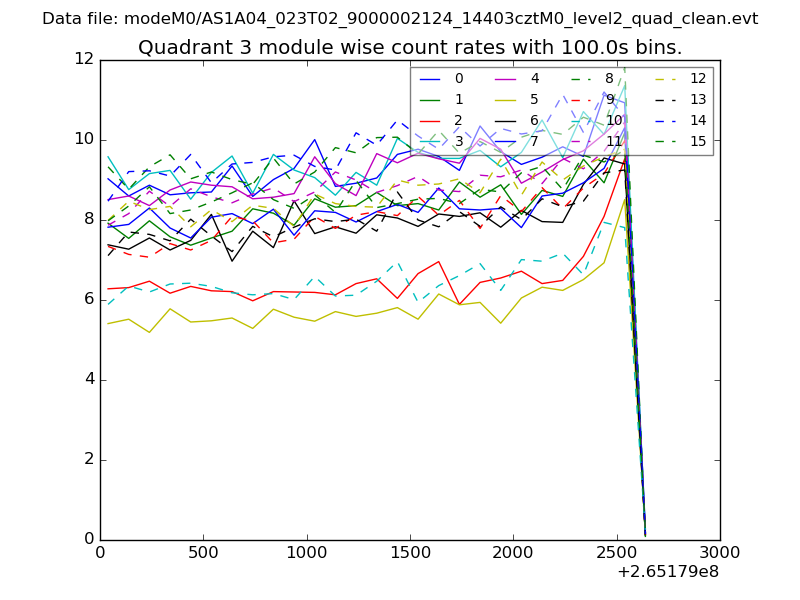
| Module-wise count rates for Quadrant C Data is divided into 100 sec bins |
 |
 |
| Module-wise count rates for Quadrant D Data is divided into 100 sec bins |
 |
 |
| Parameter | Plot |
|---|---|
| CZT HV Monitor | 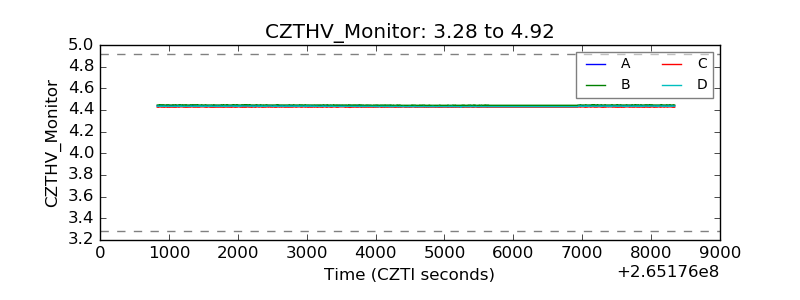 |
| D_VDD | 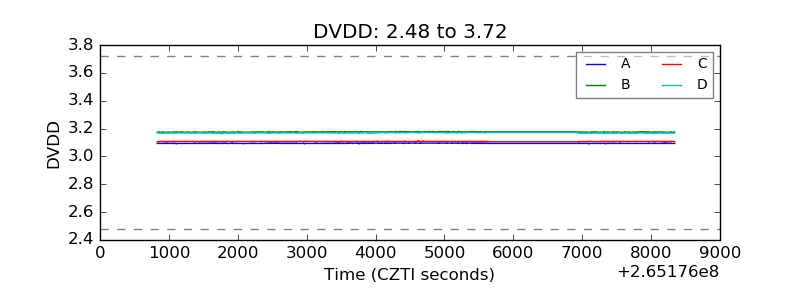 |
| Temperature 1 | 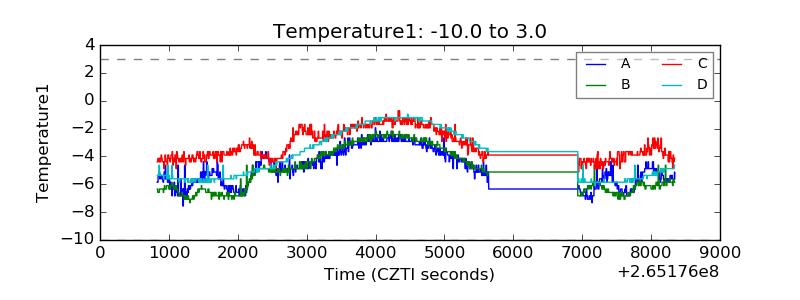 |
| Veto HV Monitor | 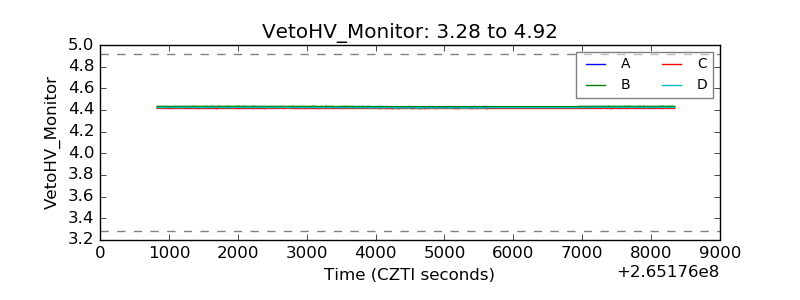 |
| Veto LLD | 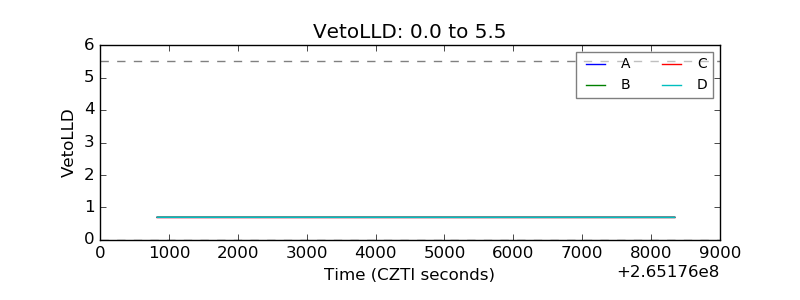 |
| Alpha Counter | 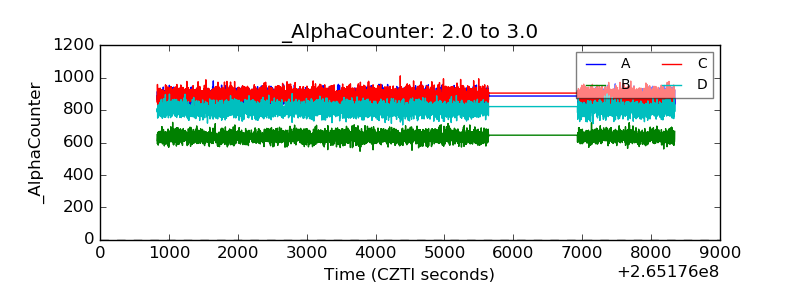 |
| _CPM_Rate | 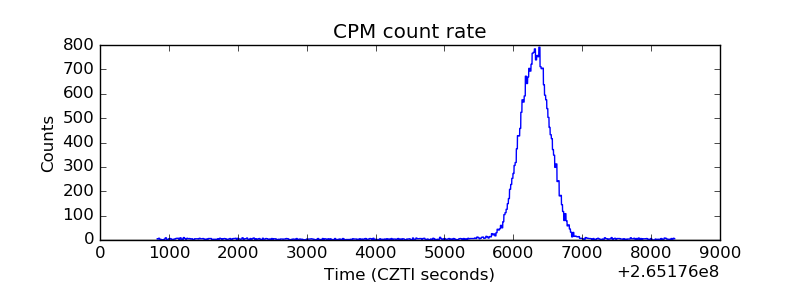 |
| CZT Counter | 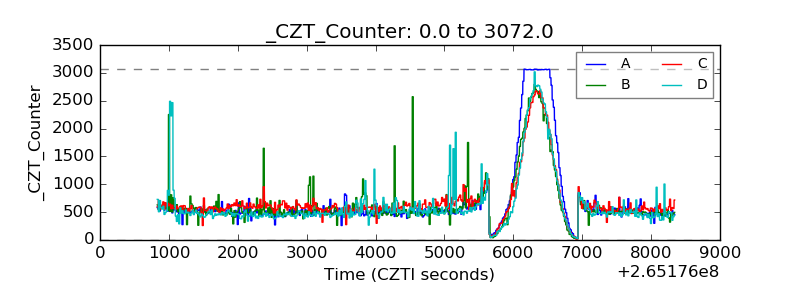 |
| +2.5 Volts monitor |  |
| +5 Volts monitor | 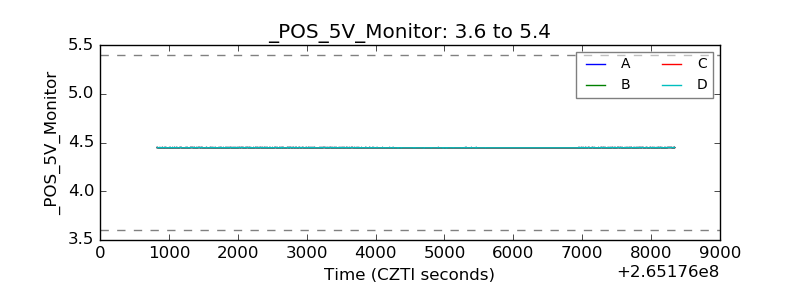 |
| _ROLL_ROT | 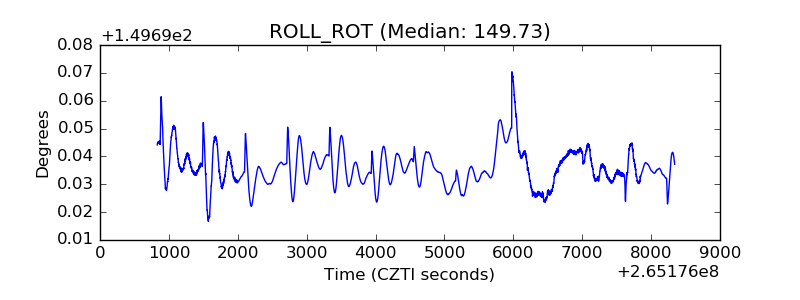 |
| _Roll_DEC | 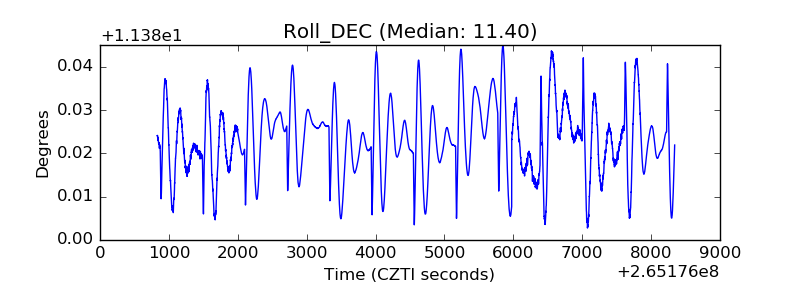 |
| _Roll_RA | 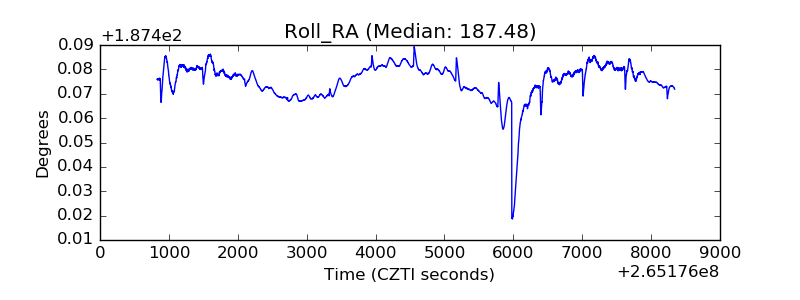 |
| Veto Counter | 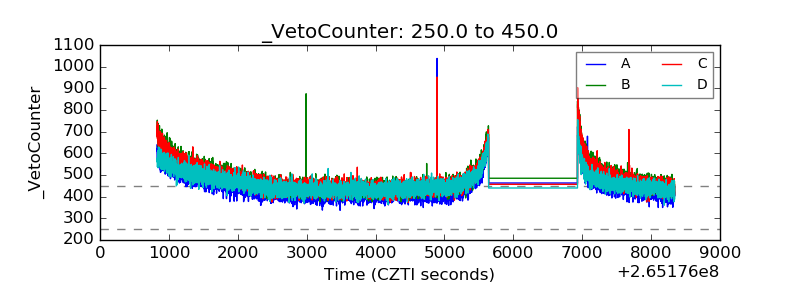 |