| Param | Original file | Final file |
|---|---|---|
| Filename | modeM0/AS1A04_023T02_9000002124_14404cztM0_level2.evt | modeM0/AS1A04_023T02_9000002124_14404cztM0_level2_quad_clean.evt |
| Size (bytes) | 540,912,960 | 74,816,640 |
| Size | 515.9 MB | 71.4 MB |
| Events in quadrant A | 3,551,066 | 453,436 |
| Events in quadrant B | 3,719,631 | 455,689 |
| Events in quadrant C | 4,313,695 | 445,817 |
| Events in quadrant D | 4,328,559 | 428,848 |
| Mode M9 | |||
|---|---|---|---|
| Quadrant | BADHDUFLAG | Total packets | Discarded packets |
| A | 0 | 23 | 0 |
| B | 0 | 23 | 0 |
| C | 0 | 23 | 0 |
| D | 0 | 23 | 0 |
| Mode M0 | |||
|---|---|---|---|
| Quadrant | BADHDUFLAG | Total packets | Discarded packets |
| A | 0 | 14666 | 3 |
| B | 0 | 15183 | 2 |
| C | 0 | 17376 | 2 |
| D | 0 | 17456 | 2 |
| Mode SS | |||
|---|---|---|---|
| Quadrant | BADHDUFLAG | Total packets | Discarded packets |
| A | 0 | 142 | 0 |
| B | 0 | 142 | 0 |
| C | 0 | 142 | 0 |
| D | 0 | 142 | 0 |
| Quadrant | Total seconds | Saturated seconds | Saturation percentage |
|---|---|---|---|
| A | 6913 | 122 | 1.764791% |
| B | 6913 | 168 | 2.430204% |
| C | 6913 | 83 | 1.200636% |
| D | 6913 | 135 | 1.952842% |
Noise dominated data is calculated using 1-second bins in cleaned event files. If a bin has >2000 counts, and if more than 50% of those come from <1% of pixels, then it is considered to be noise-dominated and hence unusable.
| Quadrant | # 1 sec bins | Bins with >0 counts | Bins with >2000 counts | High rate bins dominated by noise | Noise dominated (total time) | Noise dominated (detector-on time) | Marked lightcurve |
|---|---|---|---|---|---|---|---|
| A | 9154 | 6915 | 1 | 1 | 0.01% | 0.01% |  |
| B | 9154 | 6914 | 3 | 3 | 0.03% | 0.04% |  |
| C | 9154 | 6916 | 0 | 0 | 0.00% | 0.00% |  |
| D | 9154 | 6916 | 92 | 92 | 1.01% | 1.33% |  |
Top three noisy pixels from each quadrant. If the there are fewer than three noisy pixels in the level2.evt file, extra rows are filled as -1
| Pixel properties | Quadrant properties | ||||||
|---|---|---|---|---|---|---|---|
| Quadrant | DetID | PixID | Counts | Sigma | Mean | Median | Sigma |
| A | 12 | 189 | 53251 | 291.34 | 886 | 868 | 179.8 |
| A | 4 | 2 | 31203 | 168.72 | 886 | 868 | 179.8 |
| A | 9 | 143 | 30013 | 162.1 | 886 | 868 | 179.8 |
| B | 0 | 189 | 176084 | 1027.5 | 883 | 862 | 170.5 |
| B | 0 | 229 | 31784 | 181.33 | 883 | 862 | 170.5 |
| B | 4 | 142 | 24147 | 136.54 | 883 | 862 | 170.5 |
| C | 3 | 233 | 970522 | 4887.7 | 856 | 861 | 198.4 |
| C | 13 | 61 | 6012 | 25.96 | 856 | 861 | 198.4 |
| C | 3 | 234 | 3369 | 12.64 | 856 | 861 | 198.4 |
| D | 13 | 122 | 849728 | 4163.32 | 850 | 830 | 203.9 |
| D | 2 | 120 | 94947 | 461.59 | 850 | 830 | 203.9 |
| D | 10 | 199 | 38535 | 184.92 | 850 | 830 | 203.9 |
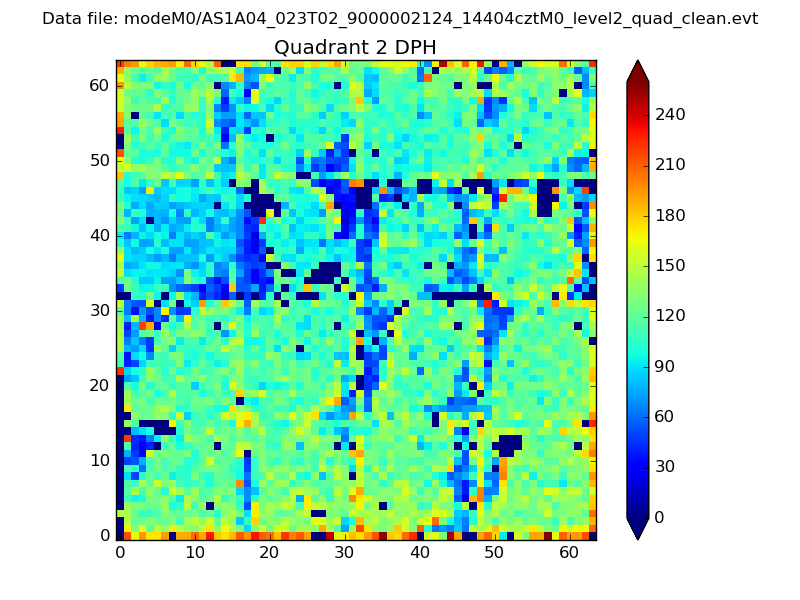
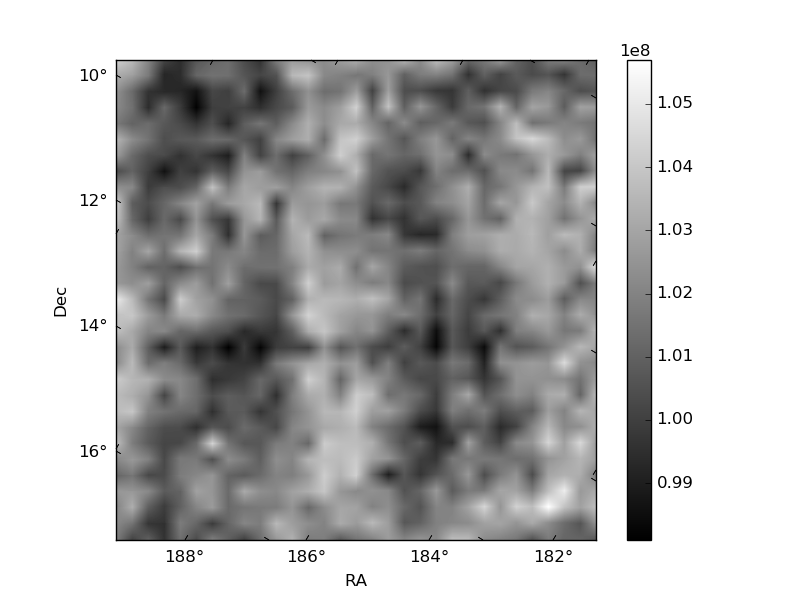
Histogram calculated using DETX and DETY for each event in the final _common_clean file
| Quadrant A | 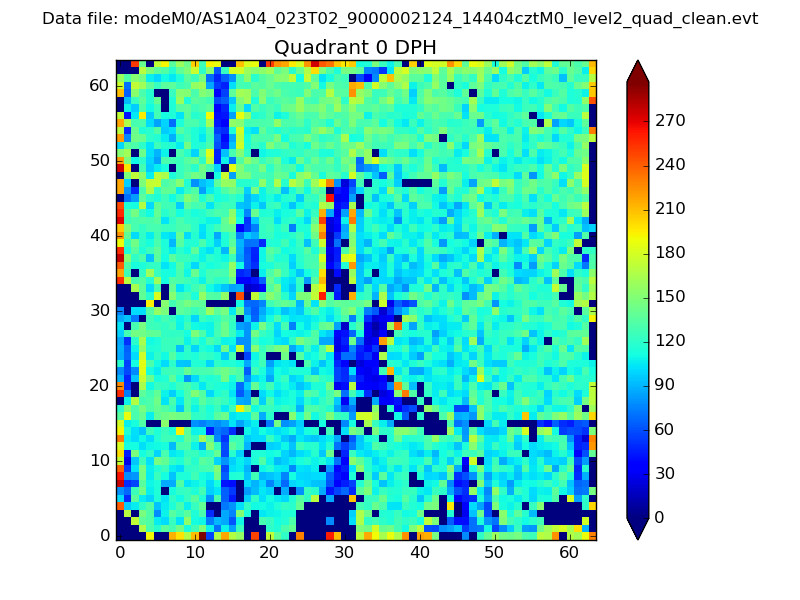 |
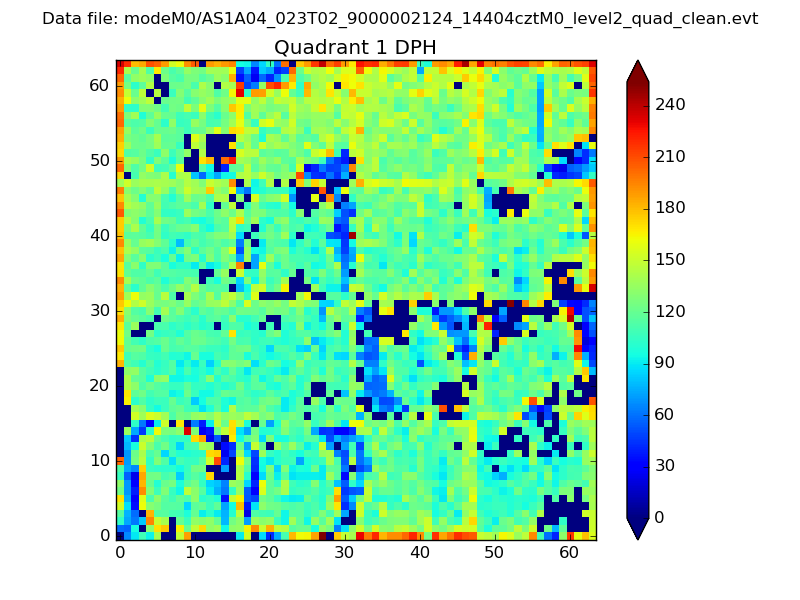 |
Quadrant B |
|---|---|---|---|
| Quadrant D | 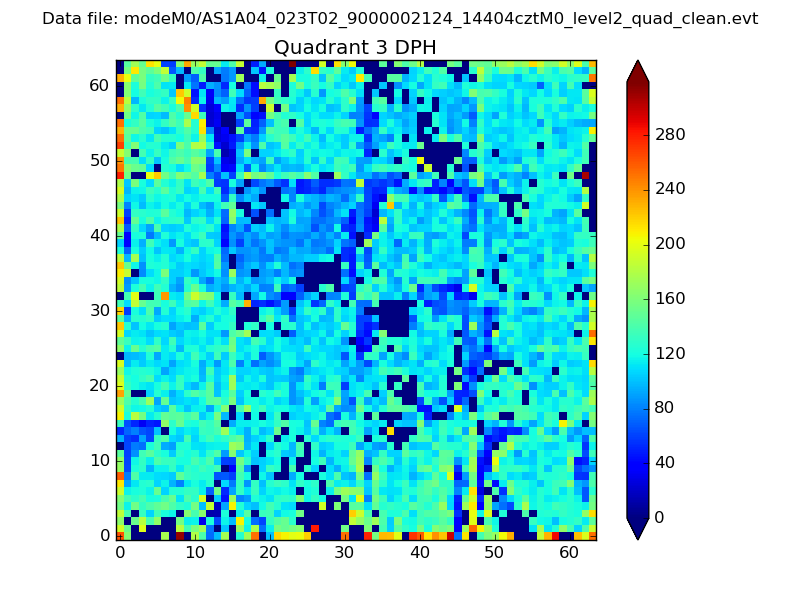 |
 |
Quadrant C |
| Plot type | Count rate plots | Images |
|---|---|---|
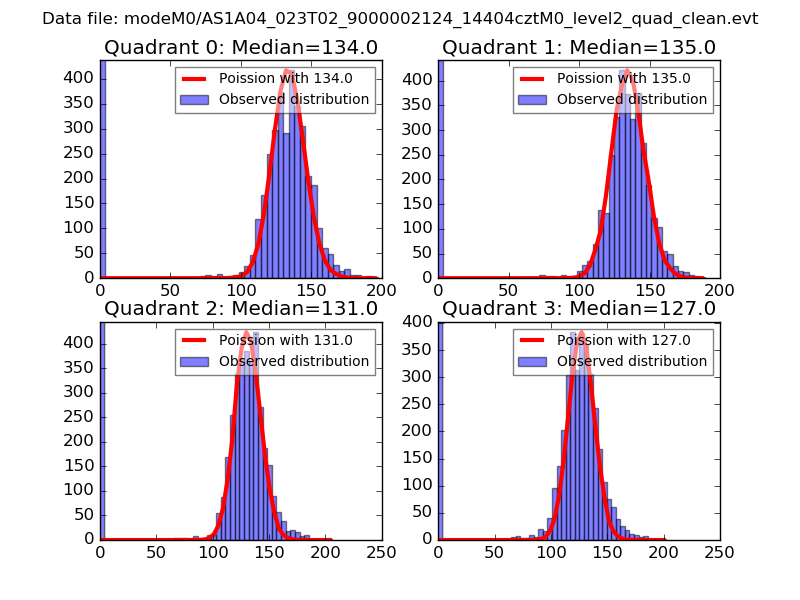
| Comparison with Poisson distribution Blue bars denote a histogram of data divided into 1 sec bins. Red curve is a Poisson curve with rate = median count rate of data. |
 |
 |
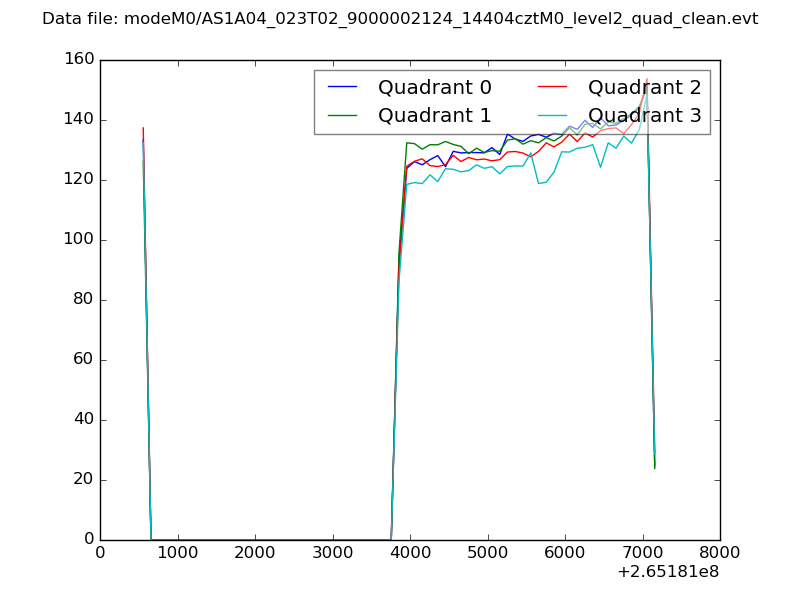
| Quadrant-wise count rates Data is divided into 100 sec bins |
 |
|
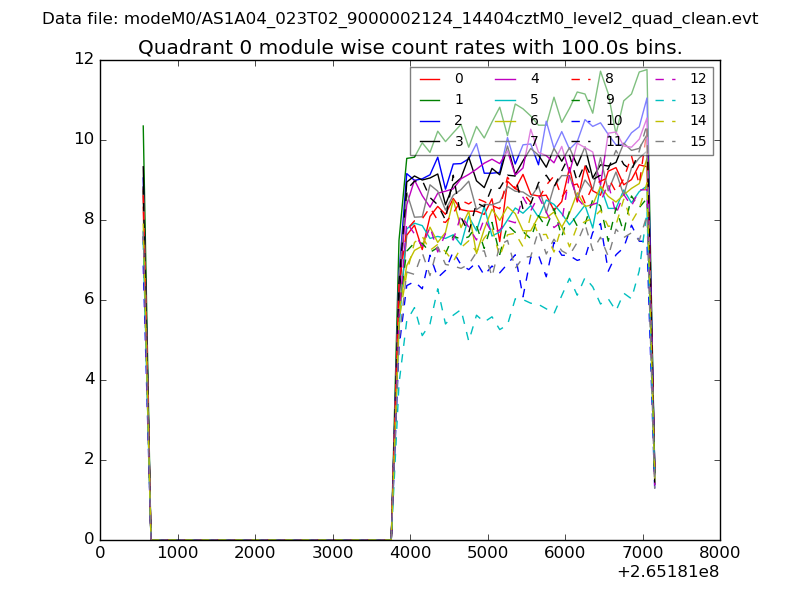
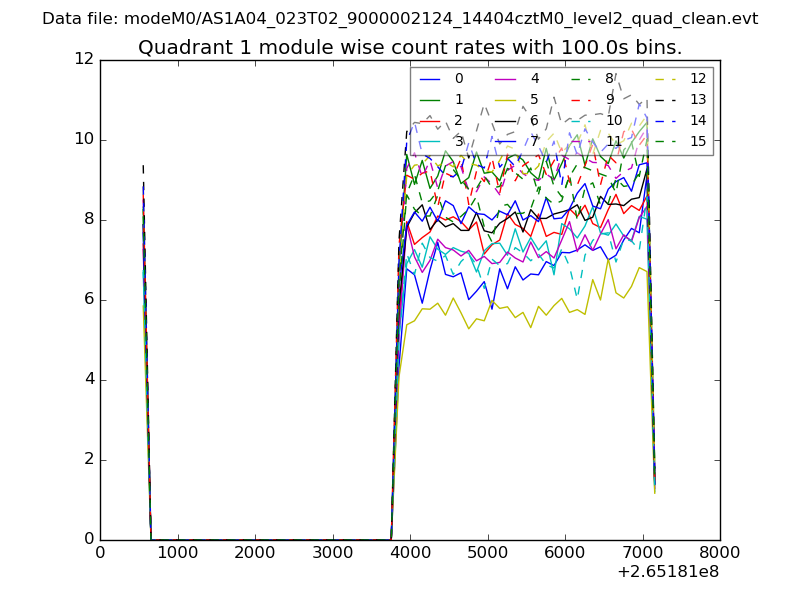
| Module-wise count rates for Quadrant A Data is divided into 100 sec bins |
 |
 |
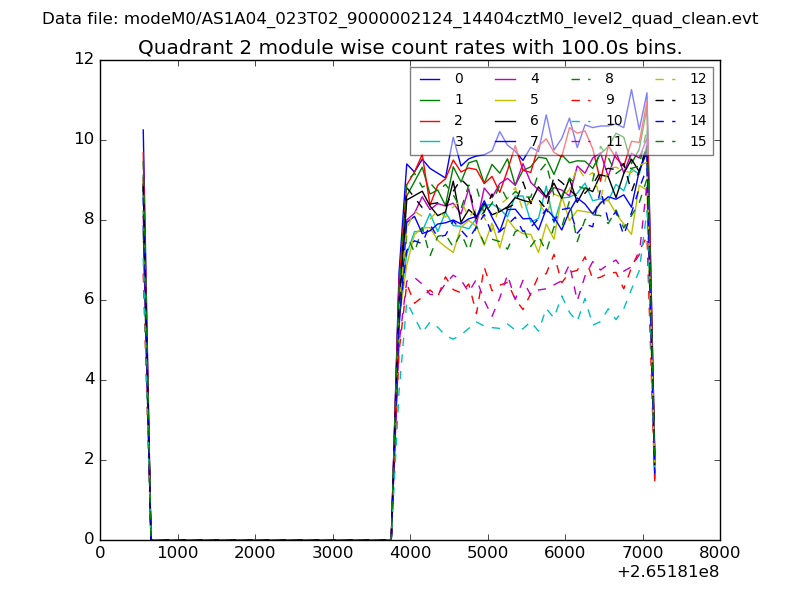
| Module-wise count rates for Quadrant B Data is divided into 100 sec bins |
 |
 |
| Module-wise count rates for Quadrant C Data is divided into 100 sec bins |
 |
 |
| Module-wise count rates for Quadrant D Data is divided into 100 sec bins |
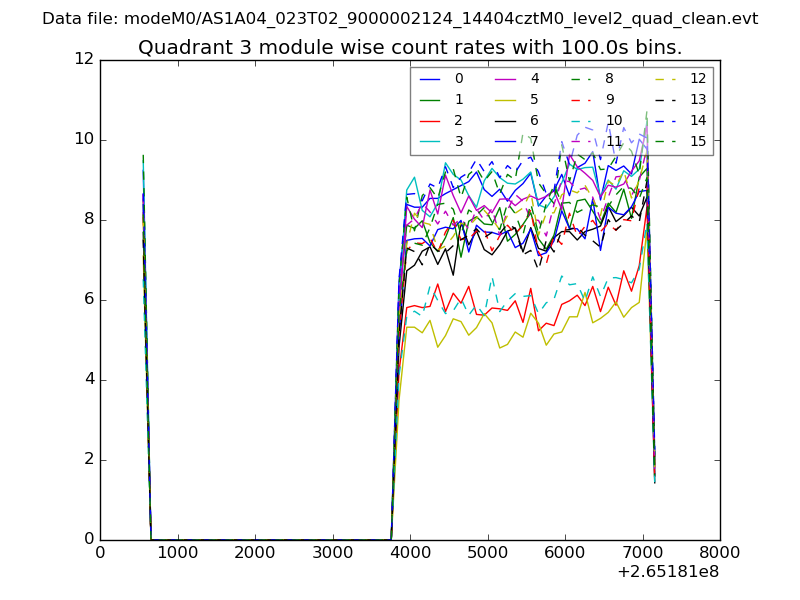 |
 |
| Parameter | Plot |
|---|---|
| CZT HV Monitor | 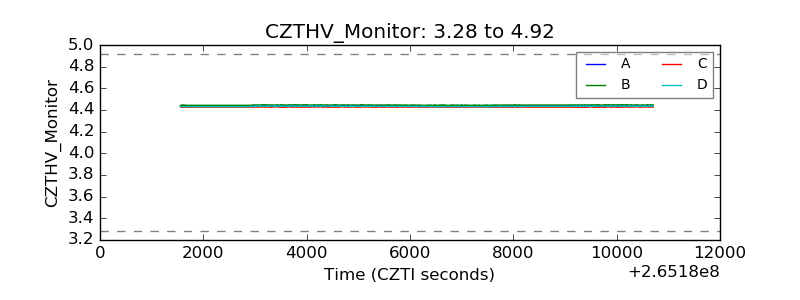 |
| D_VDD | 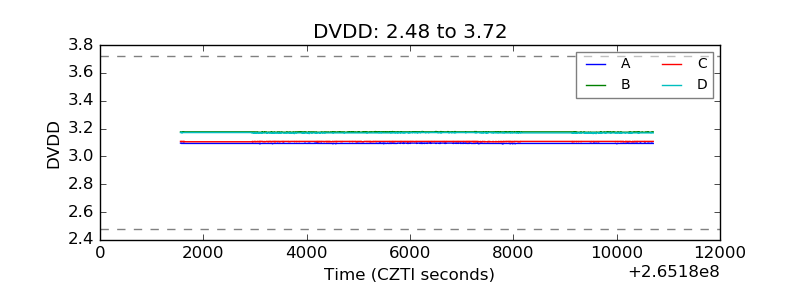 |
| Temperature 1 | 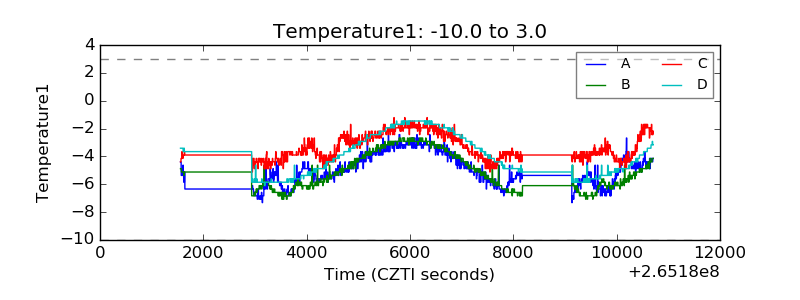 |
| Veto HV Monitor | 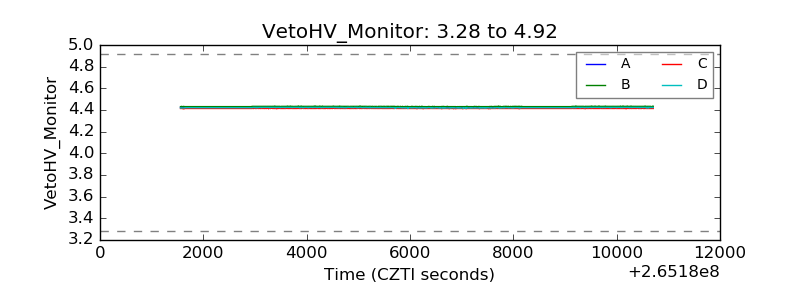 |
| Veto LLD | 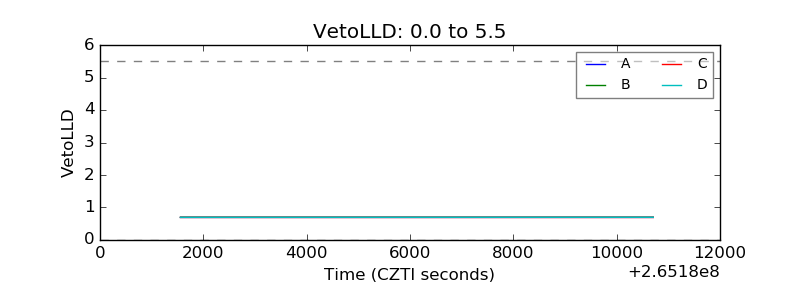 |
| Alpha Counter | 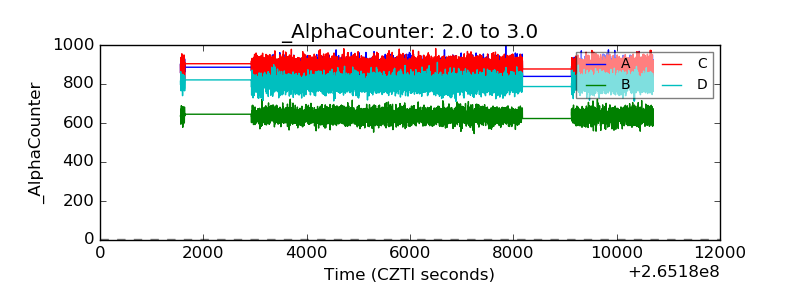 |
| _CPM_Rate | 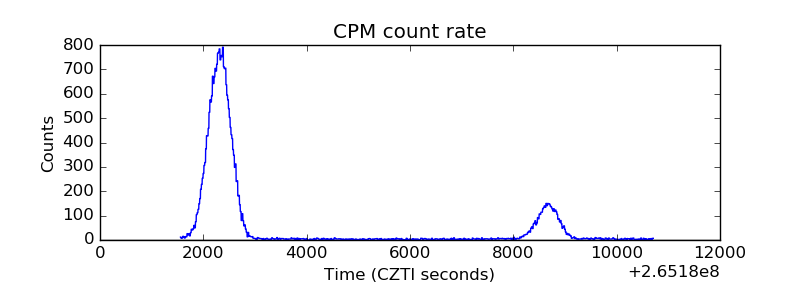 |
| CZT Counter | 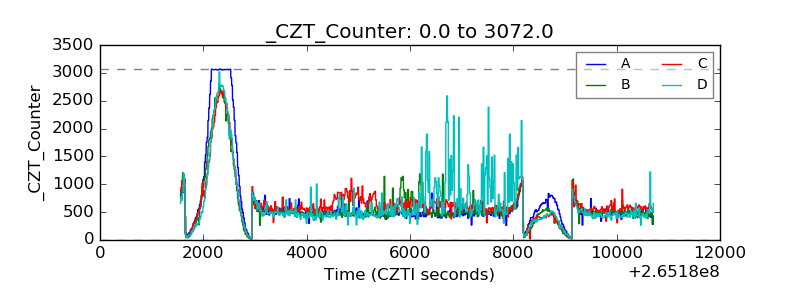 |
| +2.5 Volts monitor |  |
| +5 Volts monitor |  |
| _ROLL_ROT | 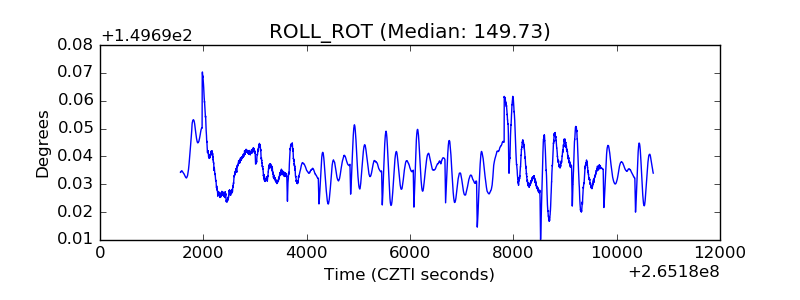 |
| _Roll_DEC |  |
| _Roll_RA | 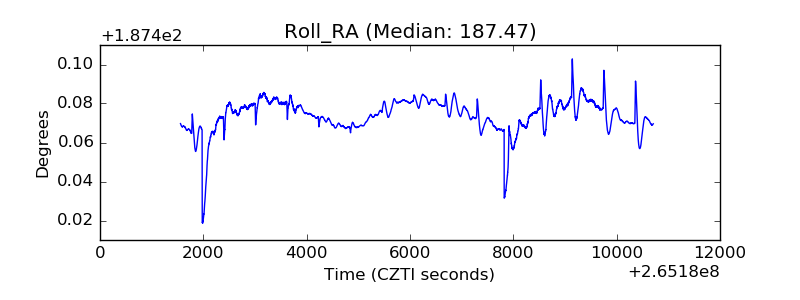 |
| Veto Counter | 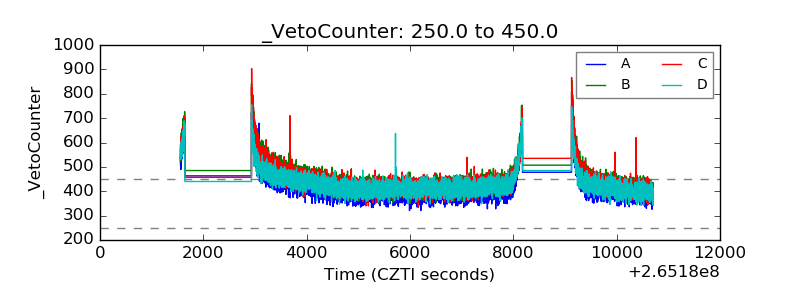 |