| Param | Original file | Final file |
|---|---|---|
| Filename | modeM0/AS1A04_023T02_9000002124_14406cztM0_level2.evt | modeM0/AS1A04_023T02_9000002124_14406cztM0_level2_quad_clean.evt |
| Size (bytes) | 613,537,920 | 89,815,680 |
| Size | 585.1 MB | 85.7 MB |
| Events in quadrant A | 4,097,412 | 548,349 |
| Events in quadrant B | 4,462,104 | 544,784 |
| Events in quadrant C | 4,966,484 | 538,235 |
| Events in quadrant D | 4,505,104 | 524,958 |
| Mode M9 | |||
|---|---|---|---|
| Quadrant | BADHDUFLAG | Total packets | Discarded packets |
| A | 0 | 5 | 0 |
| B | 0 | 5 | 0 |
| C | 0 | 5 | 0 |
| D | 0 | 5 | 0 |
| Mode M0 | |||
|---|---|---|---|
| Quadrant | BADHDUFLAG | Total packets | Discarded packets |
| A | 0 | 17343 | 2 |
| B | 0 | 18361 | 1 |
| C | 0 | 20042 | 1 |
| D | 0 | 18754 | 1 |
| Mode SS | |||
|---|---|---|---|
| Quadrant | BADHDUFLAG | Total packets | Discarded packets |
| A | 0 | 162 | 0 |
| B | 0 | 162 | 0 |
| C | 0 | 162 | 0 |
| D | 0 | 162 | 0 |
| Quadrant | Total seconds | Saturated seconds | Saturation percentage |
|---|---|---|---|
| A | 8114 | 447 | 5.508997% |
| B | 8114 | 586 | 7.222085% |
| C | 8114 | 344 | 4.239586% |
| D | 8114 | 444 | 5.472024% |
Noise dominated data is calculated using 1-second bins in cleaned event files. If a bin has >2000 counts, and if more than 50% of those come from <1% of pixels, then it is considered to be noise-dominated and hence unusable.
| Quadrant | # 1 sec bins | Bins with >0 counts | Bins with >2000 counts | High rate bins dominated by noise | Noise dominated (total time) | Noise dominated (detector-on time) | Marked lightcurve |
|---|---|---|---|---|---|---|---|
| A | 8555 | 8115 | 4 | 4 | 0.05% | 0.05% | 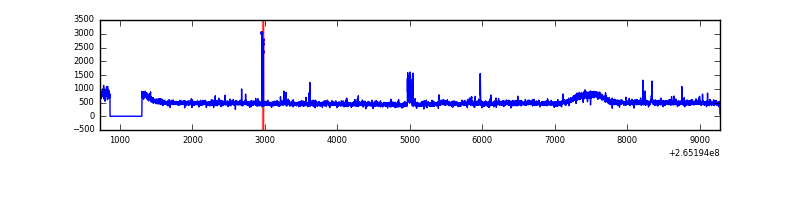 |
| B | 8555 | 8115 | 93 | 93 | 1.09% | 1.15% | 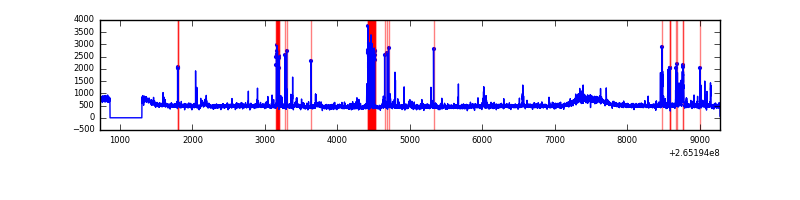 |
| C | 8555 | 8115 | 5 | 5 | 0.06% | 0.06% | 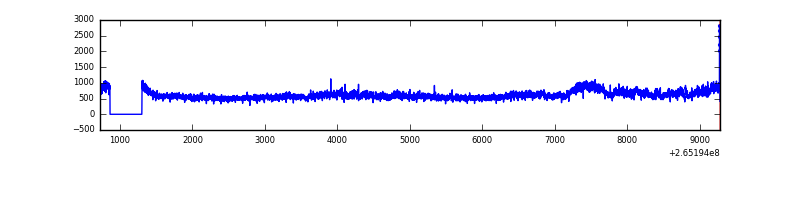 |
| D | 8555 | 8115 | 51 | 51 | 0.60% | 0.63% | 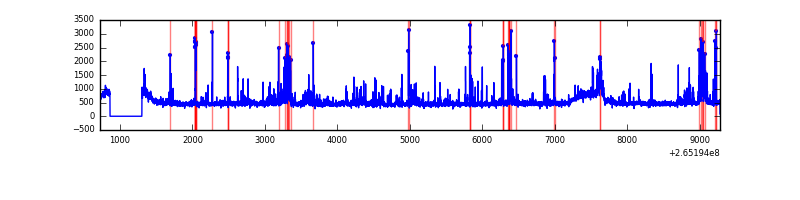 |
Top three noisy pixels from each quadrant. If the there are fewer than three noisy pixels in the level2.evt file, extra rows are filled as -1
| Pixel properties | Quadrant properties | ||||||
|---|---|---|---|---|---|---|---|
| Quadrant | DetID | PixID | Counts | Sigma | Mean | Median | Sigma |
| A | 12 | 189 | 107626 | 506.42 | 1021 | 993 | 210.6 |
| A | 4 | 2 | 34005 | 156.78 | 1021 | 993 | 210.6 |
| A | 8 | 15 | 27866 | 127.62 | 1021 | 993 | 210.6 |
| B | 8 | 3 | 196206 | 994.23 | 1008 | 979 | 196.4 |
| B | 0 | 229 | 119515 | 603.67 | 1008 | 979 | 196.4 |
| B | 4 | 173 | 65313 | 327.63 | 1008 | 979 | 196.4 |
| C | 3 | 233 | 1080965 | 4645.31 | 994 | 994 | 232.5 |
| C | 0 | 207 | 11539 | 45.36 | 994 | 994 | 232.5 |
| C | 13 | 61 | 7147 | 26.47 | 994 | 994 | 232.5 |
| D | 2 | 120 | 266862 | 1108.42 | 994 | 966 | 239.9 |
| D | 10 | 199 | 200012 | 829.75 | 994 | 966 | 239.9 |
| D | 5 | 51 | 58938 | 241.66 | 994 | 966 | 239.9 |
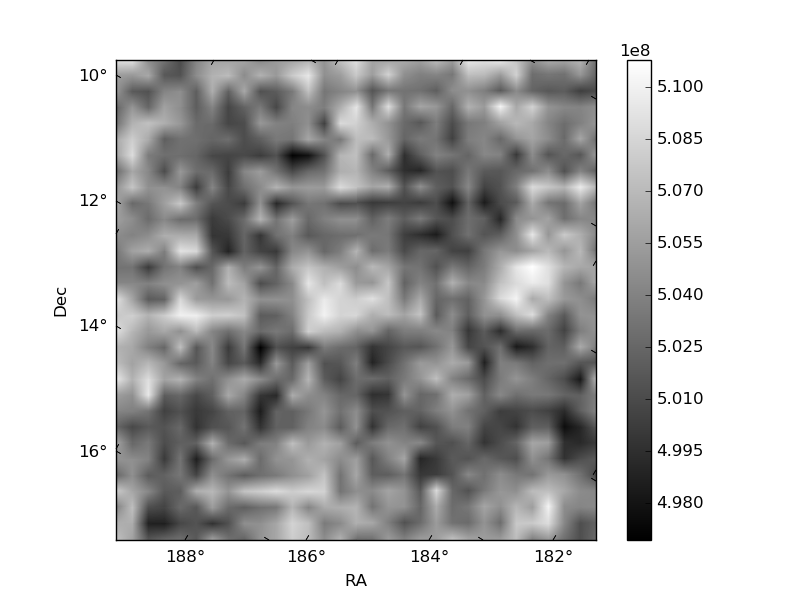
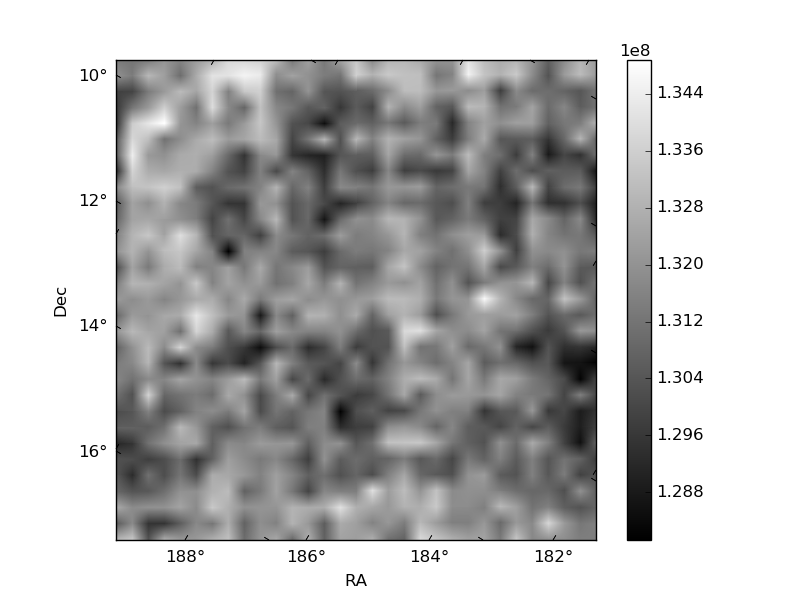
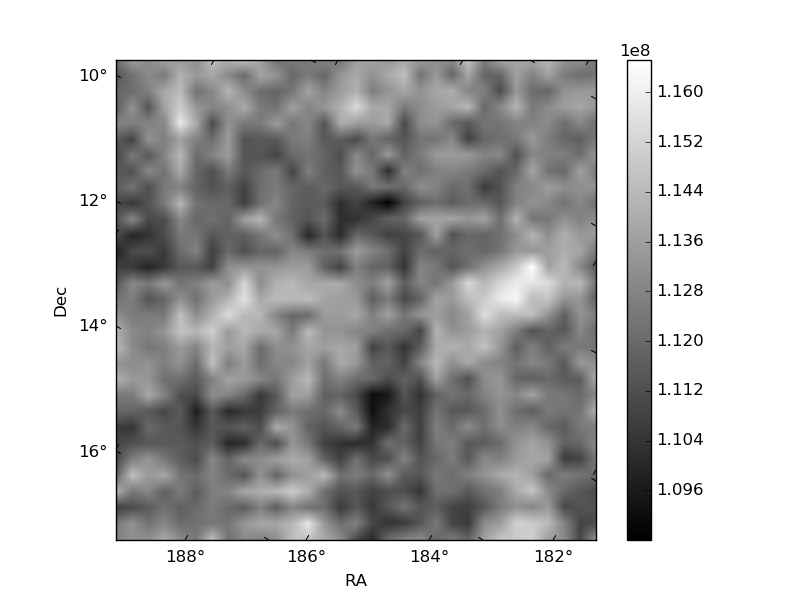
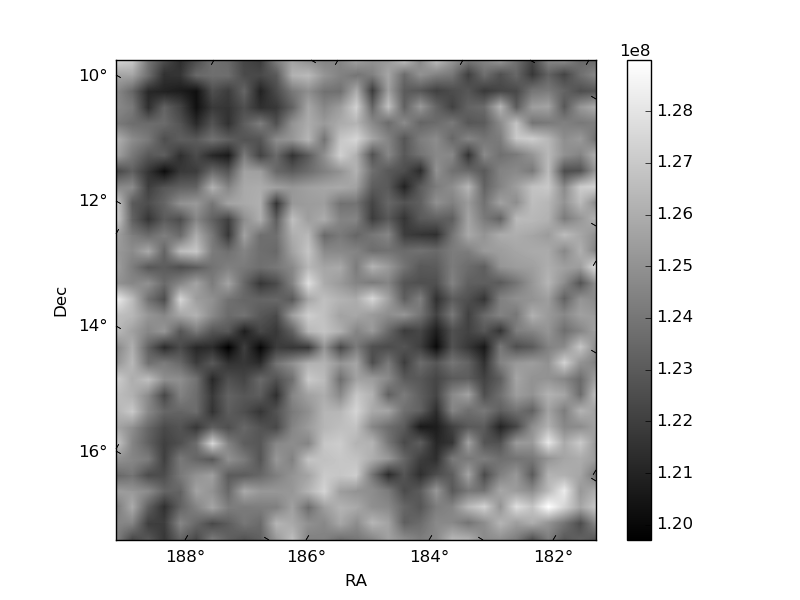
Histogram calculated using DETX and DETY for each event in the final _common_clean file
| Quadrant A | 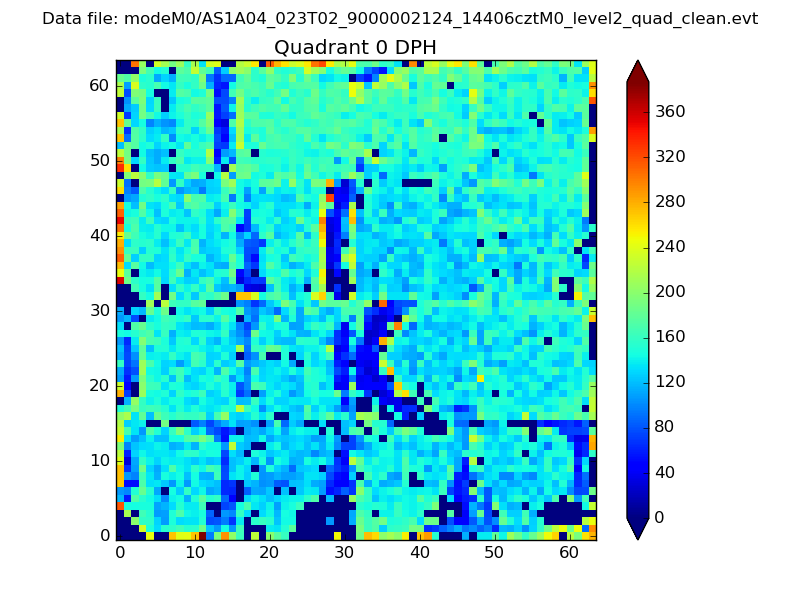 |
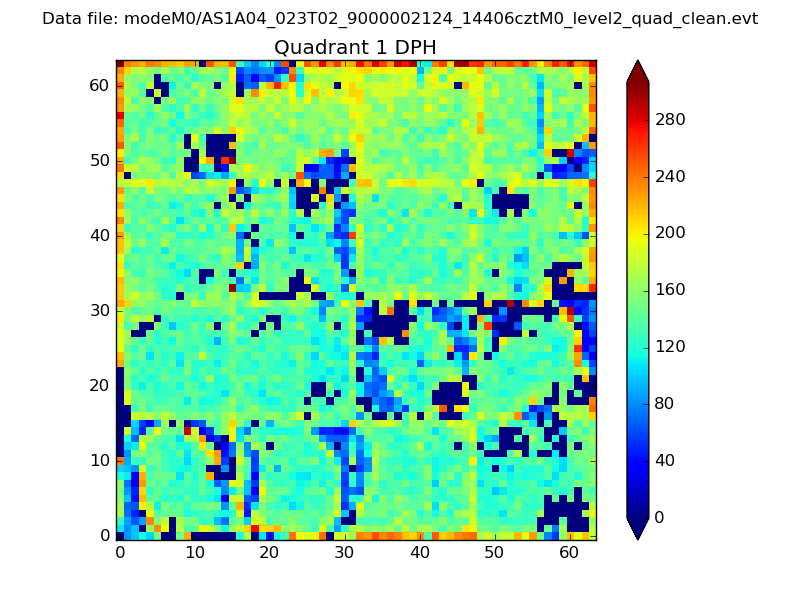 |
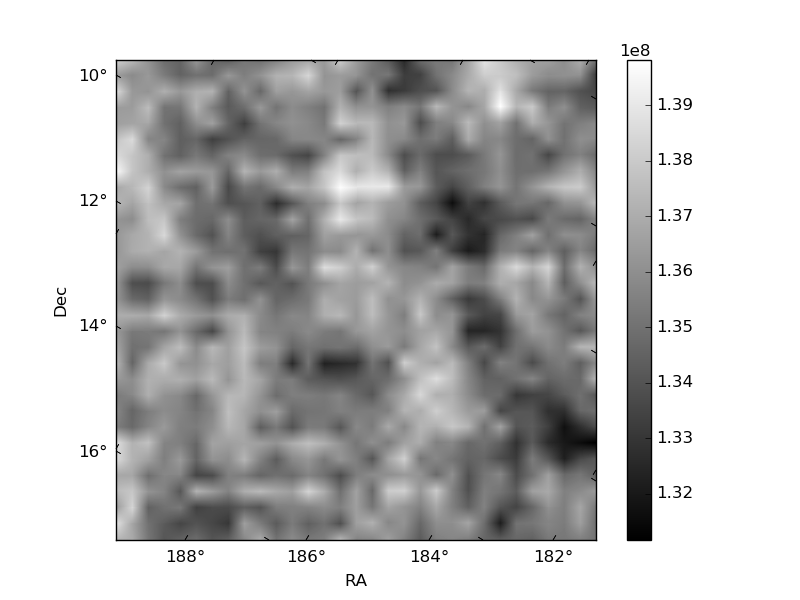
Quadrant B |
|---|---|---|---|
| Quadrant D | 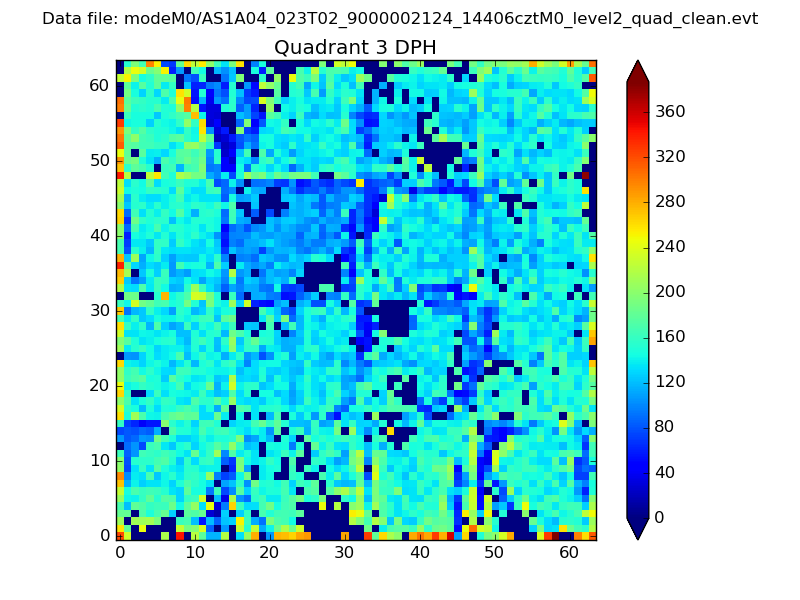 |
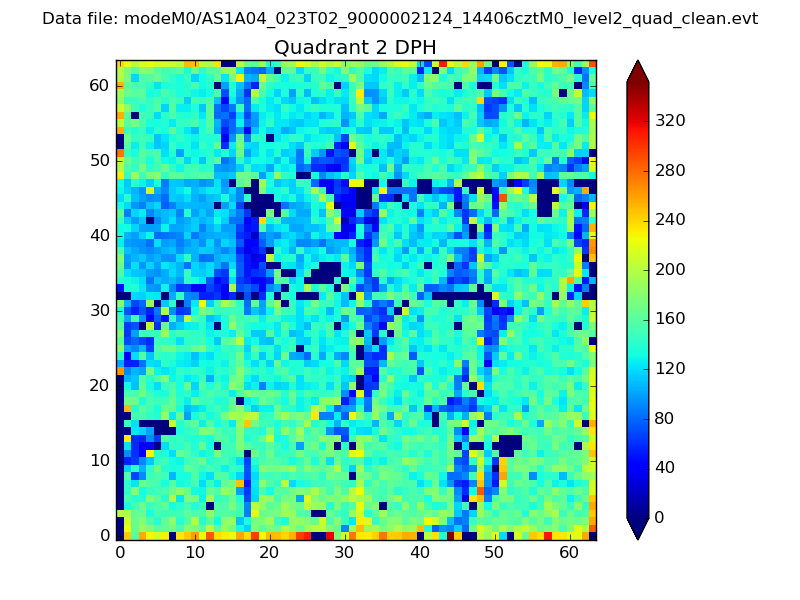 |
Quadrant C |
| Plot type | Count rate plots | Images |
|---|---|---|
| Comparison with Poisson distribution Blue bars denote a histogram of data divided into 1 sec bins. Red curve is a Poisson curve with rate = median count rate of data. |
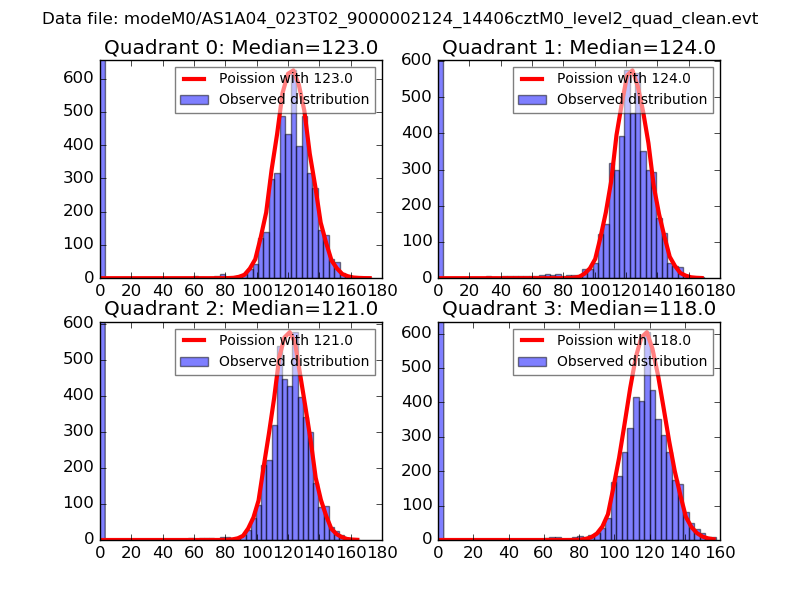 |
 |
| Quadrant-wise count rates Data is divided into 100 sec bins |
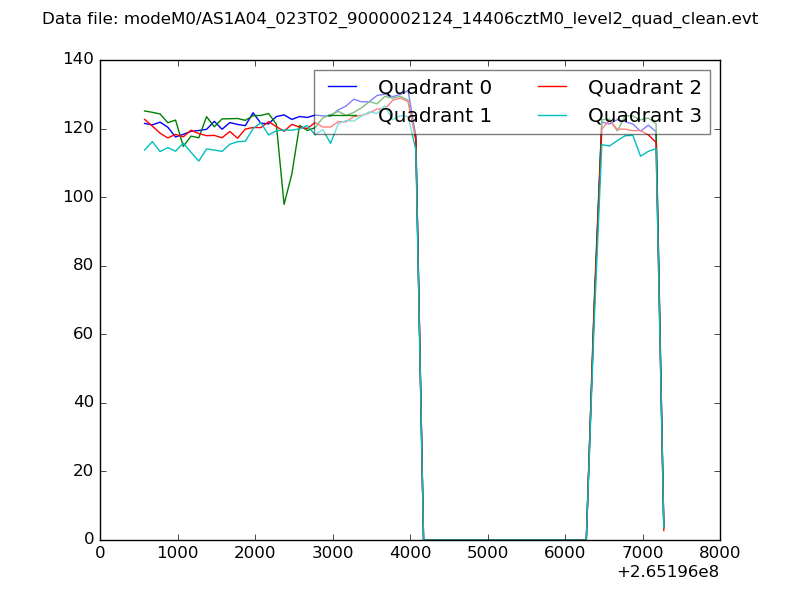 |
|
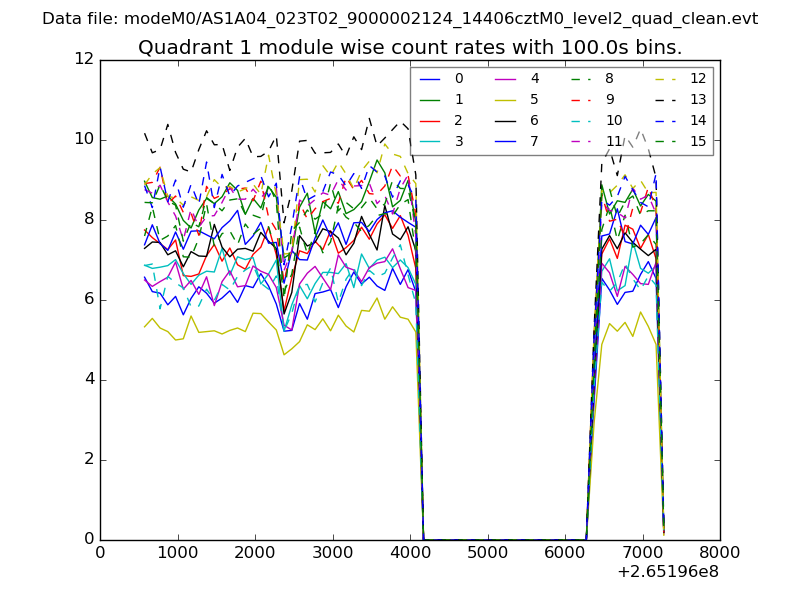
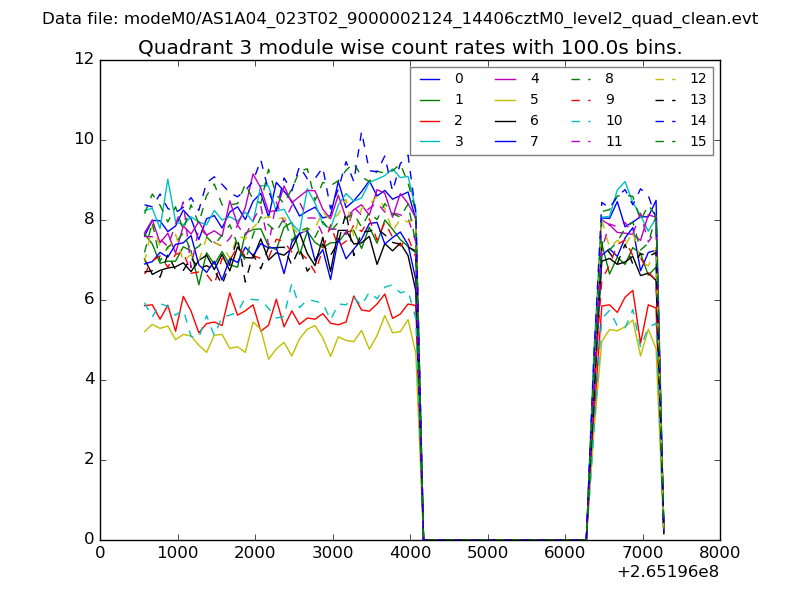
| Module-wise count rates for Quadrant A Data is divided into 100 sec bins |
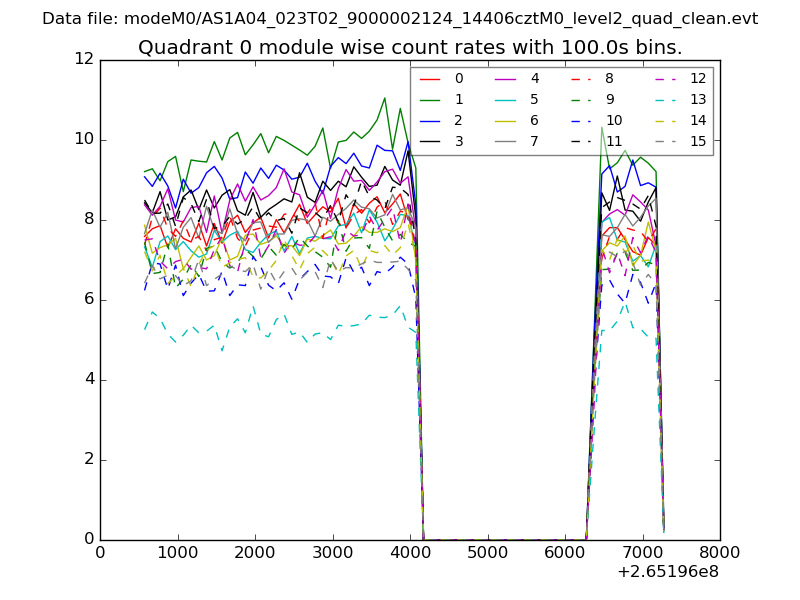 |
 |
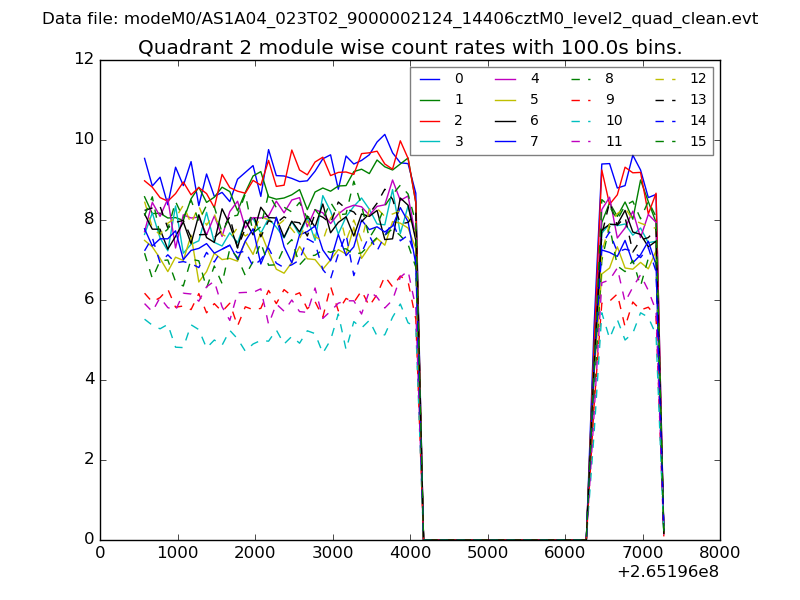
| Module-wise count rates for Quadrant B Data is divided into 100 sec bins |
 |
 |
| Module-wise count rates for Quadrant C Data is divided into 100 sec bins |
 |
 |
| Module-wise count rates for Quadrant D Data is divided into 100 sec bins |
 |
 |
| Parameter | Plot |
|---|---|
| CZT HV Monitor | 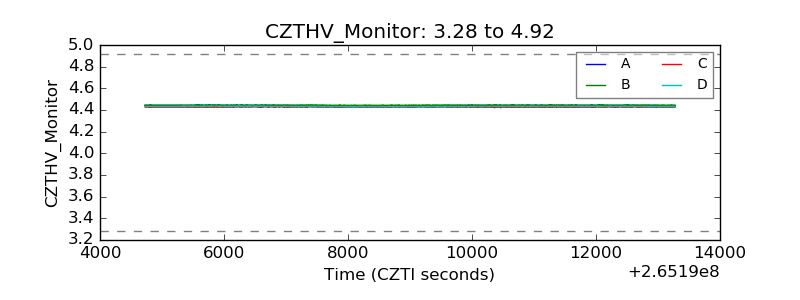 |
| D_VDD | 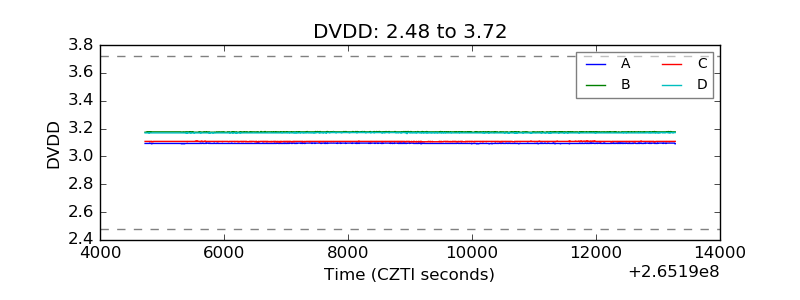 |
| Temperature 1 | 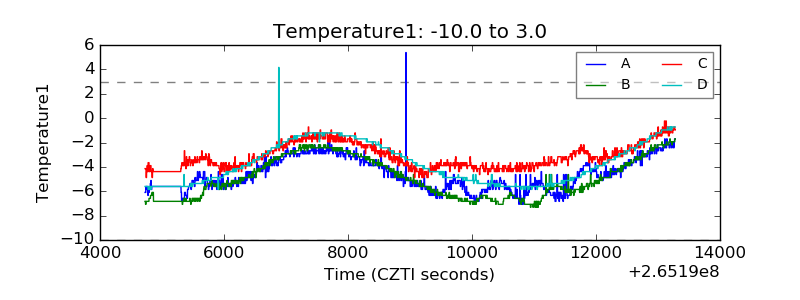 |
| Veto HV Monitor | 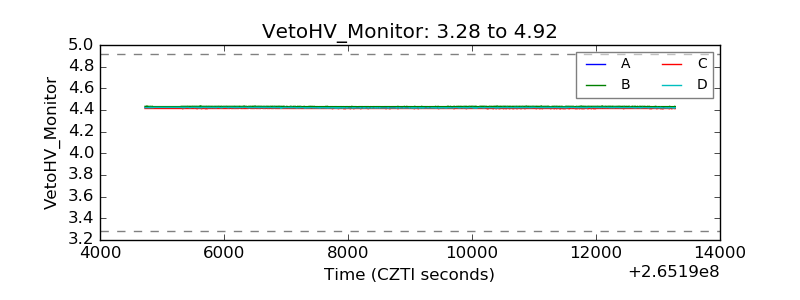 |
| Veto LLD | 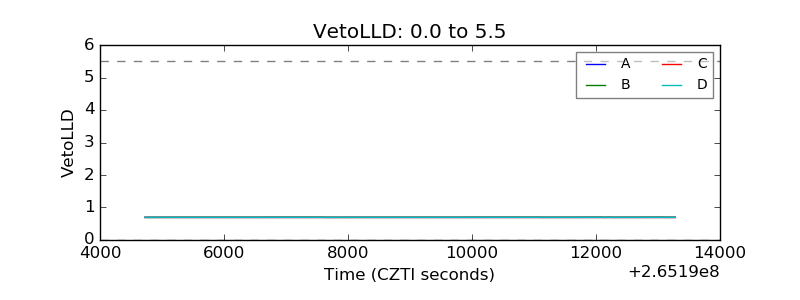 |
| Alpha Counter | 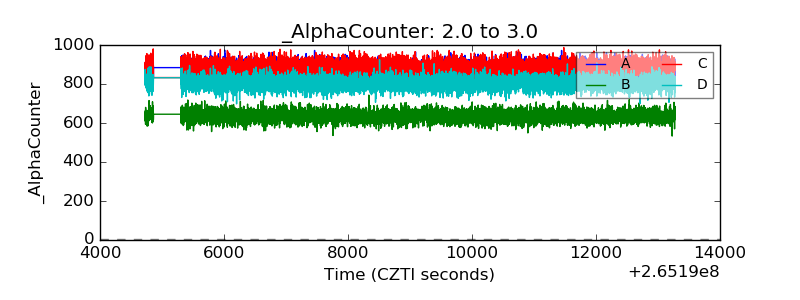 |
| _CPM_Rate | 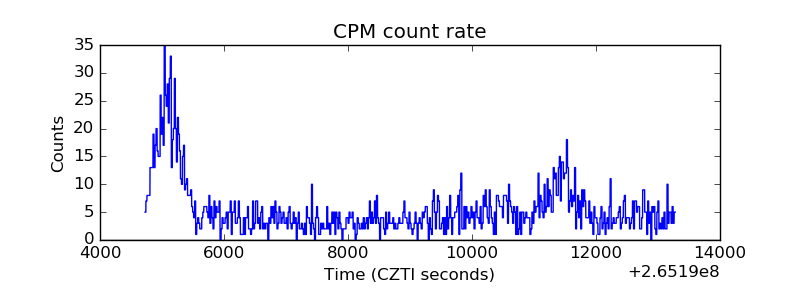 |
| CZT Counter | 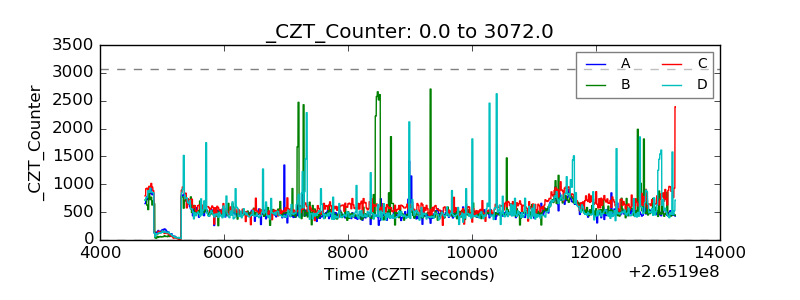 |
| +2.5 Volts monitor |  |
| +5 Volts monitor |  |
| _ROLL_ROT | 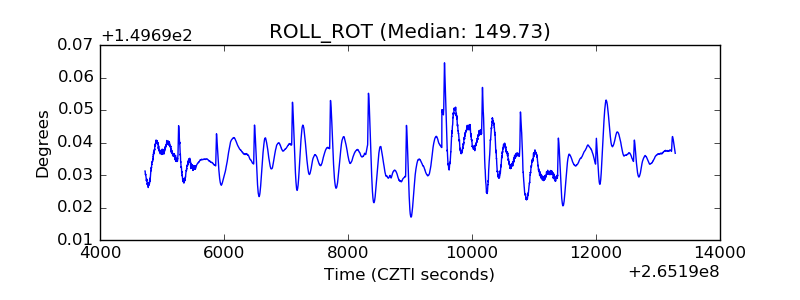 |
| _Roll_DEC | 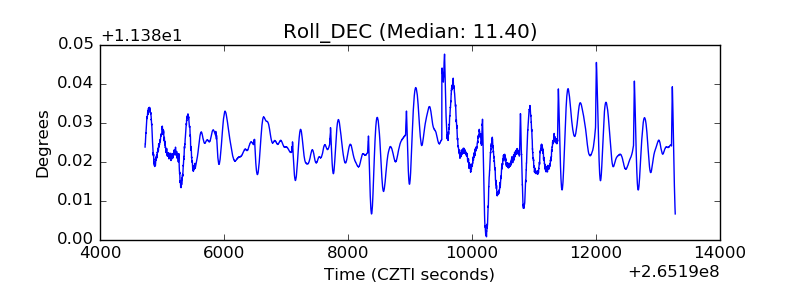 |
| _Roll_RA | 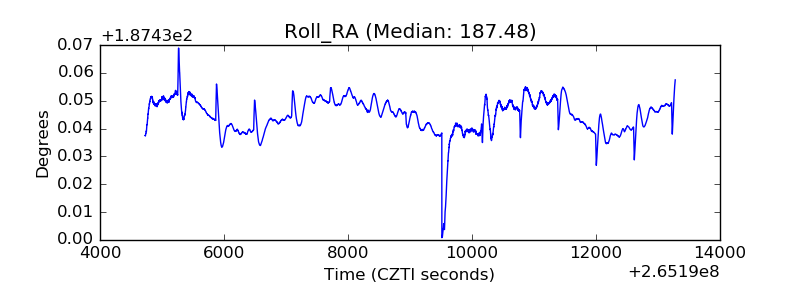 |
| Veto Counter | 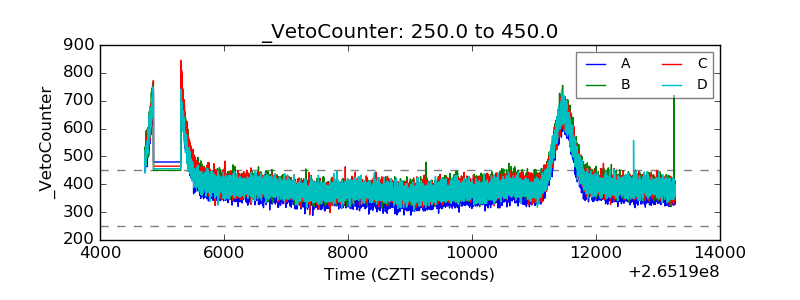 |