| Param | Original file | Final file |
|---|---|---|
| Filename | modeM0/AS1A04_023T02_9000002124_14407cztM0_level2.evt | modeM0/AS1A04_023T02_9000002124_14407cztM0_level2_quad_clean.evt |
| Size (bytes) | 694,719,360 | 95,716,800 |
| Size | 662.5 MB | 91.3 MB |
| Events in quadrant A | 4,170,001 | 596,598 |
| Events in quadrant B | 4,569,667 | 595,001 |
| Events in quadrant C | 5,893,538 | 581,610 |
| Events in quadrant D | 5,844,993 | 549,547 |
| Mode M9 | |||
|---|---|---|---|
| Quadrant | BADHDUFLAG | Total packets | Discarded packets |
| A | 0 | 1 | 0 |
| B | 0 | 1 | 0 |
| C | 0 | 1 | 0 |
| D | 0 | 1 | 0 |
| Mode M0 | |||
|---|---|---|---|
| Quadrant | BADHDUFLAG | Total packets | Discarded packets |
| A | 0 | 17699 | 3 |
| B | 0 | 18876 | 1 |
| C | 0 | 23518 | 1 |
| D | 0 | 22890 | 1 |
| Mode SS | |||
|---|---|---|---|
| Quadrant | BADHDUFLAG | Total packets | Discarded packets |
| A | 0 | 168 | 0 |
| B | 0 | 168 | 0 |
| C | 0 | 168 | 0 |
| D | 0 | 168 | 0 |
| Quadrant | Total seconds | Saturated seconds | Saturation percentage |
|---|---|---|---|
| A | 8284 | 488 | 5.890874% |
| B | 8284 | 584 | 7.049734% |
| C | 8284 | 441 | 5.323515% |
| D | 8284 | 890 | 10.743602% |
Noise dominated data is calculated using 1-second bins in cleaned event files. If a bin has >2000 counts, and if more than 50% of those come from <1% of pixels, then it is considered to be noise-dominated and hence unusable.
| Quadrant | # 1 sec bins | Bins with >0 counts | Bins with >2000 counts | High rate bins dominated by noise | Noise dominated (total time) | Noise dominated (detector-on time) | Marked lightcurve |
|---|---|---|---|---|---|---|---|
| A | 8392 | 8286 | 0 | 0 | 0.00% | 0.00% | 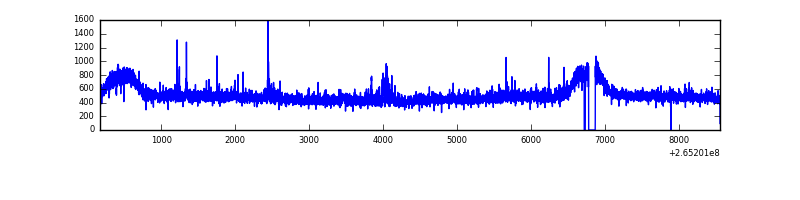 |
| B | 8392 | 8286 | 48 | 48 | 0.57% | 0.58% | 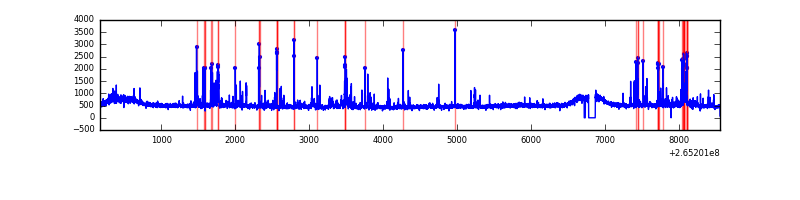 |
| C | 8392 | 8286 | 33 | 33 | 0.39% | 0.40% | 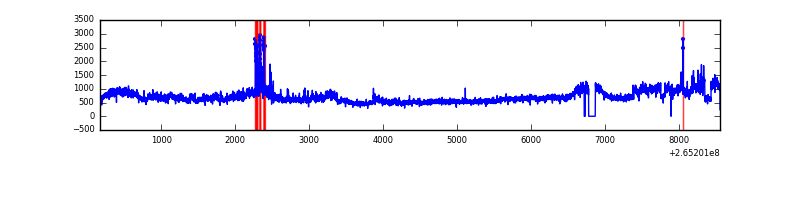 |
| D | 8392 | 8285 | 432 | 432 | 5.15% | 5.21% | 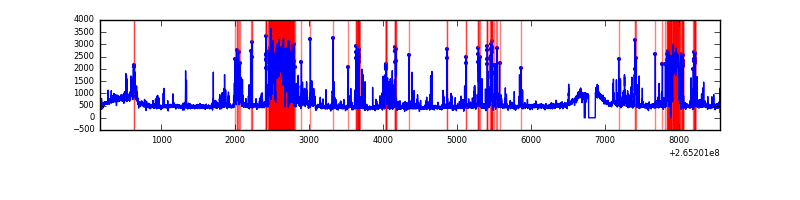 |
Top three noisy pixels from each quadrant. If the there are fewer than three noisy pixels in the level2.evt file, extra rows are filled as -1
| Pixel properties | Quadrant properties | ||||||
|---|---|---|---|---|---|---|---|
| Quadrant | DetID | PixID | Counts | Sigma | Mean | Median | Sigma |
| A | 12 | 189 | 64046 | 292.8 | 1051 | 1022 | 215.2 |
| A | 4 | 2 | 36084 | 162.89 | 1051 | 1022 | 215.2 |
| A | 8 | 15 | 22065 | 97.76 | 1051 | 1022 | 215.2 |
| B | 0 | 229 | 199396 | 970.56 | 1041 | 1010 | 204.4 |
| B | 4 | 173 | 92650 | 448.33 | 1041 | 1010 | 204.4 |
| B | 0 | 182 | 79264 | 382.84 | 1041 | 1010 | 204.4 |
| C | 3 | 233 | 1762307 | 7380.0 | 1021 | 1025 | 238.7 |
| C | 0 | 207 | 142537 | 592.95 | 1021 | 1025 | 238.7 |
| C | 13 | 61 | 7516 | 27.2 | 1021 | 1025 | 238.7 |
| D | 13 | 122 | 989574 | 4081.47 | 1006 | 978 | 242.2 |
| D | 10 | 199 | 345007 | 1420.34 | 1006 | 978 | 242.2 |
| D | 2 | 120 | 296345 | 1219.44 | 1006 | 978 | 242.2 |
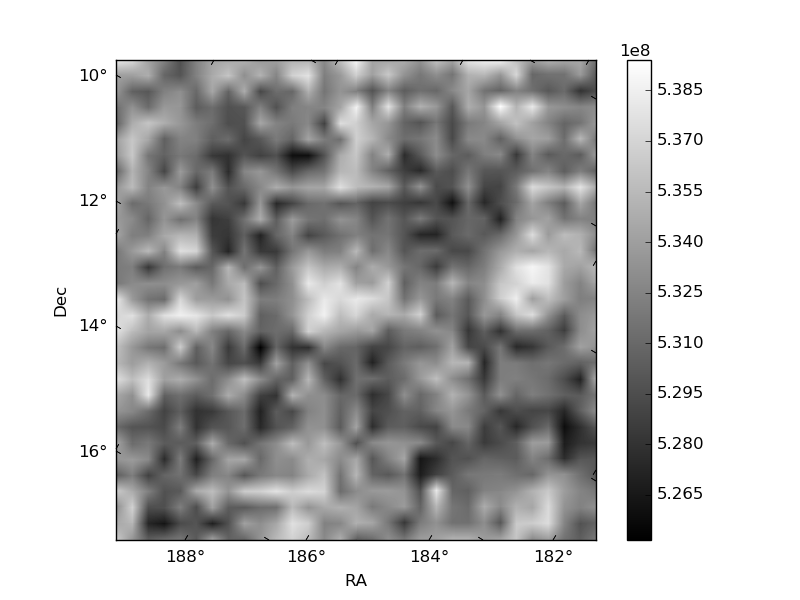
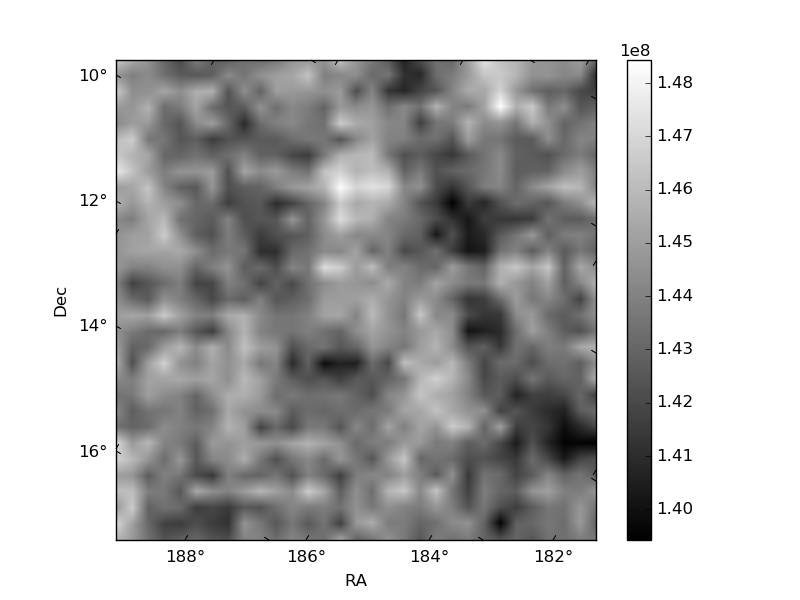
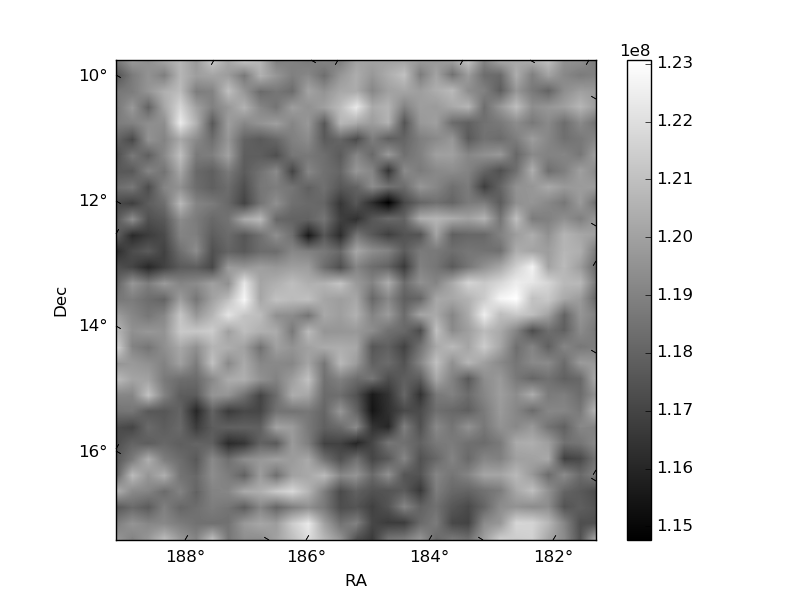
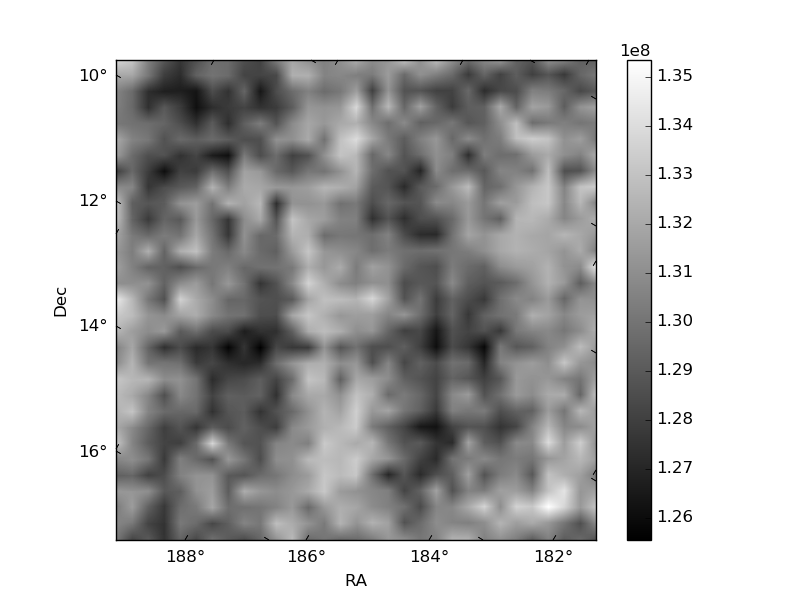
Histogram calculated using DETX and DETY for each event in the final _common_clean file
| Quadrant A | 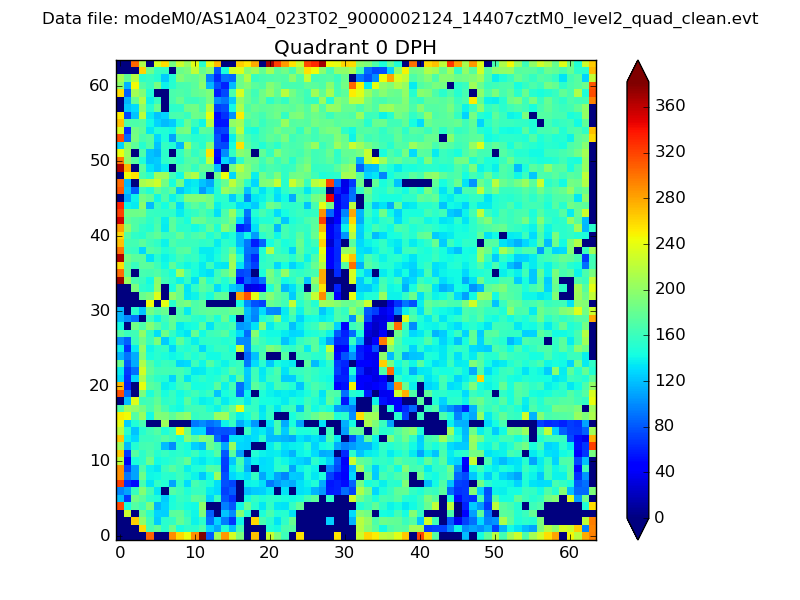 |
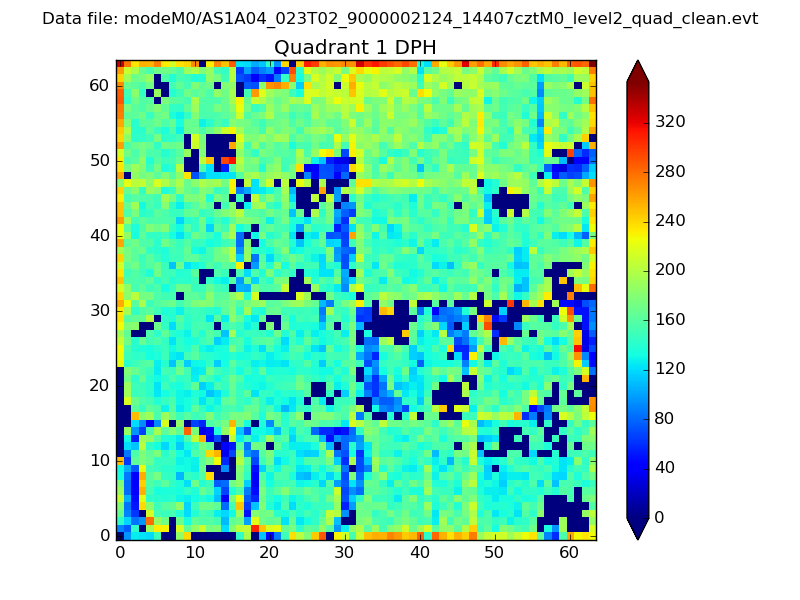 |
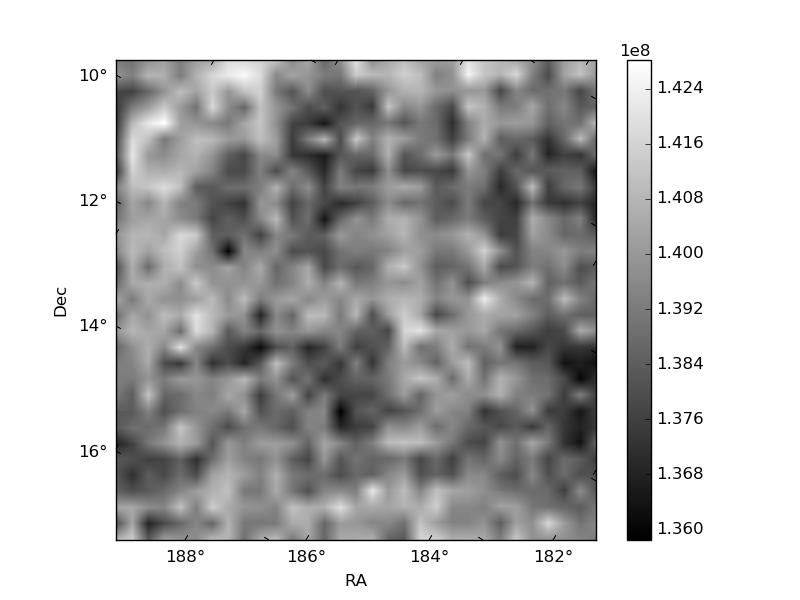
Quadrant B |
|---|---|---|---|
| Quadrant D | 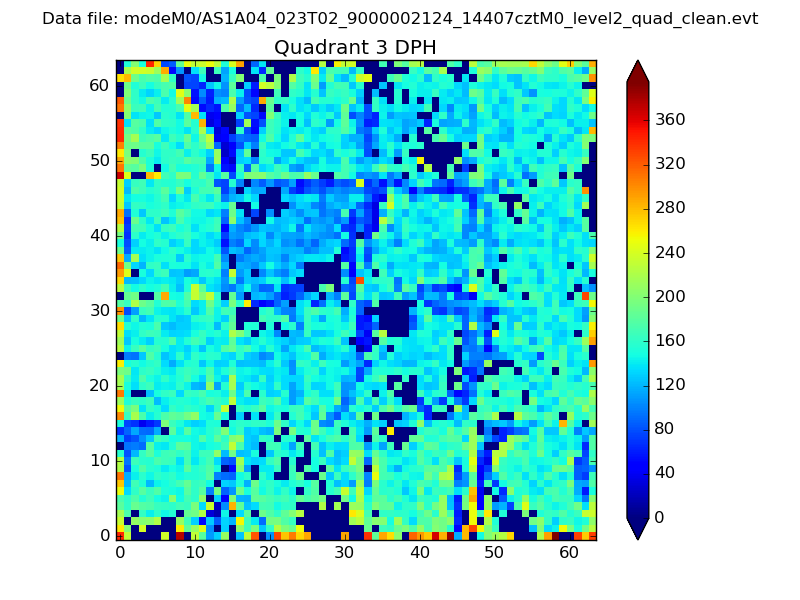 |
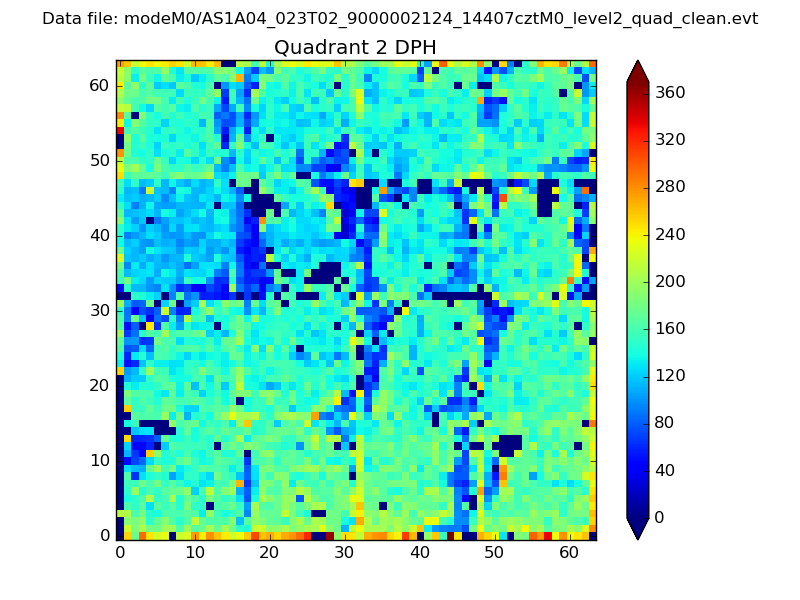 |
Quadrant C |
| Plot type | Count rate plots | Images |
|---|---|---|
| Comparison with Poisson distribution Blue bars denote a histogram of data divided into 1 sec bins. Red curve is a Poisson curve with rate = median count rate of data. |
 |
 |
| Quadrant-wise count rates Data is divided into 100 sec bins |
 |
|
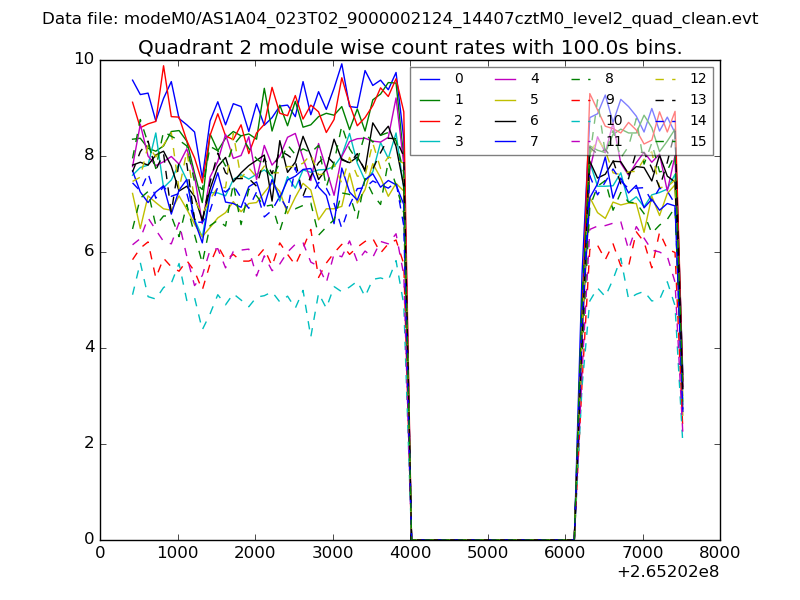
| Module-wise count rates for Quadrant A Data is divided into 100 sec bins |
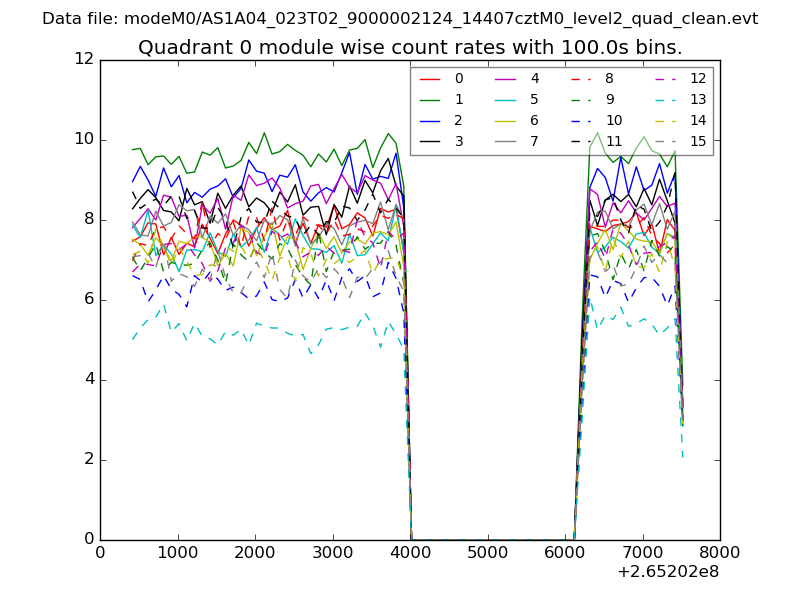 |
 |
| Module-wise count rates for Quadrant B Data is divided into 100 sec bins |
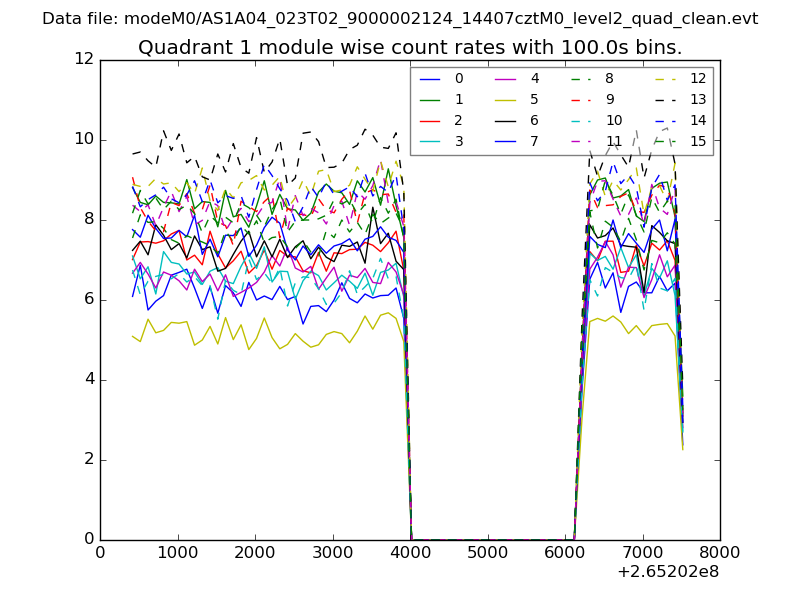 |
 |
| Module-wise count rates for Quadrant C Data is divided into 100 sec bins |
 |
 |
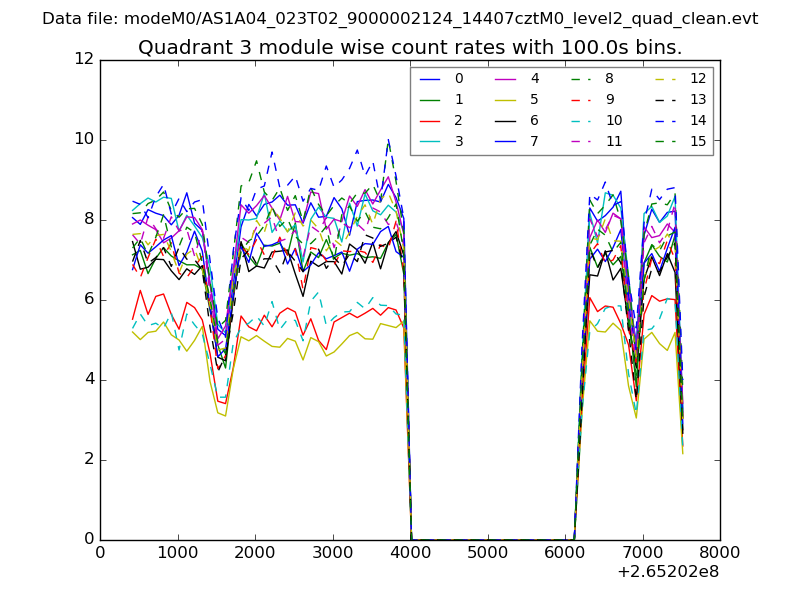
| Module-wise count rates for Quadrant D Data is divided into 100 sec bins |
 |
 |
| Parameter | Plot |
|---|---|
| CZT HV Monitor | 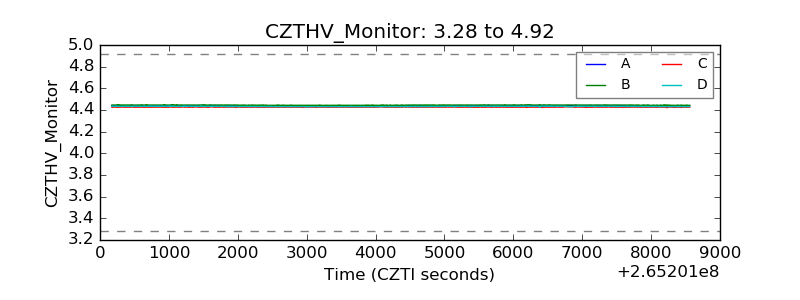 |
| D_VDD | 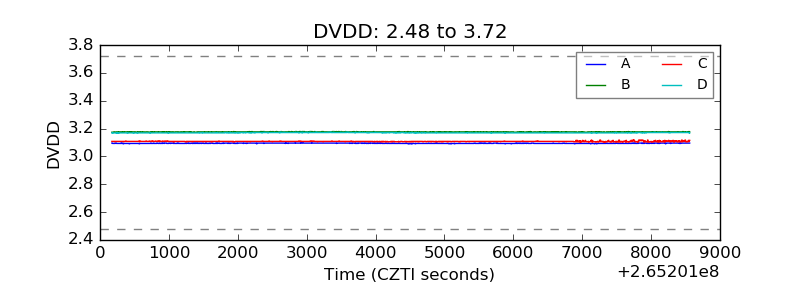 |
| Temperature 1 | 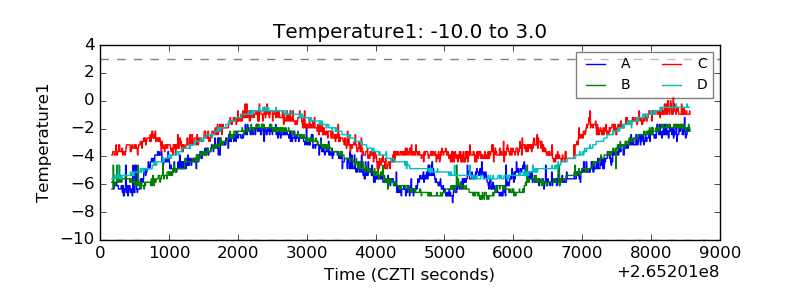 |
| Veto HV Monitor |  |
| Veto LLD | 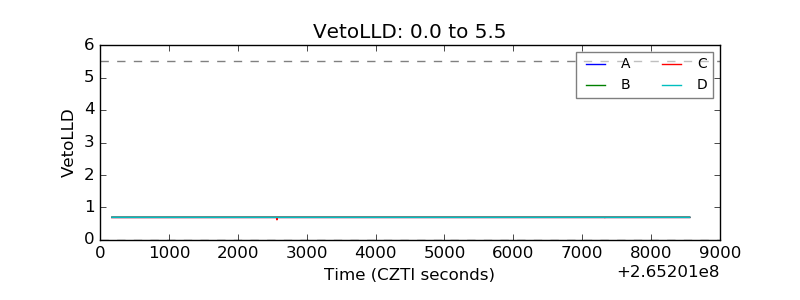 |
| Alpha Counter | 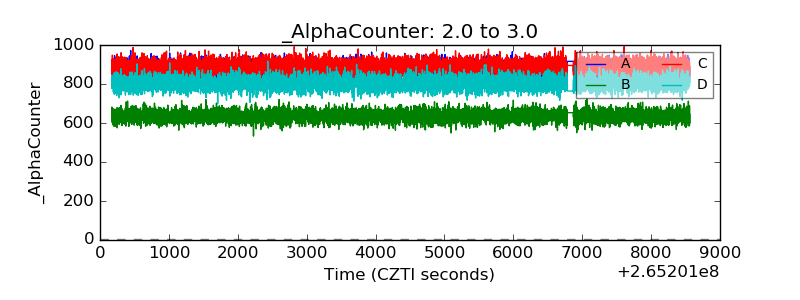 |
| _CPM_Rate |  |
| CZT Counter | 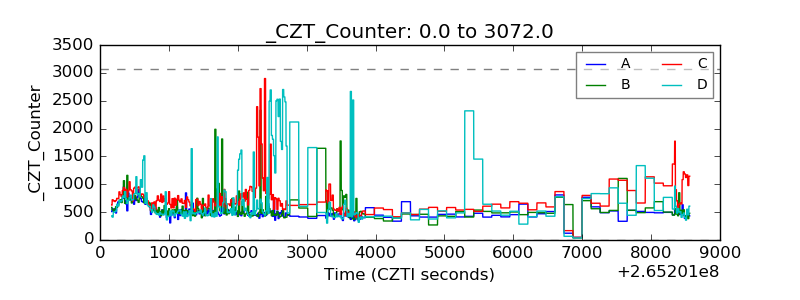 |
| +2.5 Volts monitor | 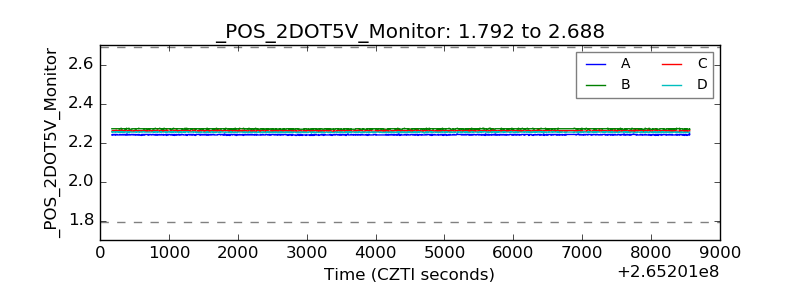 |
| +5 Volts monitor |  |
| _ROLL_ROT | 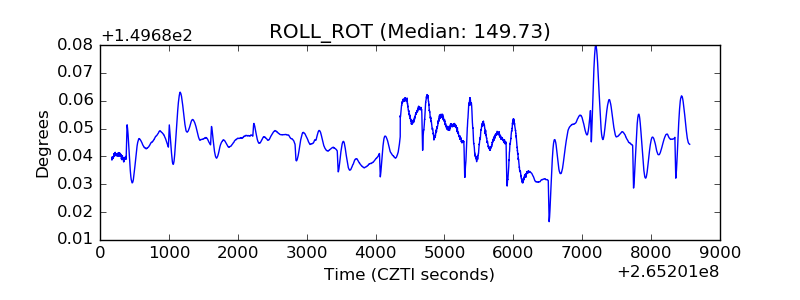 |
| _Roll_DEC | 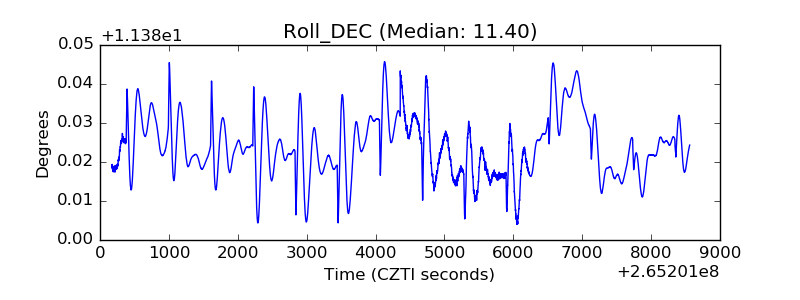 |
| _Roll_RA | 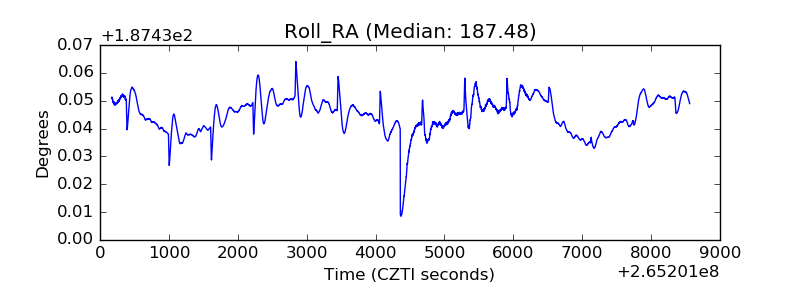 |
| Veto Counter | 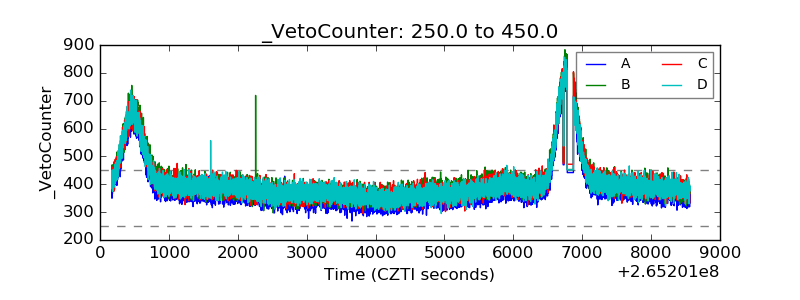 |