| Param | Original file | Final file |
|---|---|---|
| Filename | modeM0/AS1A04_023T02_9000002124_14410cztM0_level2.evt | modeM0/AS1A04_023T02_9000002124_14410cztM0_level2_quad_clean.evt |
| Size (bytes) | 152,303,040 | 31,276,800 |
| Size | 145.2 MB | 29.8 MB |
| Events in quadrant A | 795,698 | 211,439 |
| Events in quadrant B | 920,600 | 210,343 |
| Events in quadrant C | 1,503,576 | 203,635 |
| Events in quadrant D | 1,271,895 | 193,494 |
| Mode M0 | |||
|---|---|---|---|
| Quadrant | BADHDUFLAG | Total packets | Discarded packets |
| A | 0 | 3491 | 1 |
| B | 0 | 3884 | 0 |
| C | 0 | 5844 | 0 |
| D | 0 | 4926 | 0 |
| Mode SS | |||
|---|---|---|---|
| Quadrant | BADHDUFLAG | Total packets | Discarded packets |
| A | 0 | 36 | 0 |
| B | 0 | 36 | 0 |
| C | 0 | 36 | 0 |
| D | 0 | 36 | 0 |
| Quadrant | Total seconds | Saturated seconds | Saturation percentage |
|---|---|---|---|
| A | 1737 | 0 | 0.000000% |
| B | 1737 | 26 | 1.496834% |
| C | 1737 | 8 | 0.460564% |
| D | 1737 | 145 | 8.347726% |
Noise dominated data is calculated using 1-second bins in cleaned event files. If a bin has >2000 counts, and if more than 50% of those come from <1% of pixels, then it is considered to be noise-dominated and hence unusable.
| Quadrant | # 1 sec bins | Bins with >0 counts | Bins with >2000 counts | High rate bins dominated by noise | Noise dominated (total time) | Noise dominated (detector-on time) | Marked lightcurve |
|---|---|---|---|---|---|---|---|
| A | 1740 | 1739 | 0 | 0 | 0.00% | 0.00% |  |
| B | 1740 | 1739 | 19 | 19 | 1.09% | 1.09% |  |
| C | 1740 | 1739 | 2 | 2 | 0.11% | 0.12% |  |
| D | 1740 | 1738 | 132 | 132 | 7.59% | 7.59% |  |
Top three noisy pixels from each quadrant. If the there are fewer than three noisy pixels in the level2.evt file, extra rows are filled as -1
| Pixel properties | Quadrant properties | ||||||
|---|---|---|---|---|---|---|---|
| Quadrant | DetID | PixID | Counts | Sigma | Mean | Median | Sigma |
| A | 12 | 189 | 10757 | 246.71 | 202 | 197 | 42.8 |
| A | 8 | 15 | 7252 | 164.83 | 202 | 197 | 42.8 |
| A | 0 | 226 | 1844 | 38.48 | 202 | 197 | 42.8 |
| B | 0 | 229 | 103236 | 2584.63 | 197 | 192 | 39.9 |
| B | 0 | 189 | 17793 | 441.48 | 197 | 192 | 39.9 |
| B | 0 | 219 | 15245 | 377.57 | 197 | 192 | 39.9 |
| C | 3 | 233 | 725187 | 15707.2 | 193 | 194 | 46.2 |
| C | 0 | 207 | 19010 | 407.65 | 193 | 194 | 46.2 |
| C | 8 | 128 | 2943 | 59.56 | 193 | 194 | 46.2 |
| D | 13 | 122 | 342558 | 7301.31 | 190 | 186 | 46.9 |
| D | 2 | 120 | 73517 | 1563.83 | 190 | 186 | 46.9 |
| D | 15 | 0 | 61841 | 1314.83 | 190 | 186 | 46.9 |
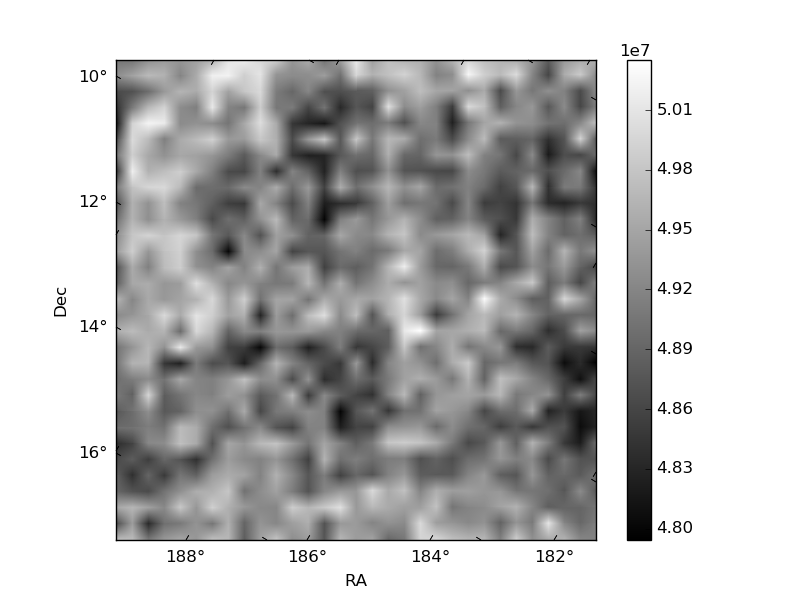
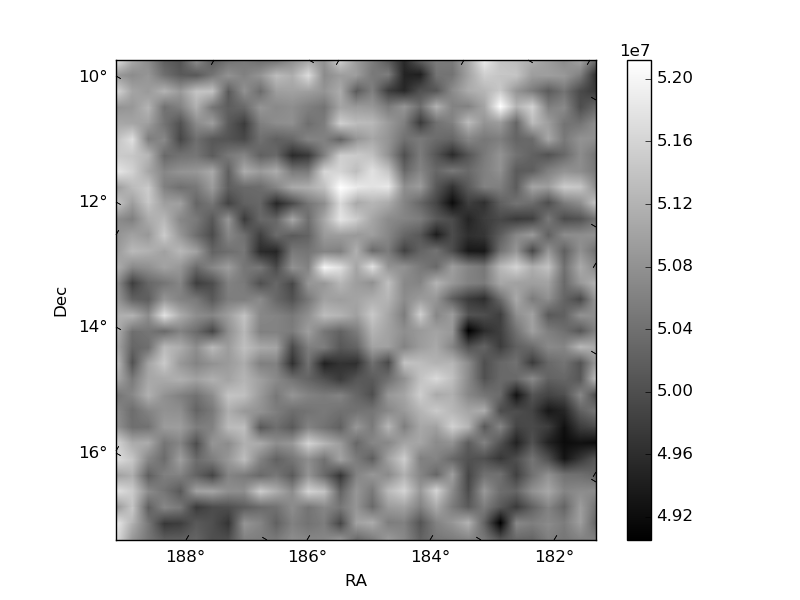
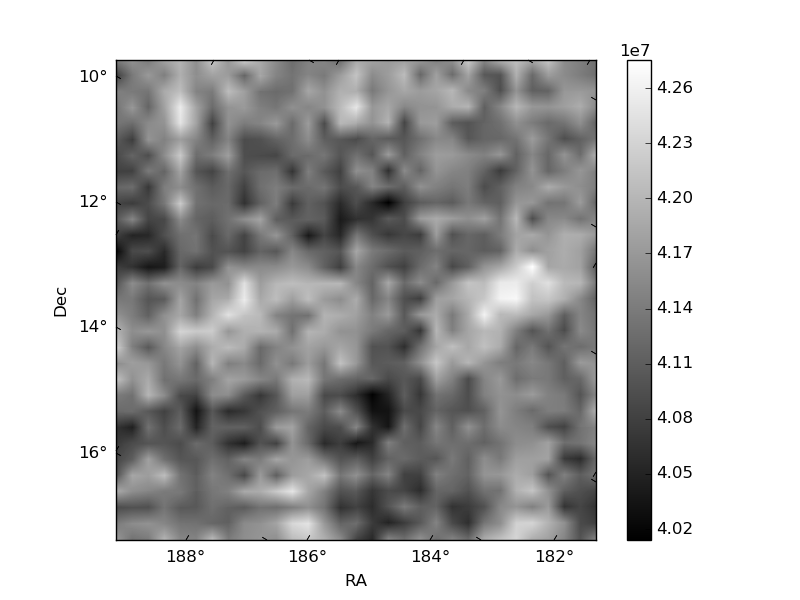
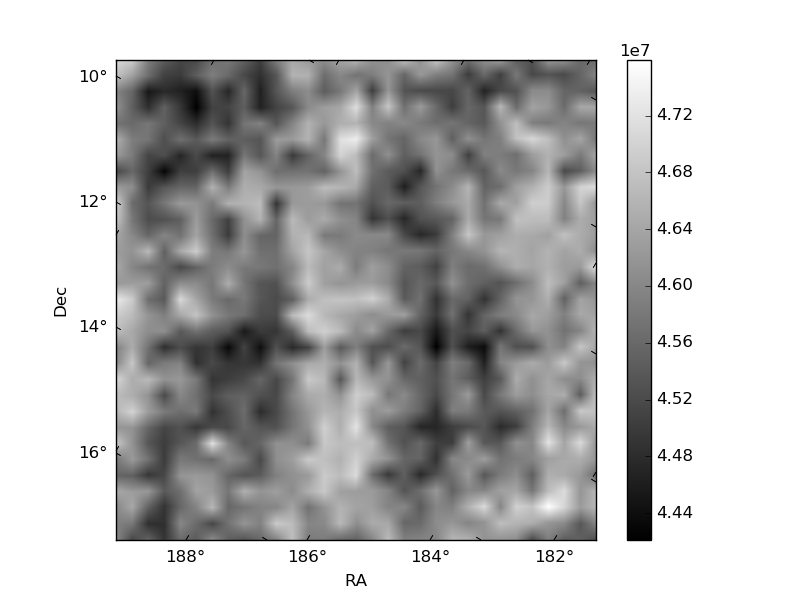
Histogram calculated using DETX and DETY for each event in the final _common_clean file
| Quadrant A |  |
 |
Quadrant B |
|---|---|---|---|
| Quadrant D |  |
 |
Quadrant C |
| Plot type | Count rate plots | Images |
|---|---|---|
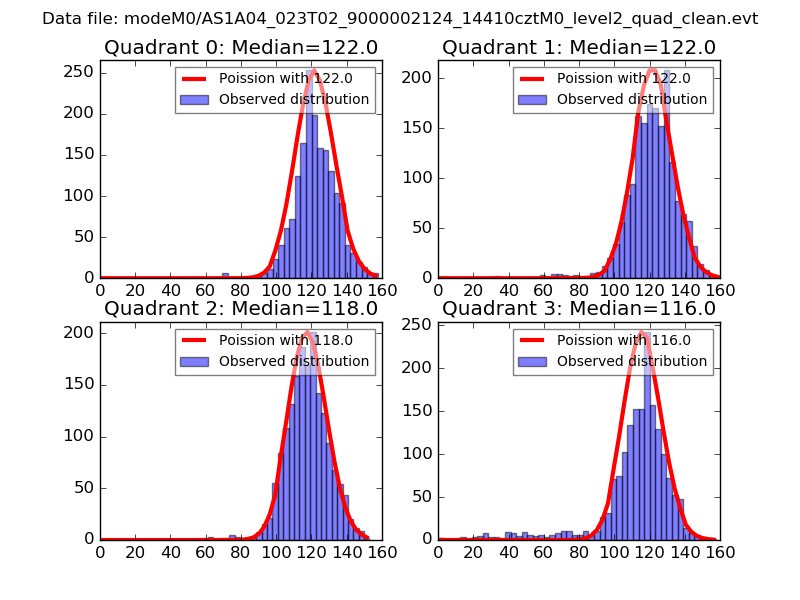
| Comparison with Poisson distribution Blue bars denote a histogram of data divided into 1 sec bins. Red curve is a Poisson curve with rate = median count rate of data. |
 |
 |
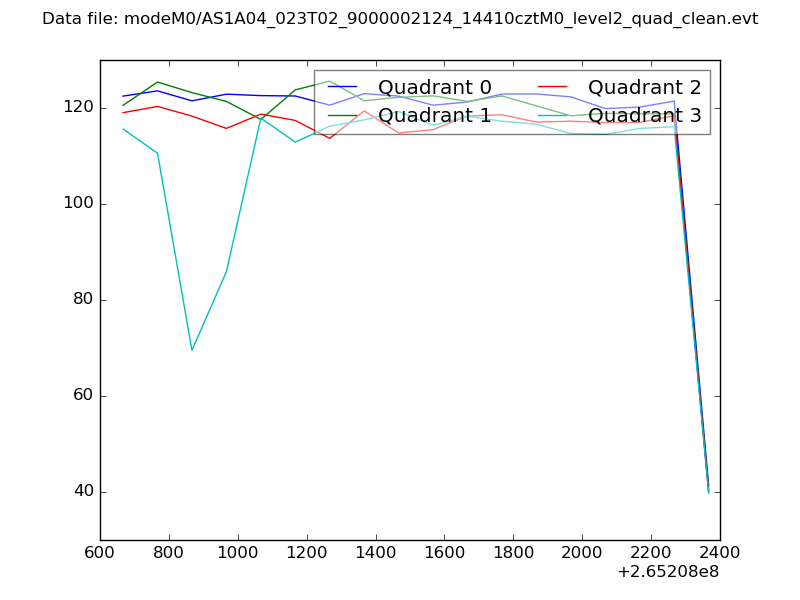
| Quadrant-wise count rates Data is divided into 100 sec bins |
 |
|
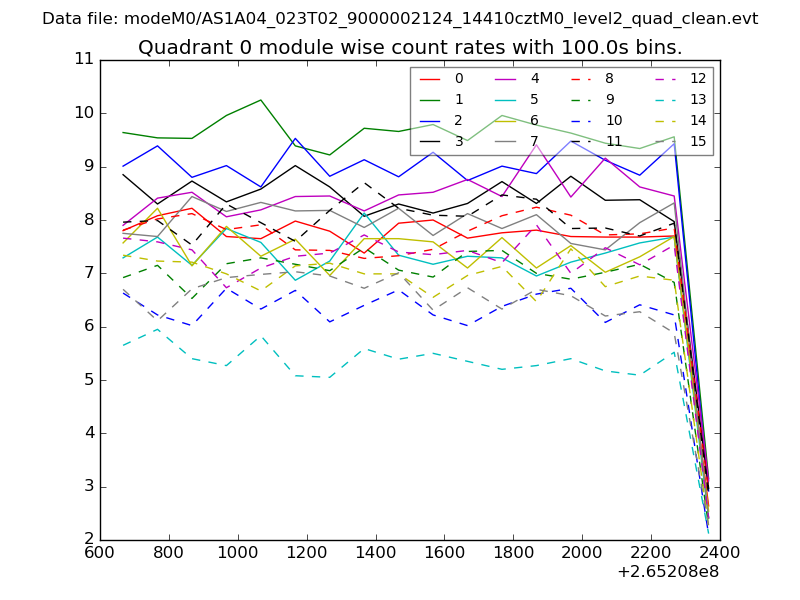
| Module-wise count rates for Quadrant A Data is divided into 100 sec bins |
 |
 |
| Module-wise count rates for Quadrant B Data is divided into 100 sec bins |
 |
 |
| Module-wise count rates for Quadrant C Data is divided into 100 sec bins |
 |
 |
| Module-wise count rates for Quadrant D Data is divided into 100 sec bins |
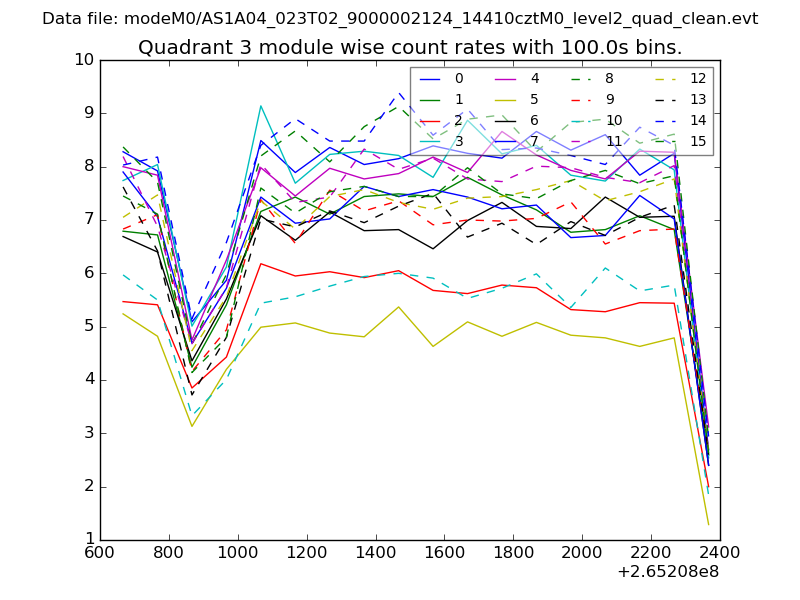 |
 |
| Parameter | Plot |
|---|---|
| CZT HV Monitor |  |
| D_VDD | 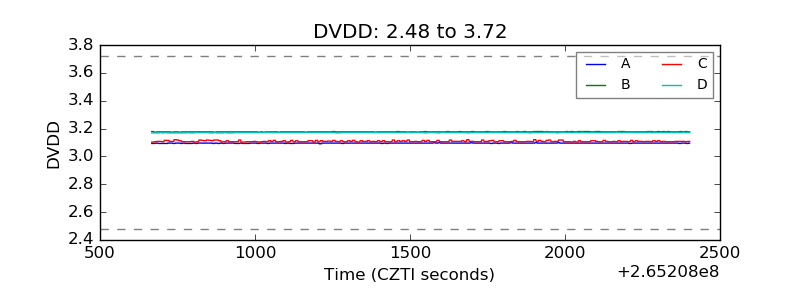 |
| Temperature 1 | 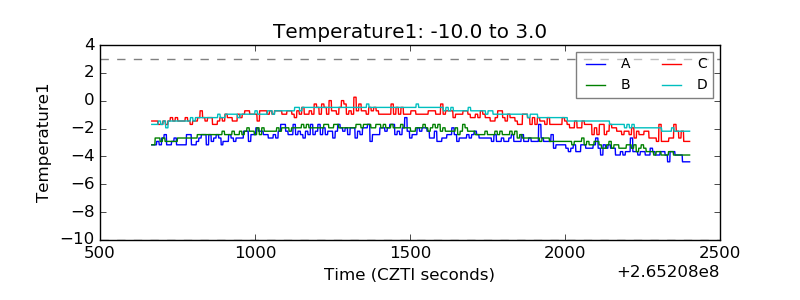 |
| Veto HV Monitor | 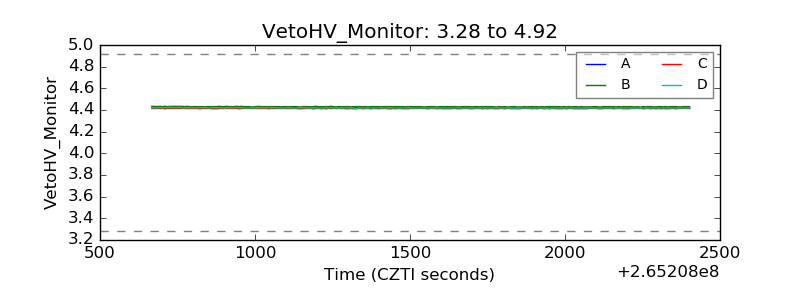 |
| Veto LLD | 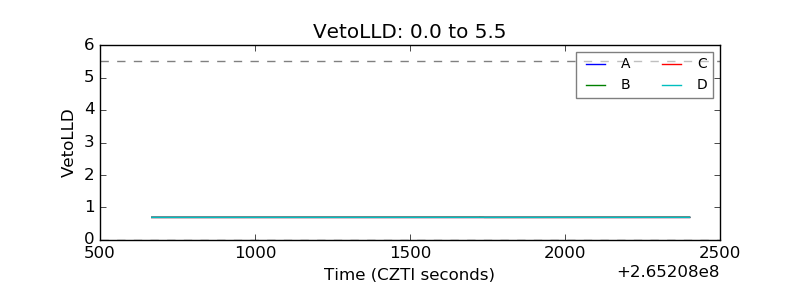 |
| Alpha Counter | 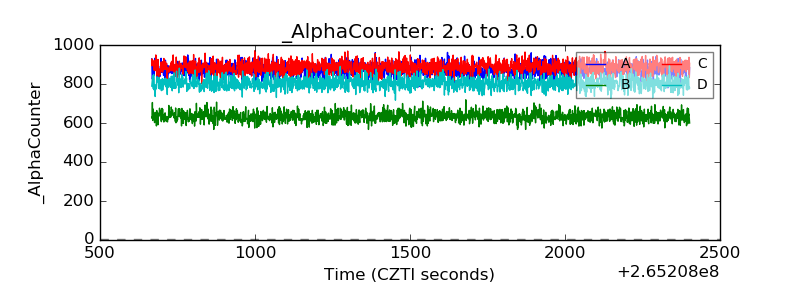 |
| _CPM_Rate | 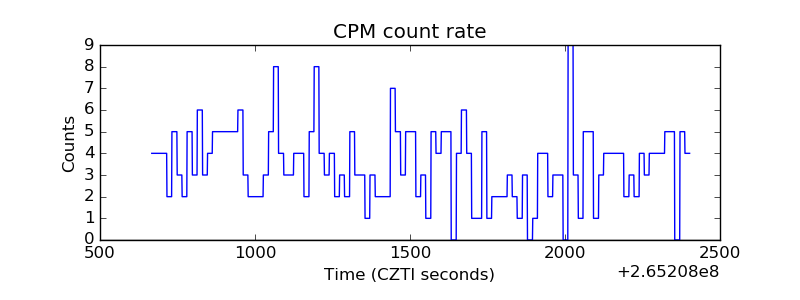 |
| CZT Counter | 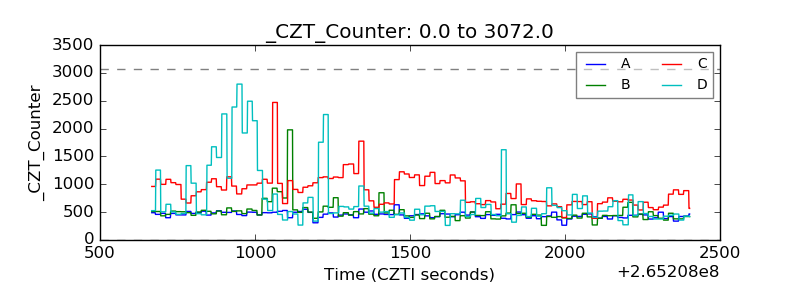 |
| +2.5 Volts monitor |  |
| +5 Volts monitor | 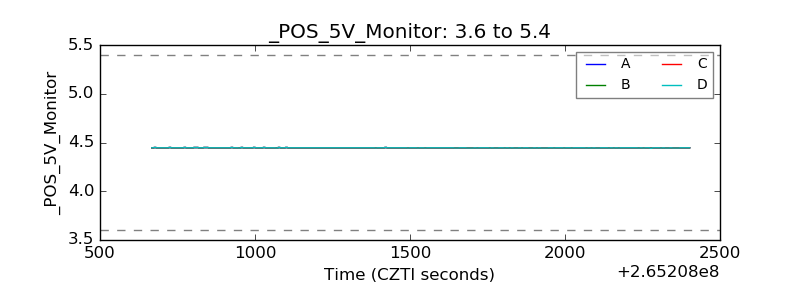 |
| _ROLL_ROT | 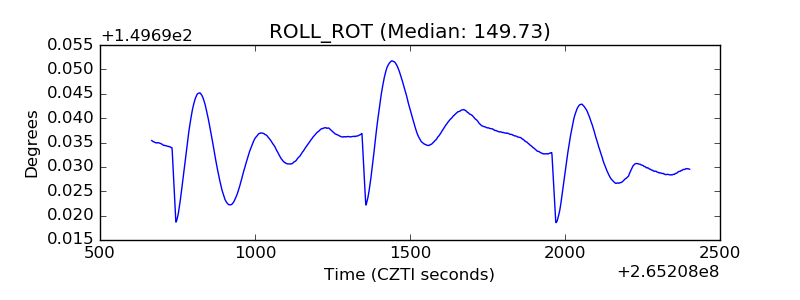 |
| _Roll_DEC | 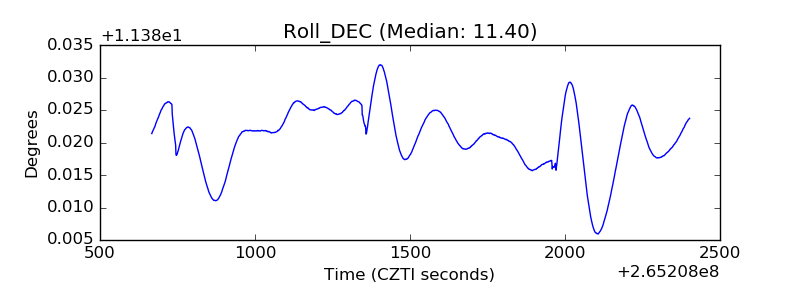 |
| _Roll_RA | 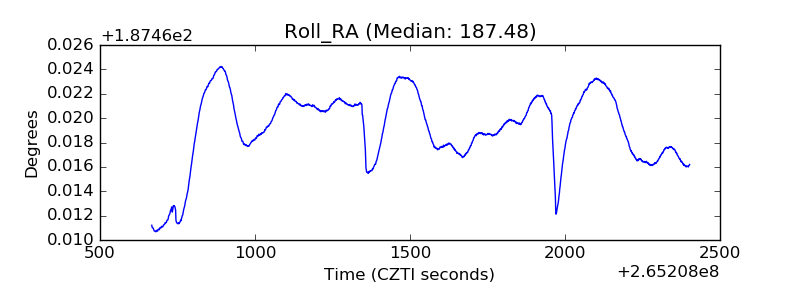 |
| Veto Counter | 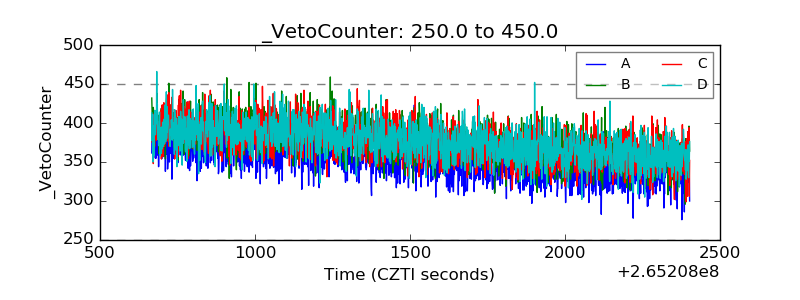 |