| Param | Original file | Final file |
|---|---|---|
| Filename | modeM0/AS1A04_186T01_9000002126cztM0_level2.fits | modeM0/AS1A04_186T01_9000002126cztM0_level2_quad_clean.evt |
| Size (bytes) | 289,206,720 | 302,780,160 |
| Size | 275.8 MB | 288.8 MB |
| Events in quadrant A | 1,767,476 | 1,911,452 |
| Events in quadrant B | 1,691,072 | 1,808,172 |
| Events in quadrant C | 1,713,888 | 1,740,467 |
| Events in quadrant D | 1,465,728 | 1,589,773 |
| Mode M9 | |||
|---|---|---|---|
| Quadrant | BADHDUFLAG | Total packets | Discarded packets |
| A | 0 | 55 | 0 |
| B | 0 | 55 | 0 |
| C | 0 | 55 | 0 |
| D | 0 | 55 | 0 |
| Mode M0 | |||
|---|---|---|---|
| Quadrant | BADHDUFLAG | Total packets | Discarded packets |
| A | 0 | 64502 | 0 |
| B | 0 | 68407 | 0 |
| C | 0 | 80085 | 0 |
| D | 0 | 92292 | 0 |
| Mode SS | |||
|---|---|---|---|
| Quadrant | BADHDUFLAG | Total packets | Discarded packets |
| A | 0 | 626 | 0 |
| B | 0 | 626 | 0 |
| C | 0 | 626 | 0 |
| D | 0 | 626 | 0 |
| Quadrant | Total seconds | Saturated seconds | Saturation percentage |
|---|---|---|---|
| A | 30852 | 218 | 0.706599% |
| B | 30852 | 505 | 1.636847% |
| C | 30852 | 339 | 1.098794% |
| D | 30852 | 2468 | 7.999481% |
Noise dominated data is calculated using 1-second bins in cleaned event files. If a bin has >2000 counts, and if more than 50% of those come from <1% of pixels, then it is considered to be noise-dominated and hence unusable.
| Quadrant | # 1 sec bins | Bins with >0 counts | Bins with >2000 counts | High rate bins dominated by noise | Noise dominated (total time) | Noise dominated (detector-on time) | Marked lightcurve |
|---|---|---|---|---|---|---|---|
| A | 36192 | 30847 | 0 | 0 | 0.00% | 0.00% |  |
| B | 36192 | 30844 | 0 | 0 | 0.00% | 0.00% |  |
| C | 36192 | 30849 | 0 | 0 | 0.00% | 0.00% |  |
| D | 36192 | 30830 | 0 | 0 | 0.00% | 0.00% |  |
Top three noisy pixels from each quadrant. If the there are fewer than three noisy pixels in the level2.evt file, extra rows are filled as -1
| Pixel properties | Quadrant properties | ||||||
|---|---|---|---|---|---|---|---|
| Quadrant | DetID | PixID | Counts | Sigma | Mean | Median | Sigma |
| A | 0 | 29 | 1680 | 10.57 | 460 | 431 | 118.1 |
| A | 7 | 110 | 1454 | 8.66 | 460 | 431 | 118.1 |
| A | 15 | 236 | 1364 | 7.89 | 460 | 431 | 118.1 |
| B | 2 | 9 | 1498 | 11.93 | 447 | 426 | 89.9 |
| B | 3 | 80 | 1173 | 8.31 | 447 | 426 | 89.9 |
| B | 3 | 17 | 1117 | 7.69 | 447 | 426 | 89.9 |
| C | 12 | 241 | 1256 | 7.06 | 453 | 422 | 118.2 |
| C | 9 | 233 | 1202 | 6.6 | 453 | 422 | 118.2 |
| C | 2 | 191 | 1189 | 6.49 | 453 | 422 | 118.2 |
| D | 3 | 14 | 1127 | 6.48 | 418 | 379 | 115.5 |
| D | 1 | 31 | 1051 | 5.82 | 418 | 379 | 115.5 |
| D | 6 | 231 | 1045 | 5.77 | 418 | 379 | 115.5 |
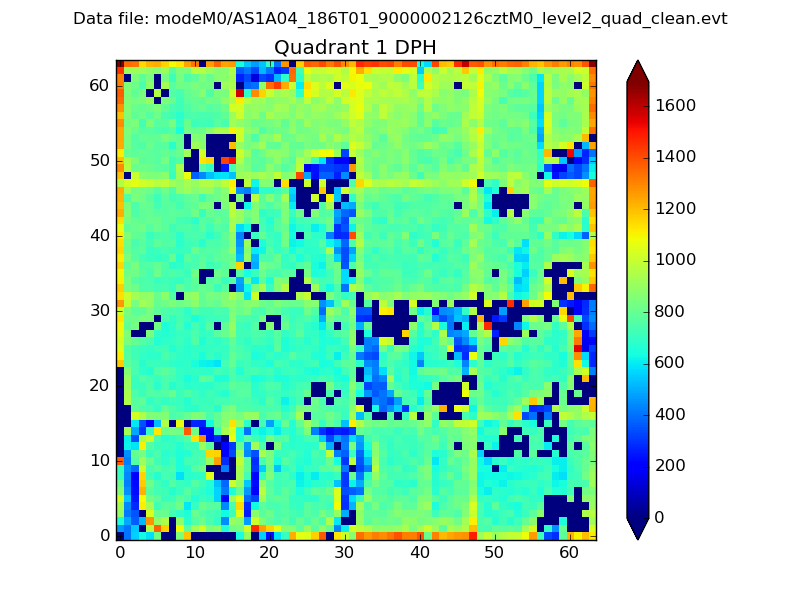
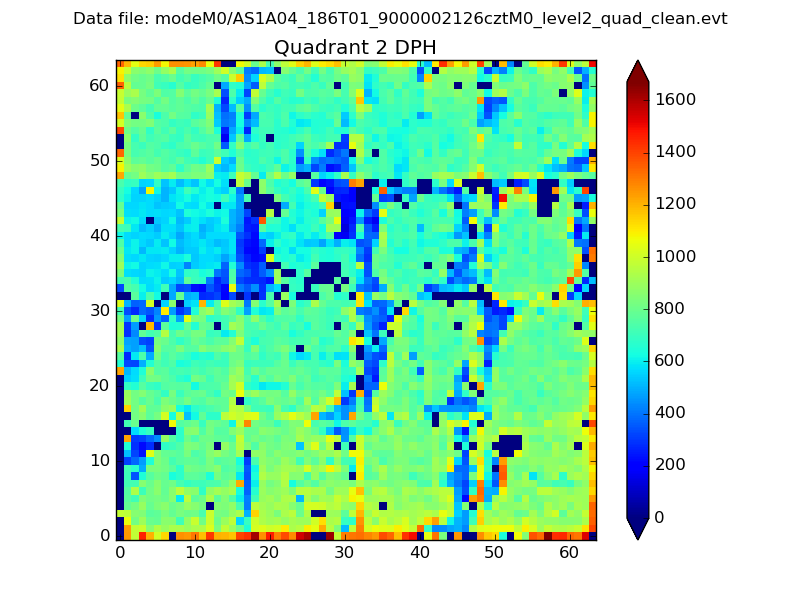
Histogram calculated using DETX and DETY for each event in the final _common_clean file
| Quadrant A |  |
 |
Quadrant B |
|---|---|---|---|
| Quadrant D | 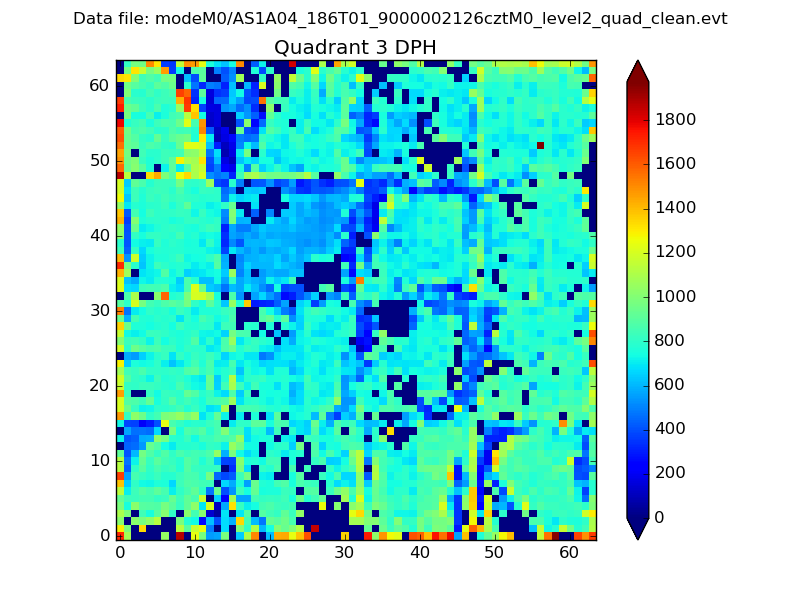 |
 |
Quadrant C |
| Plot type | Count rate plots | Images |
|---|---|---|
| Comparison with Poisson distribution Blue bars denote a histogram of data divided into 1 sec bins. Red curve is a Poisson curve with rate = median count rate of data. |
 |
 |
| Quadrant-wise count rates Data is divided into 100 sec bins |
 |
|
| Module-wise count rates for Quadrant A Data is divided into 100 sec bins |
 |
 |
| Module-wise count rates for Quadrant B Data is divided into 100 sec bins |
 |
 |
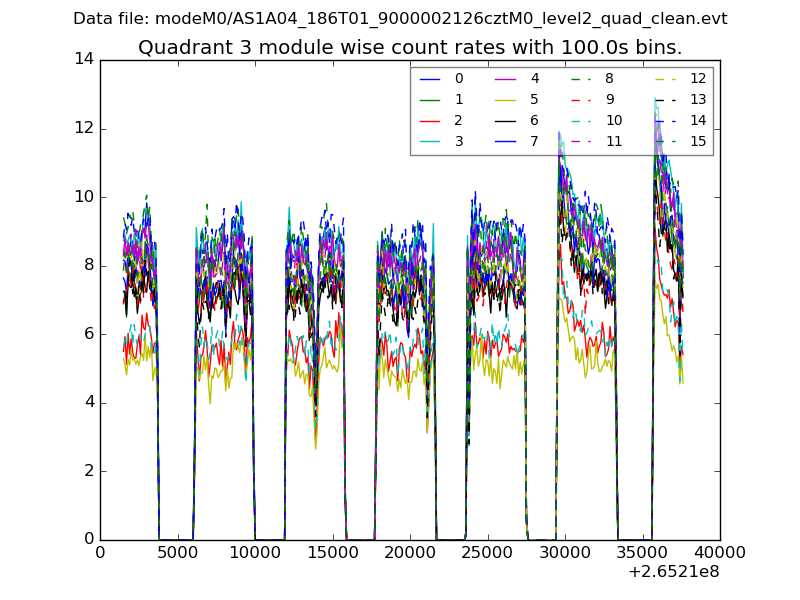
| Module-wise count rates for Quadrant C Data is divided into 100 sec bins |
 |
 |
| Module-wise count rates for Quadrant D Data is divided into 100 sec bins |
 |
 |
| Parameter | Plot |
|---|---|
| CZT HV Monitor |  |
| D_VDD |  |
| Temperature 1 | 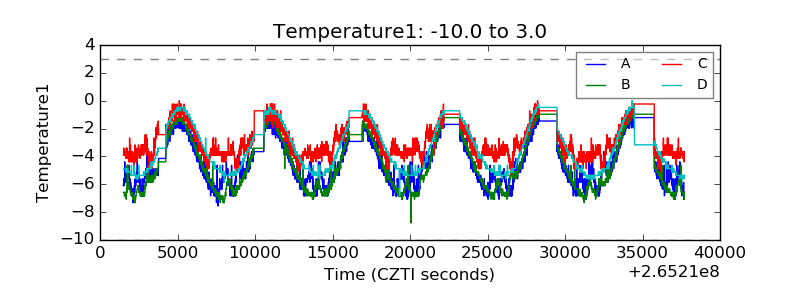 |
| Veto HV Monitor | 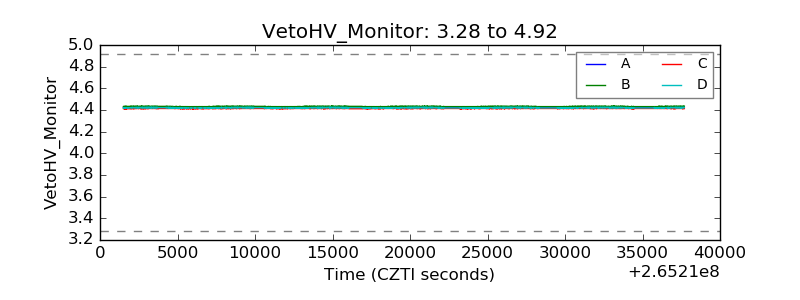 |
| Veto LLD | 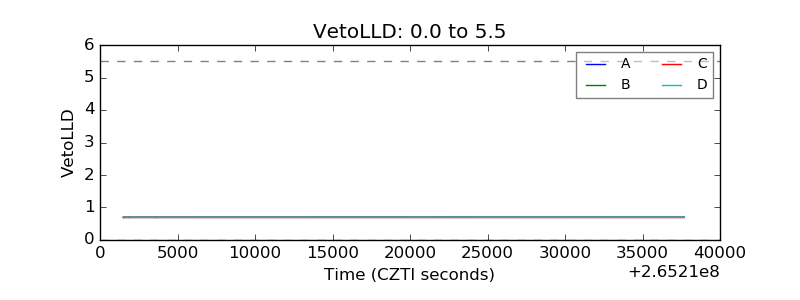 |
| Alpha Counter |  |
| _CPM_Rate |  |
| CZT Counter |  |
| +2.5 Volts monitor |  |
| +5 Volts monitor |  |
| _ROLL_ROT |  |
| _Roll_DEC |  |
| _Roll_RA | 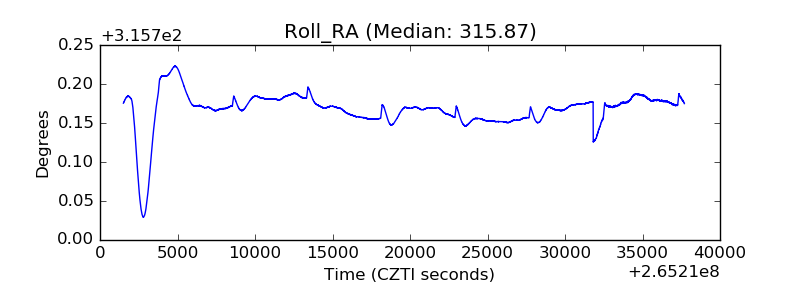 |
| Veto Counter | 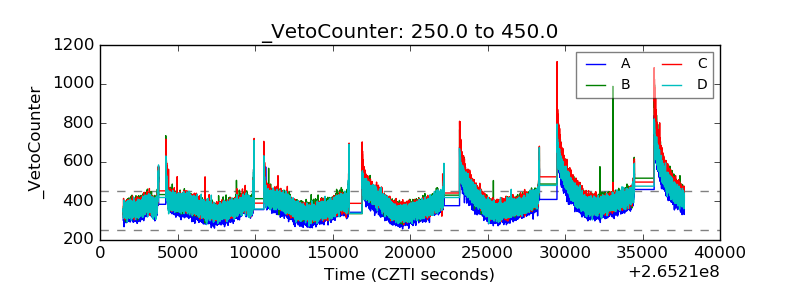 |