| Param | Original file | Final file |
|---|---|---|
| Filename | modeM0/AS1A04_186T01_9000002126_14410cztM0_level2.evt | modeM0/AS1A04_186T01_9000002126_14410cztM0_level2_quad_clean.evt |
| Size (bytes) | 1,255,446,720 | 199,578,240 |
| Size | 1.2 GB | 190.3 MB |
| Events in quadrant A | 7,093,675 | 1,308,725 |
| Events in quadrant B | 7,781,867 | 1,258,622 |
| Events in quadrant C | 10,097,664 | 1,234,552 |
| Events in quadrant D | 12,045,613 | 1,217,086 |
| Mode M9 | |||
|---|---|---|---|
| Quadrant | BADHDUFLAG | Total packets | Discarded packets |
| A | 0 | 20 | 0 |
| B | 0 | 20 | 0 |
| C | 0 | 20 | 0 |
| D | 0 | 20 | 0 |
| Mode M0 | |||
|---|---|---|---|
| Quadrant | BADHDUFLAG | Total packets | Discarded packets |
| A | 0 | 30738 | 4 |
| B | 0 | 32738 | 3 |
| C | 0 | 40203 | 3 |
| D | 0 | 45904 | 3 |
| Mode SS | |||
|---|---|---|---|
| Quadrant | BADHDUFLAG | Total packets | Discarded packets |
| A | 0 | 302 | 0 |
| B | 0 | 302 | 0 |
| C | 0 | 302 | 0 |
| D | 0 | 302 | 0 |
| Quadrant | Total seconds | Saturated seconds | Saturation percentage |
|---|---|---|---|
| A | 14865 | 150 | 1.009082% |
| B | 14865 | 274 | 1.843256% |
| C | 14865 | 181 | 1.217625% |
| D | 14865 | 1457 | 9.801547% |
Noise dominated data is calculated using 1-second bins in cleaned event files. If a bin has >2000 counts, and if more than 50% of those come from <1% of pixels, then it is considered to be noise-dominated and hence unusable.
| Quadrant | # 1 sec bins | Bins with >0 counts | Bins with >2000 counts | High rate bins dominated by noise | Noise dominated (total time) | Noise dominated (detector-on time) | Marked lightcurve |
|---|---|---|---|---|---|---|---|
| A | 16791 | 14866 | 5 | 5 | 0.03% | 0.03% | 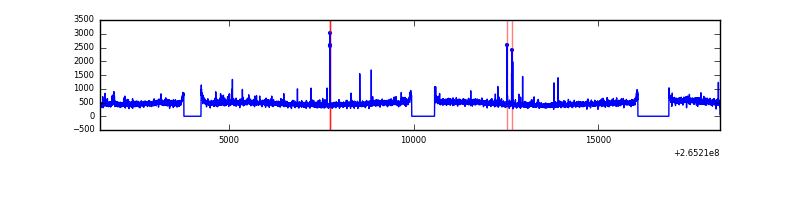 |
| B | 16791 | 14867 | 87 | 87 | 0.52% | 0.59% | 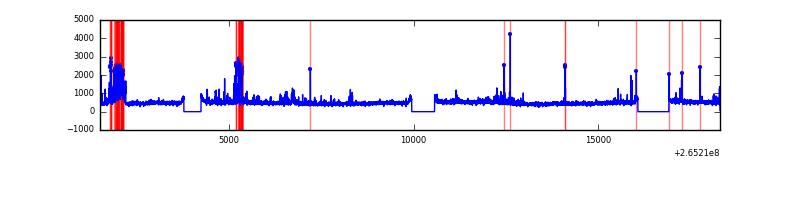 |
| C | 16791 | 14867 | 3 | 3 | 0.02% | 0.02% | 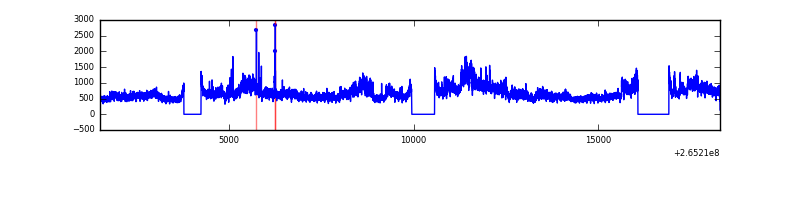 |
| D | 16791 | 14867 | 1160 | 1160 | 6.91% | 7.80% | 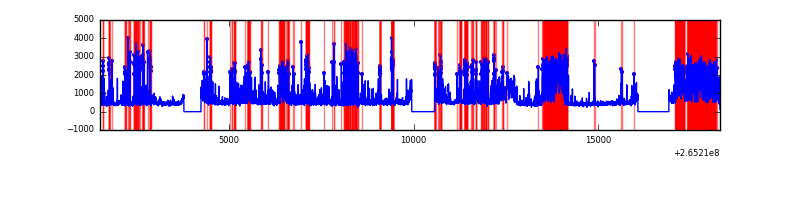 |
Top three noisy pixels from each quadrant. If the there are fewer than three noisy pixels in the level2.evt file, extra rows are filled as -1
| Pixel properties | Quadrant properties | ||||||
|---|---|---|---|---|---|---|---|
| Quadrant | DetID | PixID | Counts | Sigma | Mean | Median | Sigma |
| A | 12 | 189 | 108867 | 298.04 | 1780 | 1748 | 359.4 |
| A | 8 | 15 | 63719 | 172.42 | 1780 | 1748 | 359.4 |
| A | 4 | 2 | 49085 | 131.71 | 1780 | 1748 | 359.4 |
| B | 0 | 85 | 404842 | 1199.34 | 1758 | 1715 | 336.1 |
| B | 0 | 229 | 188910 | 556.92 | 1758 | 1715 | 336.1 |
| B | 4 | 142 | 77855 | 226.52 | 1758 | 1715 | 336.1 |
| C | 3 | 233 | 3407313 | 8627.27 | 1700 | 1707 | 394.7 |
| C | 0 | 207 | 47997 | 117.26 | 1700 | 1707 | 394.7 |
| C | 13 | 61 | 12271 | 26.76 | 1700 | 1707 | 394.7 |
| D | 13 | 122 | 3453119 | 8669.67 | 1660 | 1619 | 398.1 |
| D | 10 | 199 | 949776 | 2381.63 | 1660 | 1619 | 398.1 |
| D | 12 | 110 | 384349 | 961.36 | 1660 | 1619 | 398.1 |
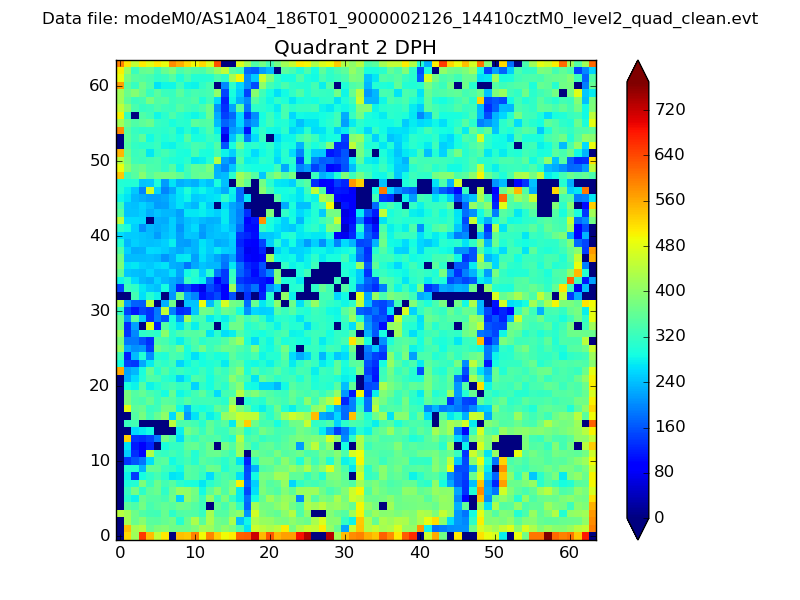
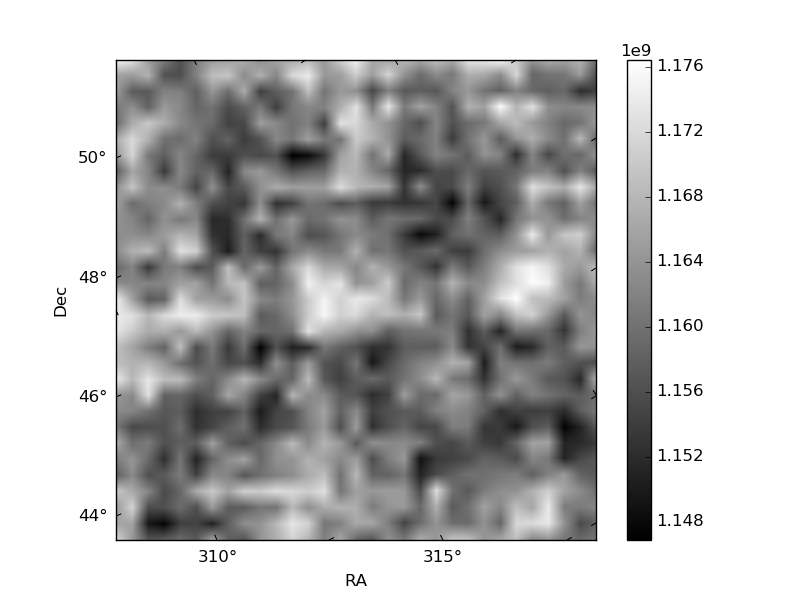
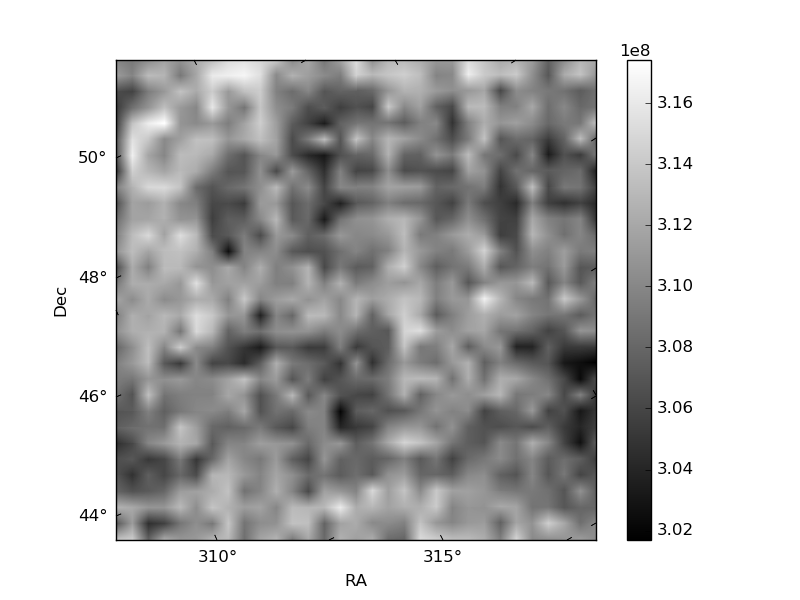
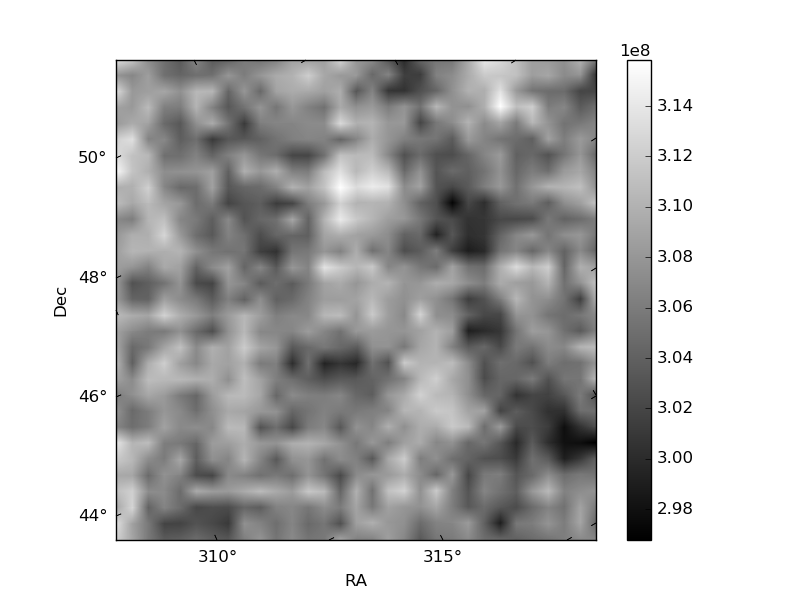
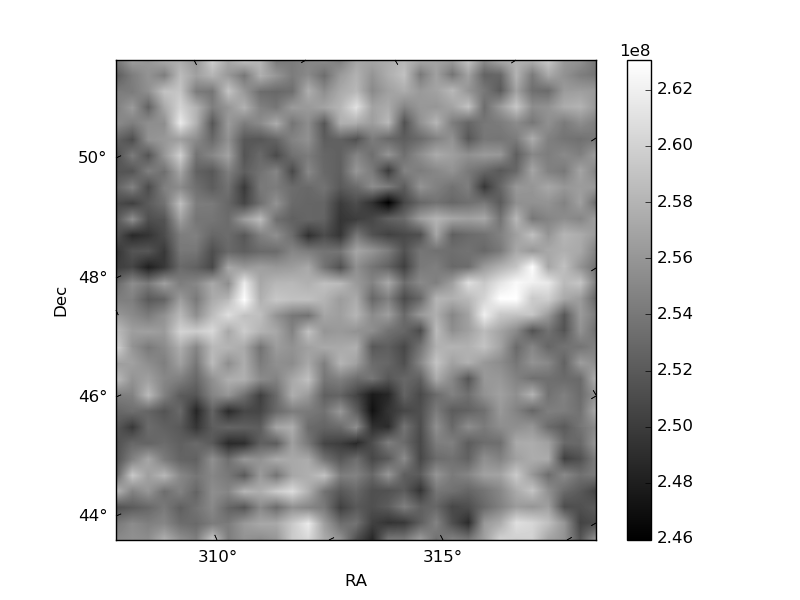
Histogram calculated using DETX and DETY for each event in the final _common_clean file
| Quadrant A | 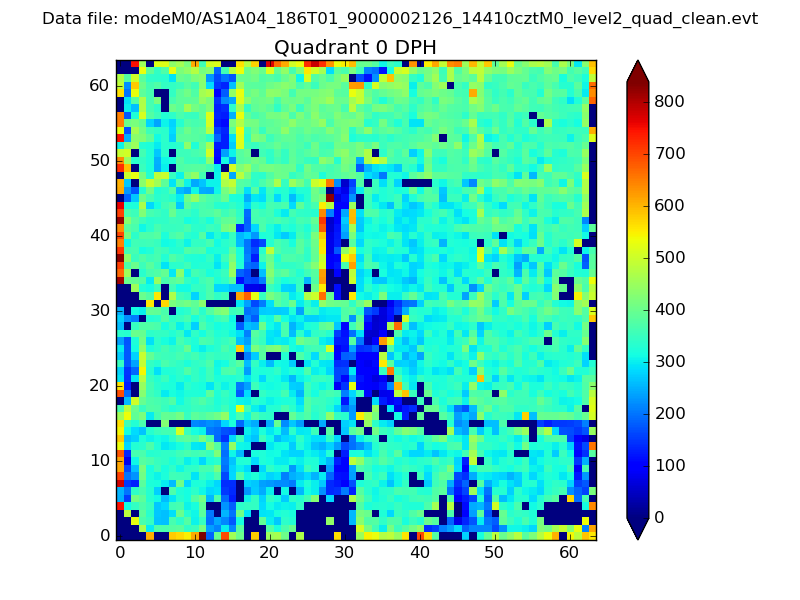 |
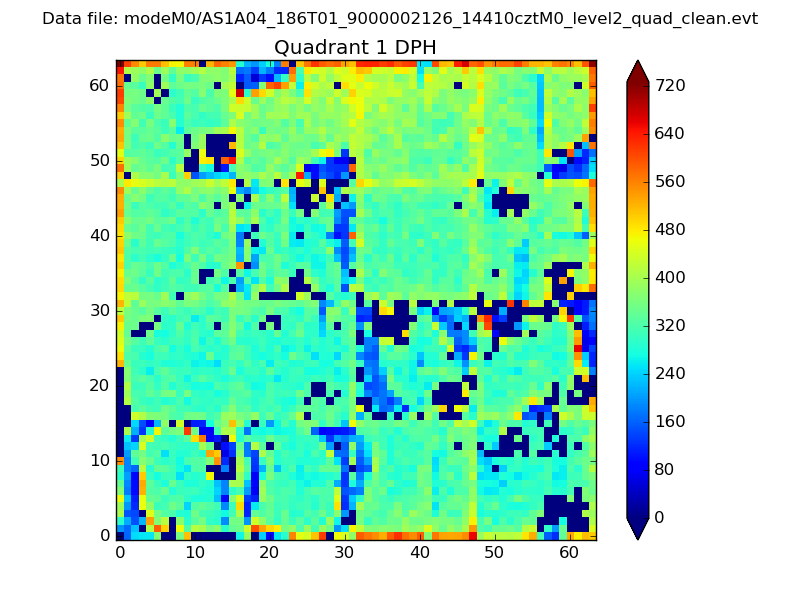 |
Quadrant B |
|---|---|---|---|
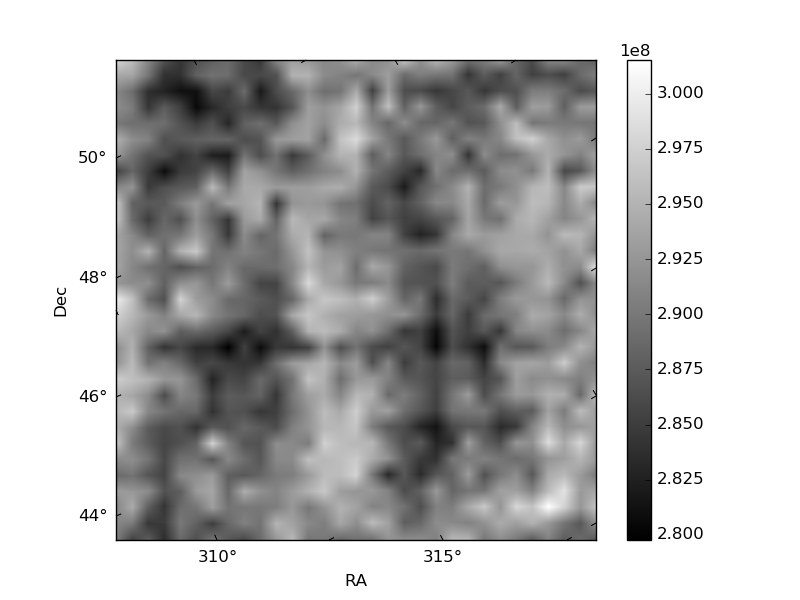
| Quadrant D | 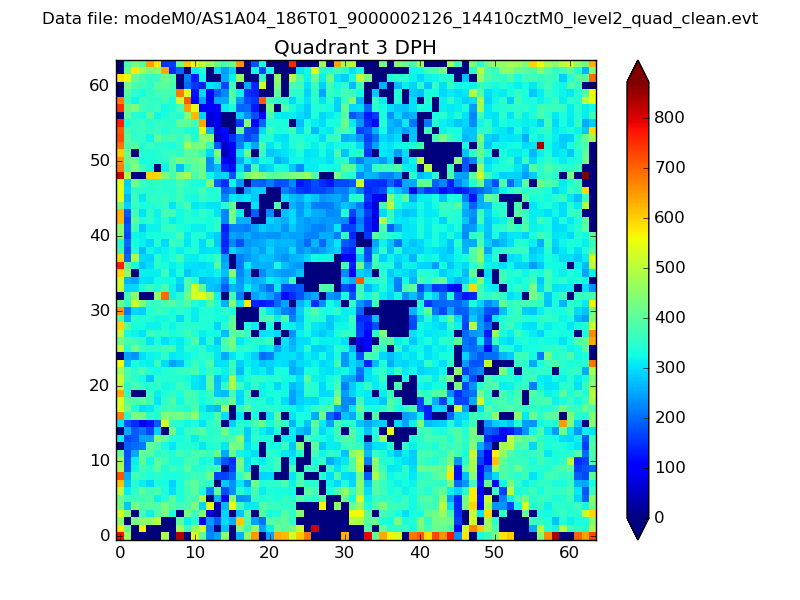 |
 |
Quadrant C |
| Plot type | Count rate plots | Images |
|---|---|---|
| Comparison with Poisson distribution Blue bars denote a histogram of data divided into 1 sec bins. Red curve is a Poisson curve with rate = median count rate of data. |
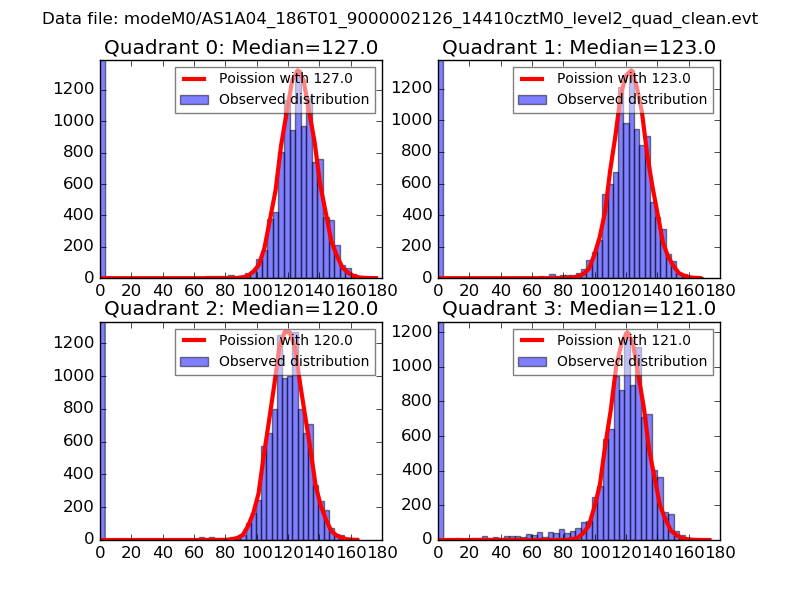 |
 |
| Quadrant-wise count rates Data is divided into 100 sec bins |
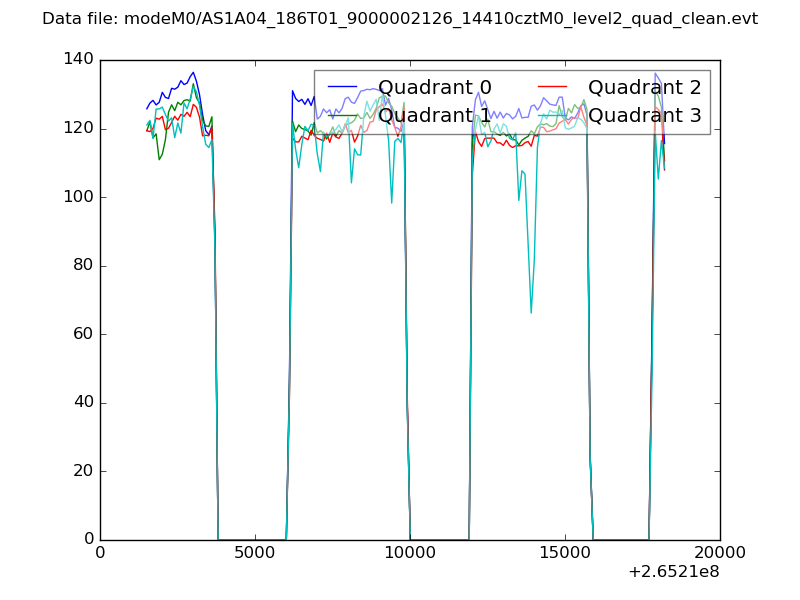 |
|
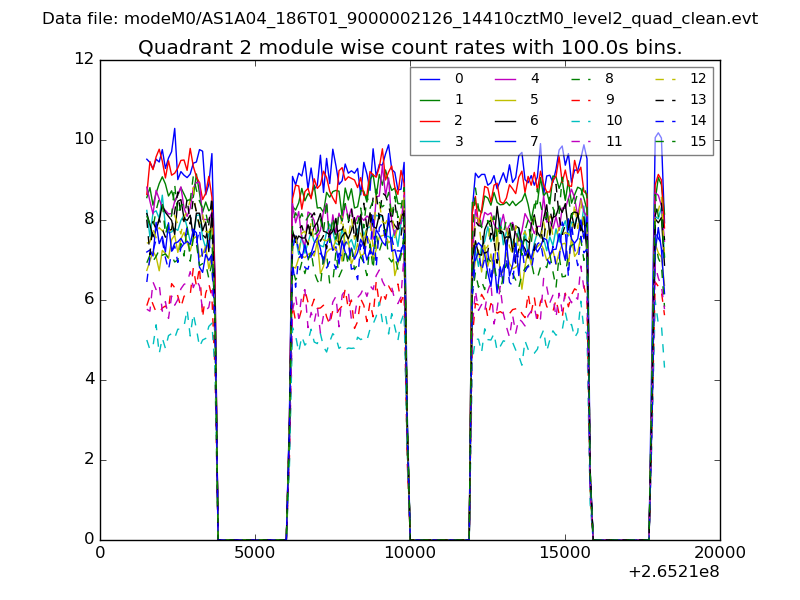
| Module-wise count rates for Quadrant A Data is divided into 100 sec bins |
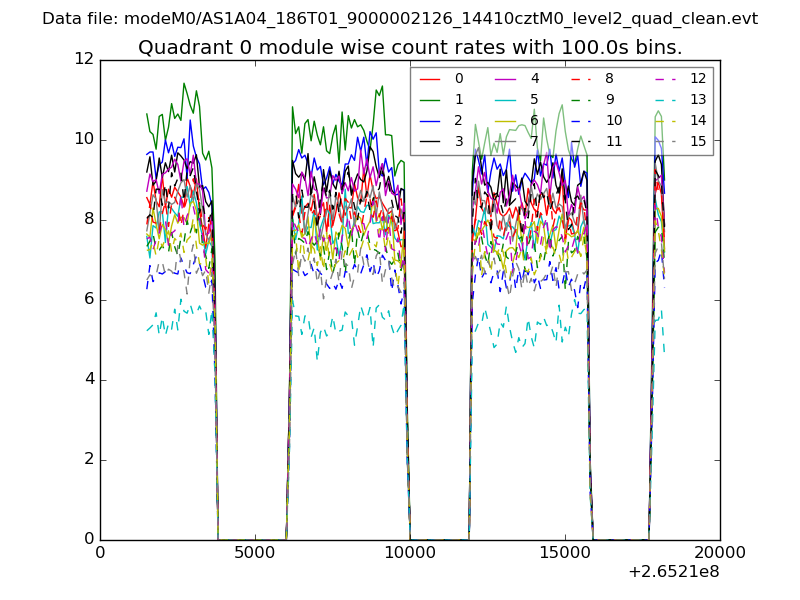 |
 |
| Module-wise count rates for Quadrant B Data is divided into 100 sec bins |
 |
 |
| Module-wise count rates for Quadrant C Data is divided into 100 sec bins |
 |
 |
| Module-wise count rates for Quadrant D Data is divided into 100 sec bins |
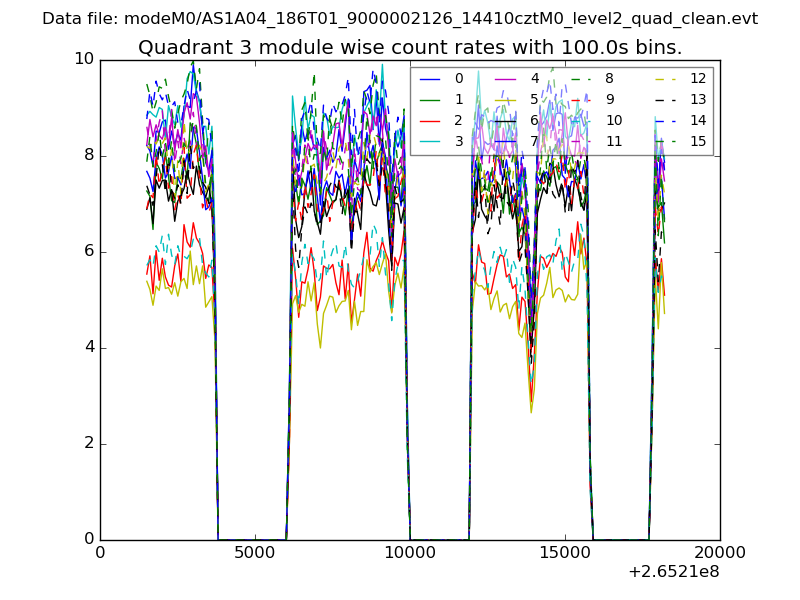 |
 |
| Parameter | Plot |
|---|---|
| CZT HV Monitor |  |
| D_VDD | 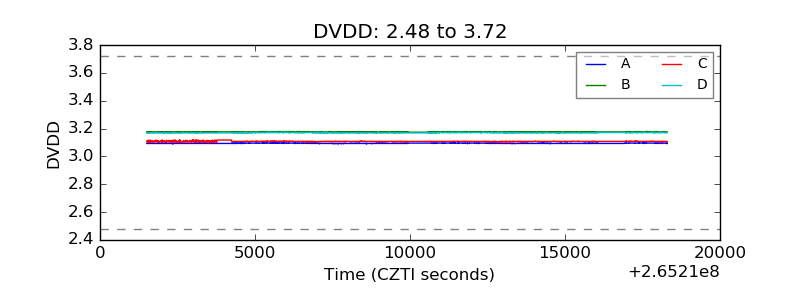 |
| Temperature 1 | 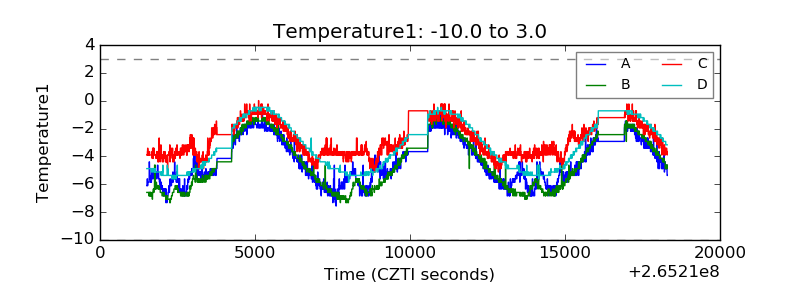 |
| Veto HV Monitor | 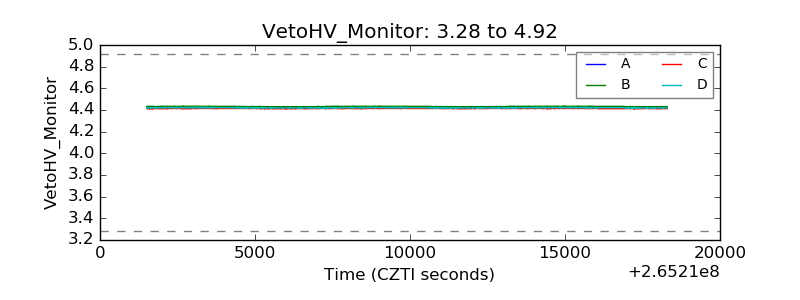 |
| Veto LLD | 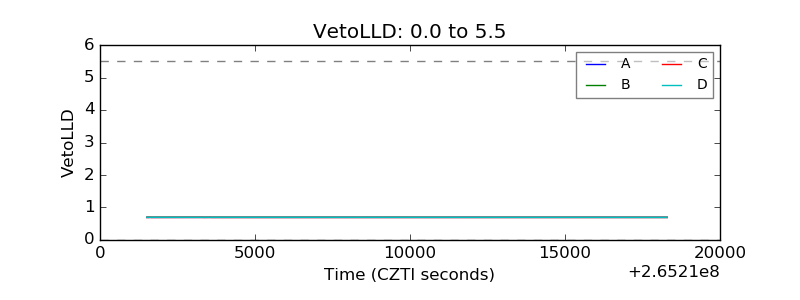 |
| Alpha Counter | 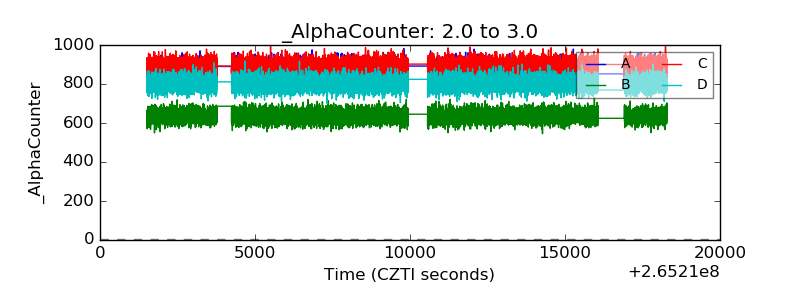 |
| _CPM_Rate | 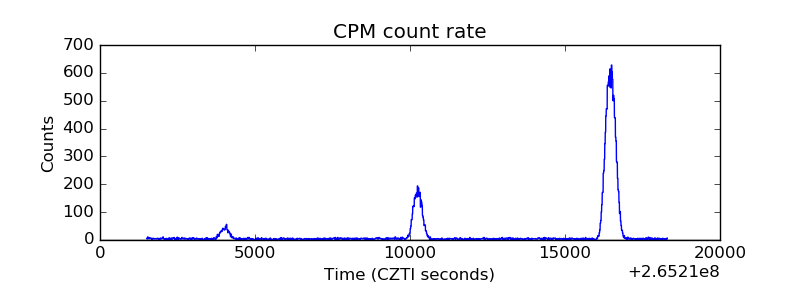 |
| CZT Counter | 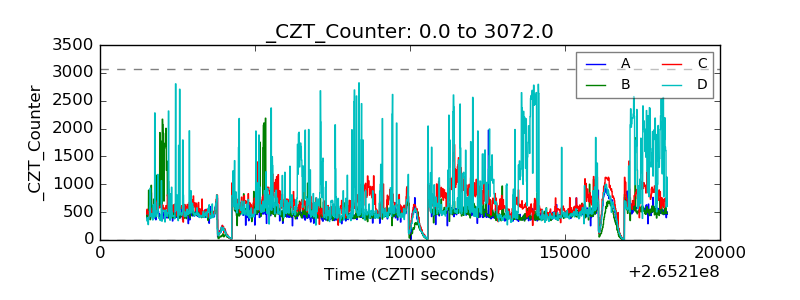 |
| +2.5 Volts monitor |  |
| +5 Volts monitor |  |
| _ROLL_ROT | 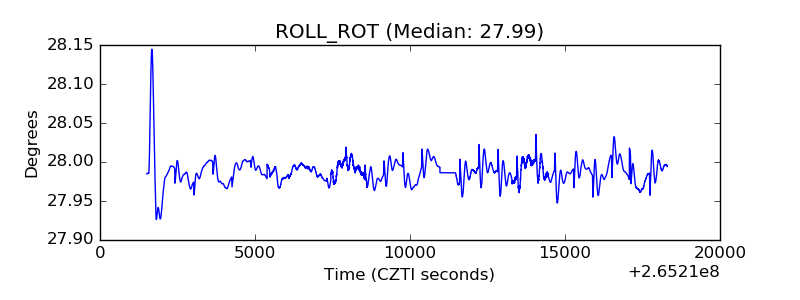 |
| _Roll_DEC | 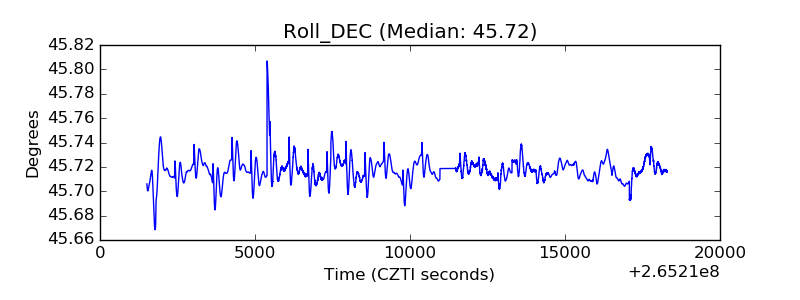 |
| _Roll_RA | 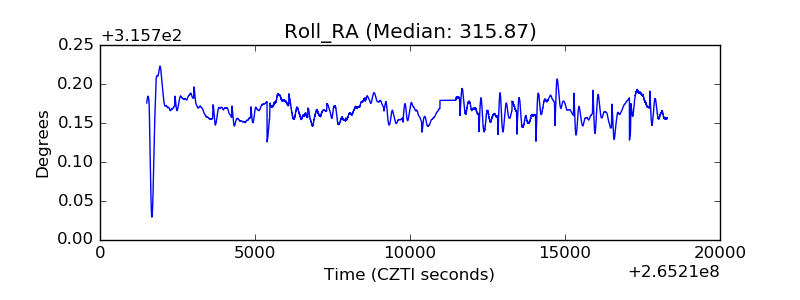 |
| Veto Counter |  |