| Param | Original file | Final file |
|---|---|---|
| Filename | modeM0/AS1A04_186T01_9000002126_14412cztM0_level2.evt | modeM0/AS1A04_186T01_9000002126_14412cztM0_level2_quad_clean.evt |
| Size (bytes) | 526,913,280 | 99,552,960 |
| Size | 502.5 MB | 94.9 MB |
| Events in quadrant A | 3,122,918 | 662,505 |
| Events in quadrant B | 3,634,820 | 644,652 |
| Events in quadrant C | 4,062,279 | 643,324 |
| Events in quadrant D | 4,708,629 | 623,020 |
| Mode M9 | |||
|---|---|---|---|
| Quadrant | BADHDUFLAG | Total packets | Discarded packets |
| A | 0 | 11 | 0 |
| B | 0 | 11 | 0 |
| C | 0 | 11 | 0 |
| D | 0 | 12 | 0 |
| Mode M0 | |||
|---|---|---|---|
| Quadrant | BADHDUFLAG | Total packets | Discarded packets |
| A | 0 | 13609 | 3 |
| B | 0 | 15049 | 2 |
| C | 0 | 16341 | 2 |
| D | 0 | 18327 | 2 |
| Mode SS | |||
|---|---|---|---|
| Quadrant | BADHDUFLAG | Total packets | Discarded packets |
| A | 0 | 128 | 0 |
| B | 0 | 128 | 0 |
| C | 0 | 128 | 0 |
| D | 0 | 128 | 0 |
| Quadrant | Total seconds | Saturated seconds | Saturation percentage |
|---|---|---|---|
| A | 6327 | 37 | 0.584795% |
| B | 6327 | 165 | 2.607871% |
| C | 6327 | 106 | 1.675360% |
| D | 6327 | 490 | 7.744587% |
Noise dominated data is calculated using 1-second bins in cleaned event files. If a bin has >2000 counts, and if more than 50% of those come from <1% of pixels, then it is considered to be noise-dominated and hence unusable.
| Quadrant | # 1 sec bins | Bins with >0 counts | Bins with >2000 counts | High rate bins dominated by noise | Noise dominated (total time) | Noise dominated (detector-on time) | Marked lightcurve |
|---|---|---|---|---|---|---|---|
| A | 7463 | 6328 | 6 | 6 | 0.08% | 0.09% | 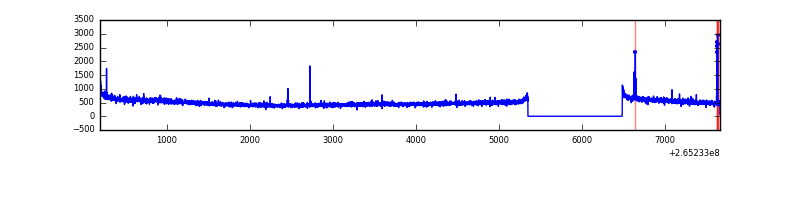 |
| B | 7463 | 6328 | 74 | 74 | 0.99% | 1.17% | 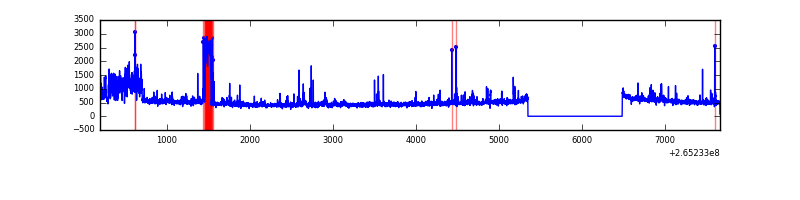 |
| C | 7463 | 6329 | 15 | 15 | 0.20% | 0.24% | 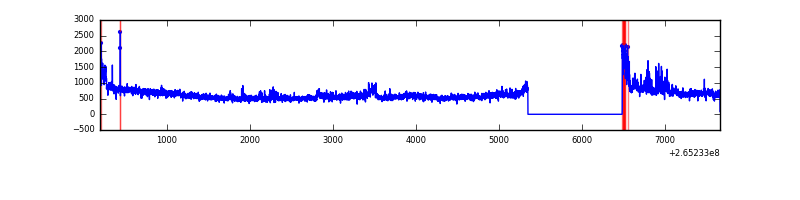 |
| D | 7463 | 6329 | 313 | 313 | 4.19% | 4.95% | 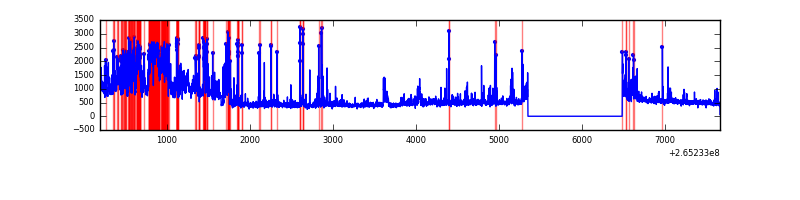 |
Top three noisy pixels from each quadrant. If the there are fewer than three noisy pixels in the level2.evt file, extra rows are filled as -1
| Pixel properties | Quadrant properties | ||||||
|---|---|---|---|---|---|---|---|
| Quadrant | DetID | PixID | Counts | Sigma | Mean | Median | Sigma |
| A | 8 | 15 | 65758 | 411.66 | 779 | 764 | 157.9 |
| A | 12 | 189 | 22435 | 137.26 | 779 | 764 | 157.9 |
| A | 15 | 69 | 14017 | 83.94 | 779 | 764 | 157.9 |
| B | 0 | 189 | 251580 | 1726.04 | 771 | 752 | 145.3 |
| B | 0 | 229 | 236034 | 1619.07 | 771 | 752 | 145.3 |
| B | 15 | 222 | 35228 | 237.24 | 771 | 752 | 145.3 |
| C | 3 | 233 | 1108542 | 6317.32 | 755 | 759 | 175.4 |
| C | 0 | 207 | 7895 | 40.69 | 755 | 759 | 175.4 |
| C | 13 | 61 | 5372 | 26.31 | 755 | 759 | 175.4 |
| D | 13 | 122 | 1369768 | 7051.15 | 739 | 721 | 194.2 |
| D | 1 | 52 | 200950 | 1031.26 | 739 | 721 | 194.2 |
| D | 2 | 120 | 99701 | 509.79 | 739 | 721 | 194.2 |
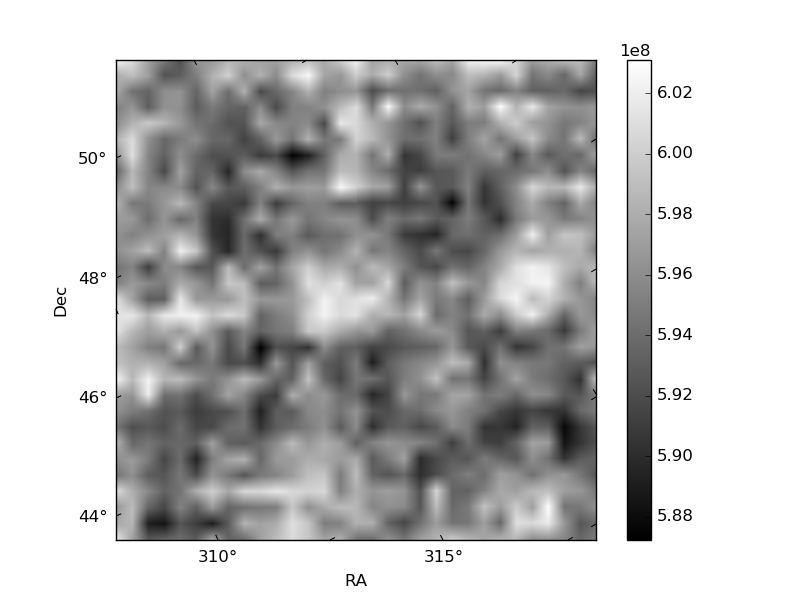
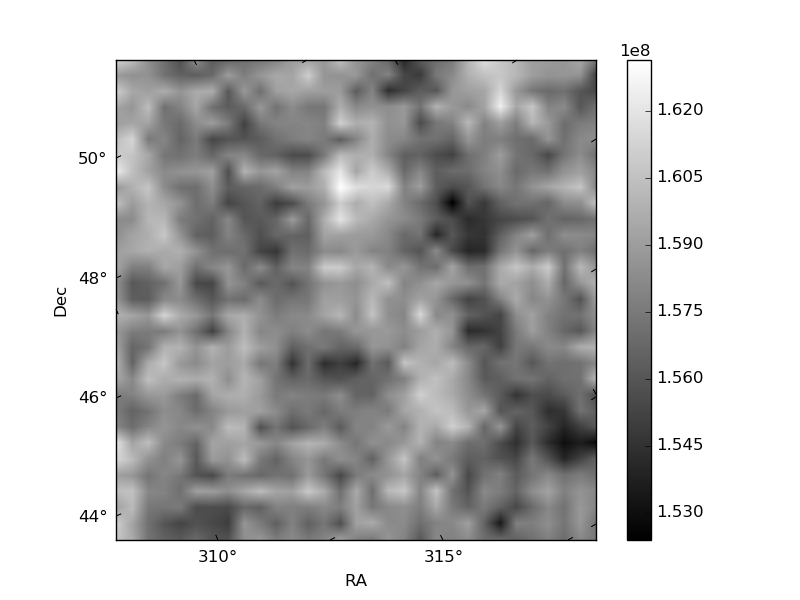
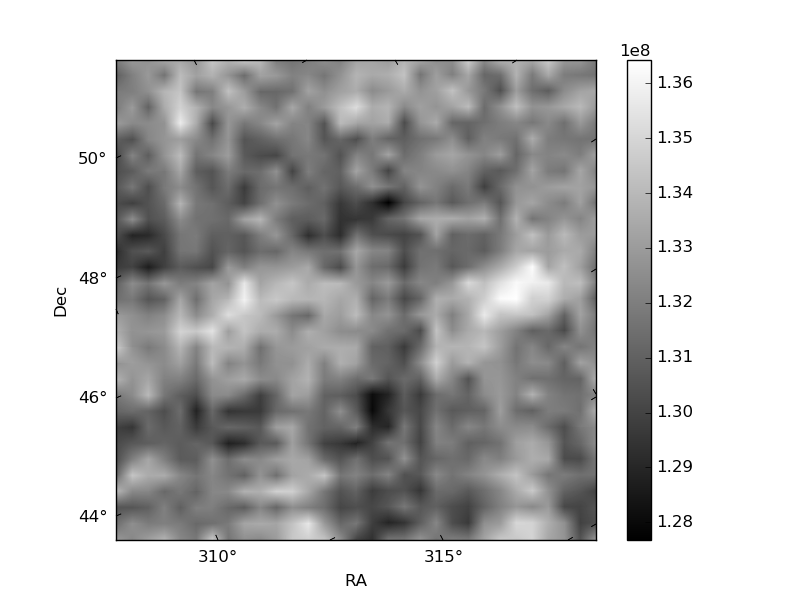
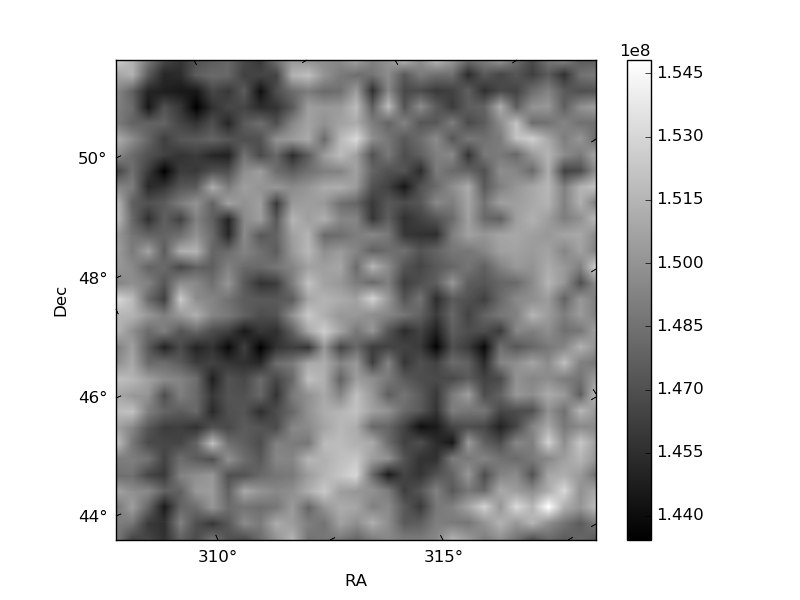
Histogram calculated using DETX and DETY for each event in the final _common_clean file
| Quadrant A | 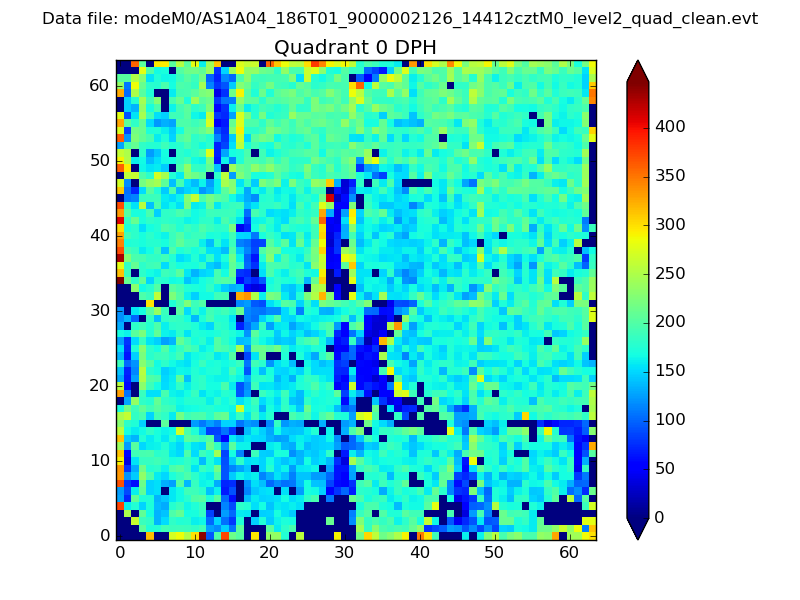 |
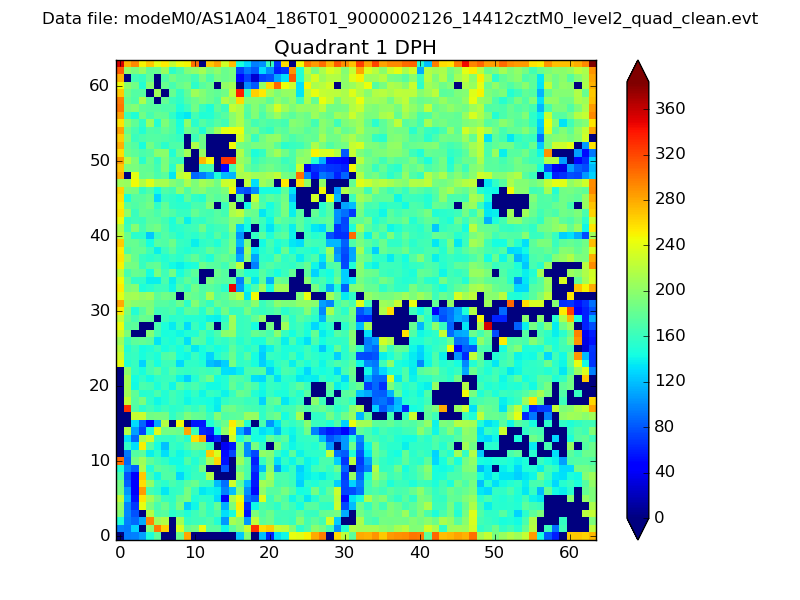 |
Quadrant B |
|---|---|---|---|
| Quadrant D | 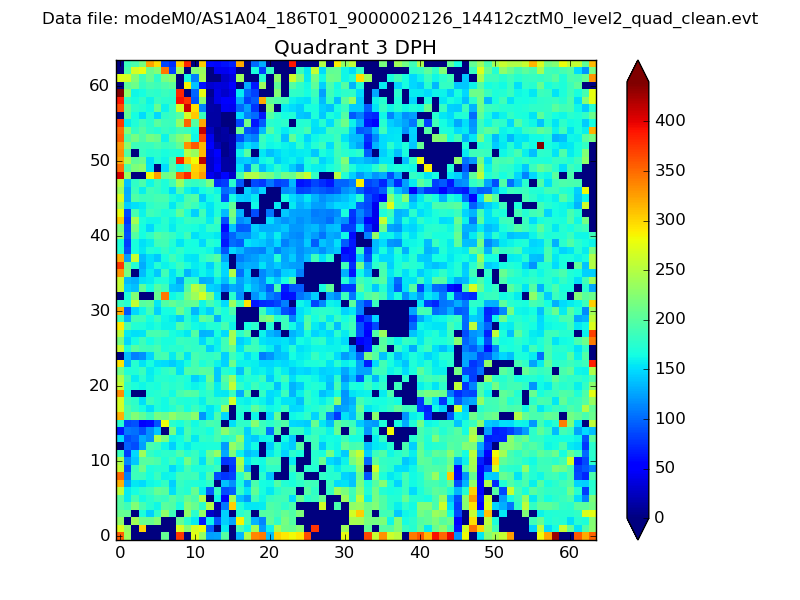 |
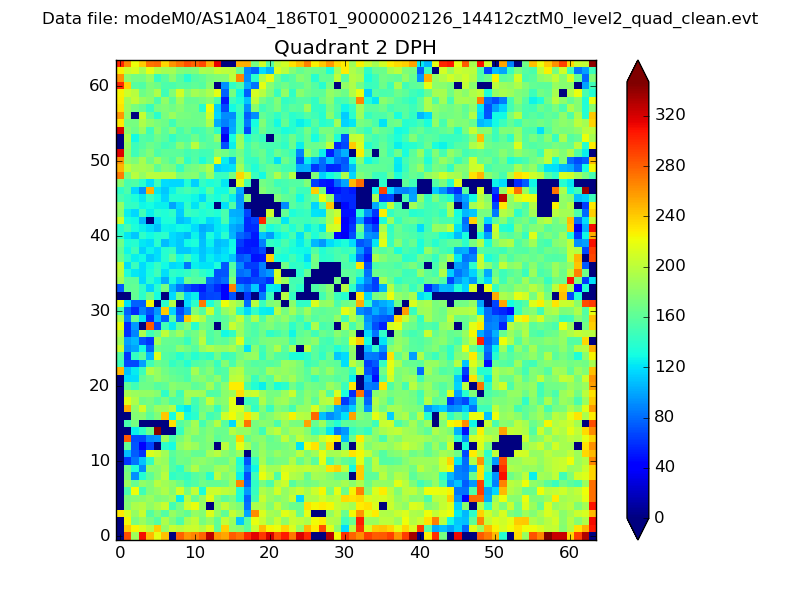 |
Quadrant C |
| Plot type | Count rate plots | Images |
|---|---|---|
| Comparison with Poisson distribution Blue bars denote a histogram of data divided into 1 sec bins. Red curve is a Poisson curve with rate = median count rate of data. |
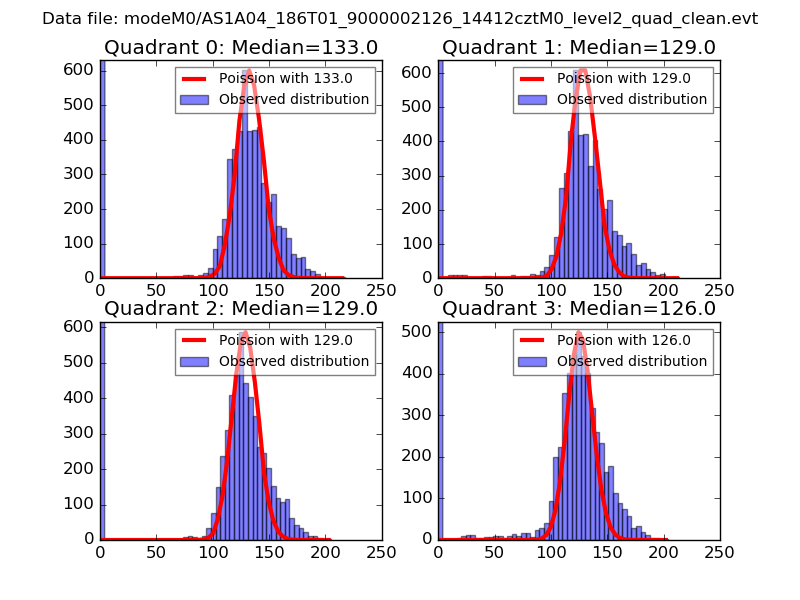 |
 |
| Quadrant-wise count rates Data is divided into 100 sec bins |
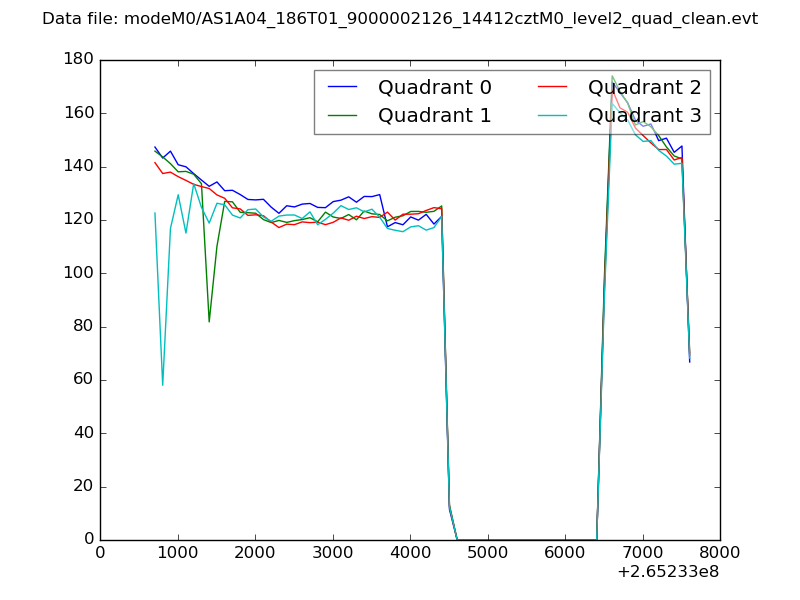 |
|
| Module-wise count rates for Quadrant A Data is divided into 100 sec bins |
 |
 |
| Module-wise count rates for Quadrant B Data is divided into 100 sec bins |
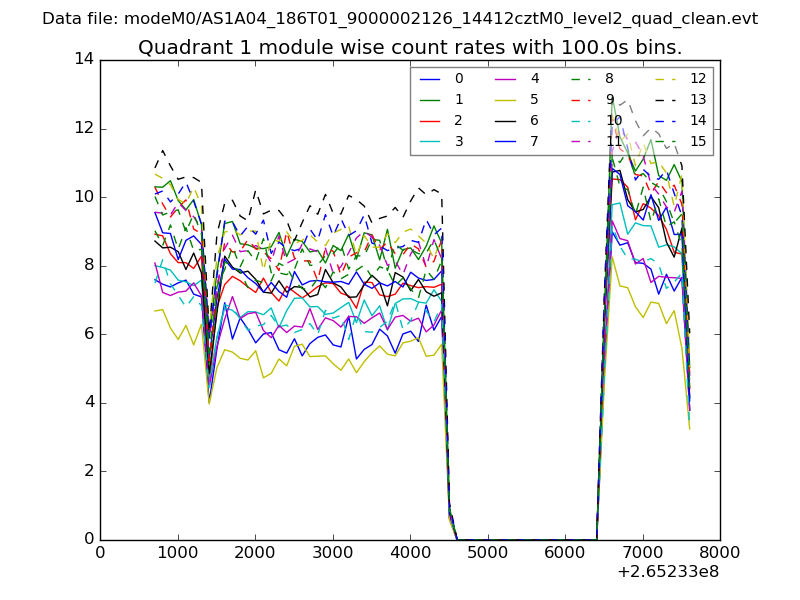 |
 |
| Module-wise count rates for Quadrant C Data is divided into 100 sec bins |
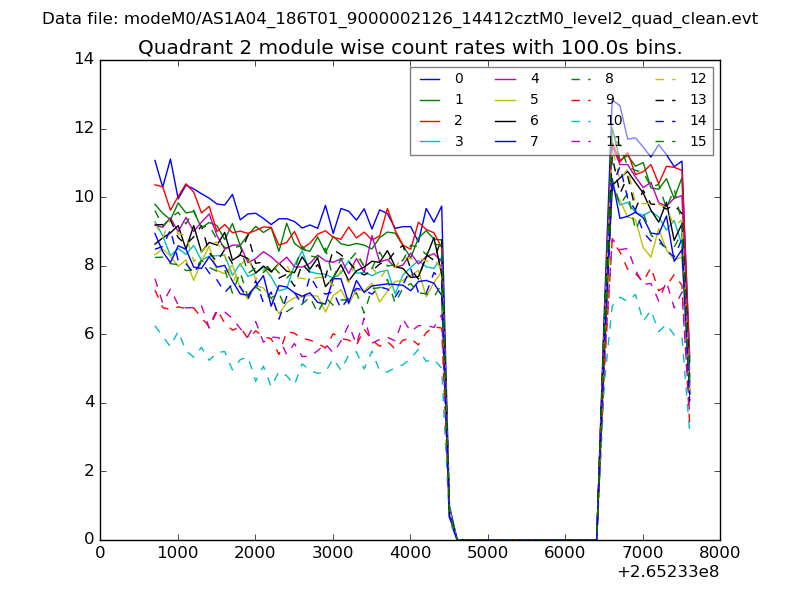 |
 |
| Module-wise count rates for Quadrant D Data is divided into 100 sec bins |
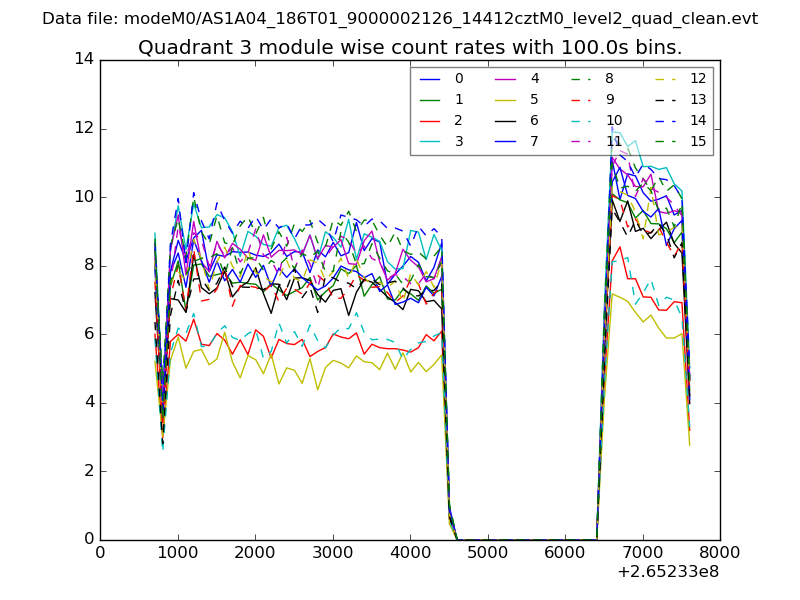 |
 |
| Parameter | Plot |
|---|---|
| CZT HV Monitor | 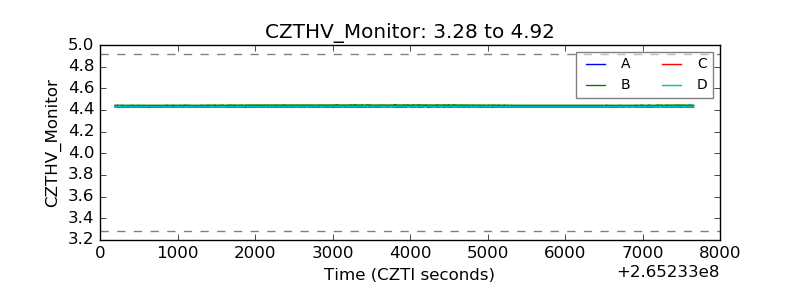 |
| D_VDD | 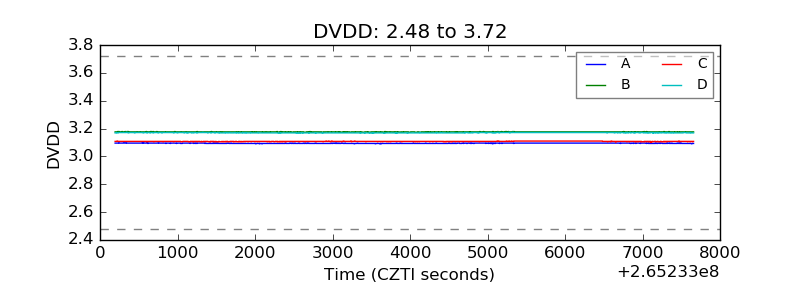 |
| Temperature 1 | 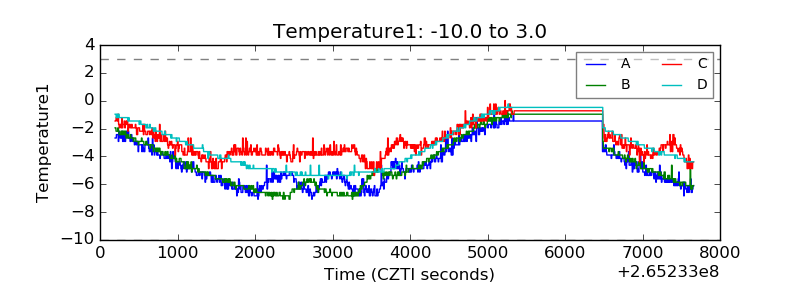 |
| Veto HV Monitor | 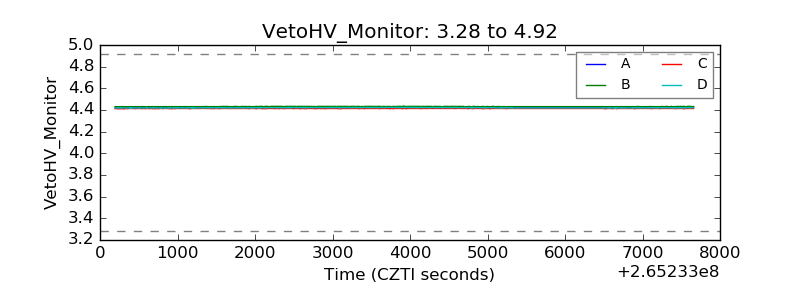 |
| Veto LLD |  |
| Alpha Counter | 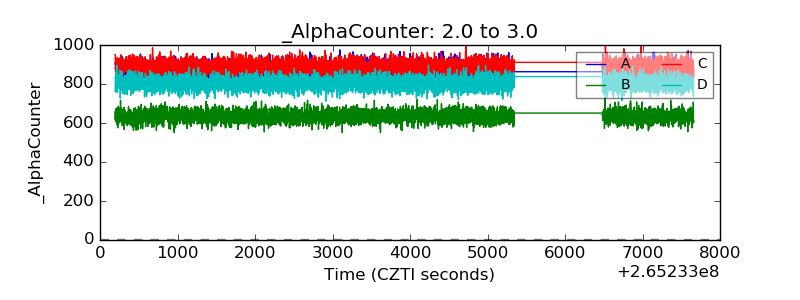 |
| _CPM_Rate | 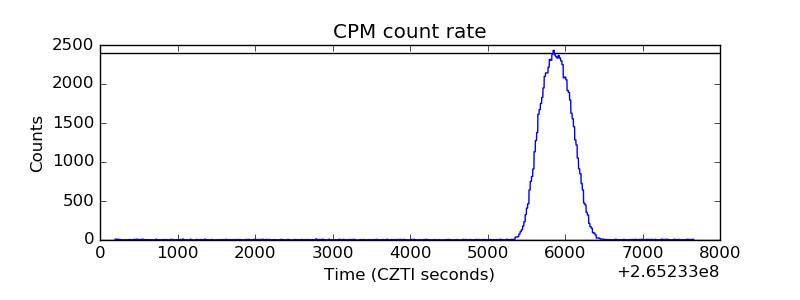 |
| CZT Counter | 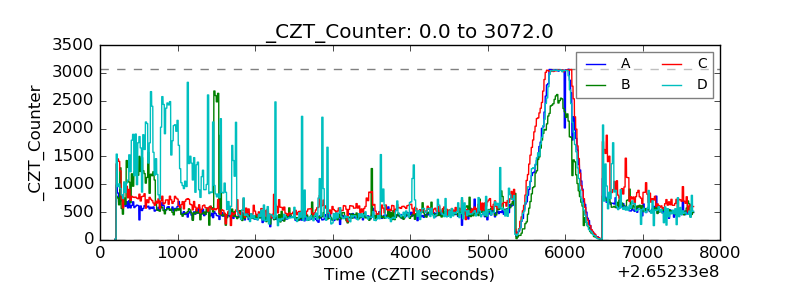 |
| +2.5 Volts monitor |  |
| +5 Volts monitor |  |
| _ROLL_ROT |  |
| _Roll_DEC | 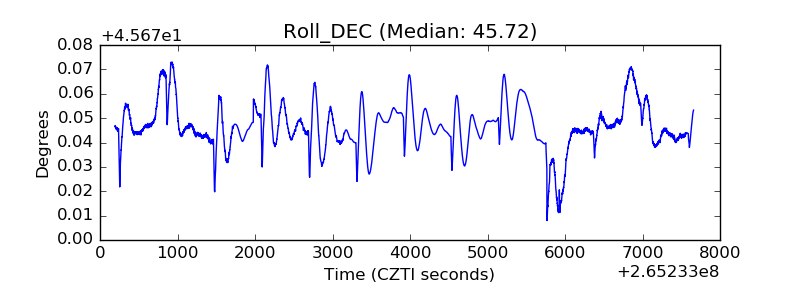 |
| _Roll_RA | 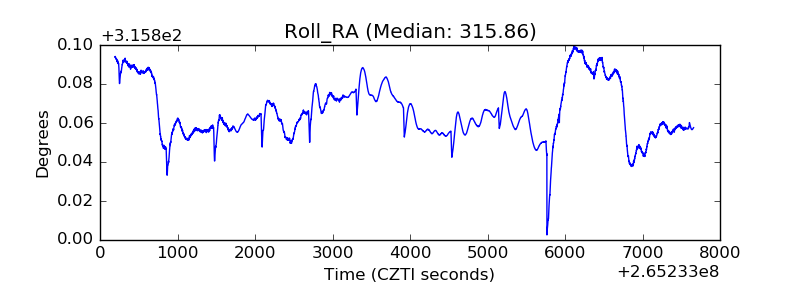 |
| Veto Counter |  |